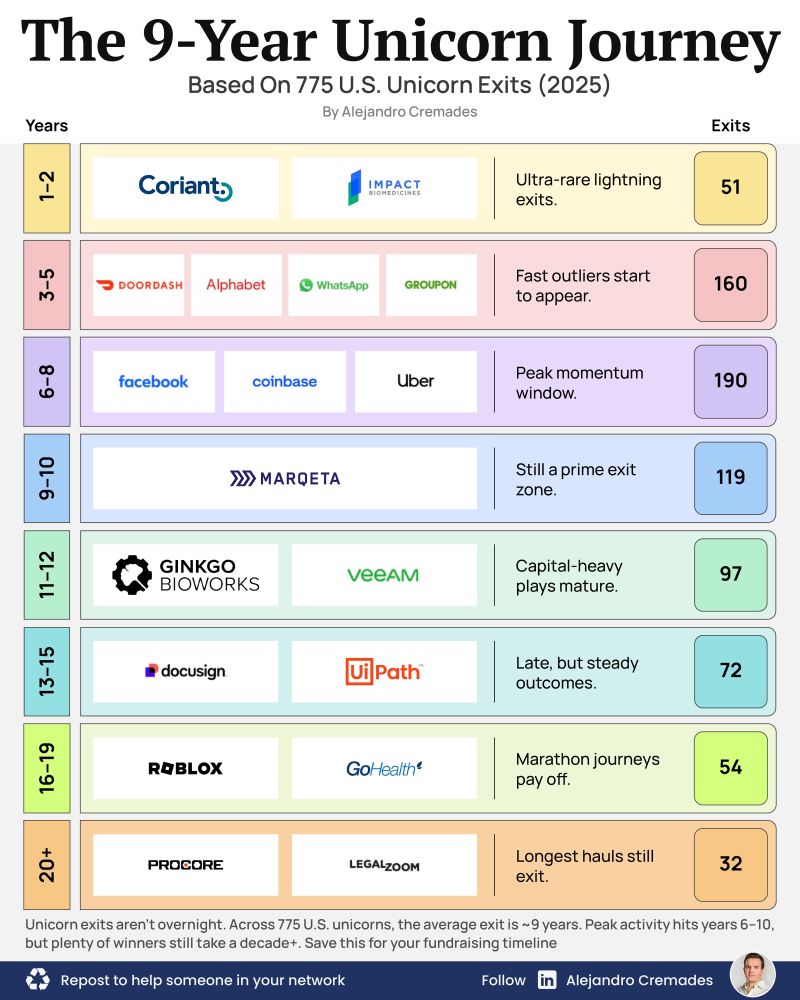
Unicorn Exit Journey: Years to Acquisition (775 US Exits)
This visual charts the journey of 775 US unicorn exits over time, showcasing sample companies and the number of exits within different year ranges. Founders can use this to benchmark potential exit timelines and understand the distribution of successful acquisitions.
This visual charts the journey of 775 US unicorn exits over time, showcasing sample companies and the number of exits within different year ranges. Founders ca…
Tags: unicorn exits, startup life cycle, exit strategy, acquisition timeline, startup journey, company growth, venture capital, founder insights
View on Startup Fundraising ·
More M&A visuals ·
Browse all visuals