Competitor 2x2 Matrix in a Pitch Deck: How to Prove
A positioning map is a claim about you, not only your rivals. How to back up the corner you put yourself in with a price.
Competitor 2x2 Matrix: How to Prove the Quadrant You Put Yourself In
Most competitor two-by-twos put the startup alone in the best corner. Investors expect that, so the dot itself proves nothing. What they look for is whether the rest of the deck explains why the company can sit there when the rivals cannot. This guide reads four positioning maps from real decks and shows which ones give that explanation and which leave it out.
TL;DR
Treat your own dot as a claim that needs evidence. For each axis, state the number or fact that puts you on that side, and if you claim a corner rivals have not reached (cheaper and better, simpler and more powerful), say what lets you get there and whether it already works.
SkillSesh is the easiest to check: its "affordable" side is consistent with a 10% commission on page 6 against the 40% it says rivals take on page 2. Tasko and Popping both claim low price with high service; Tasko names its cost lever but marks the automation part as unfinished, and Popping gives no price at all. InternSource draws a separate map for each side of its marketplace, and on the student map it does not place itself in the top corner.
Four positioning maps and the evidence behind each placement
Each slide is shown as it appears in the original deck, ordered from the placement best supported by the rest of the deck to the least.
SkillSesh competition slide — slide 7
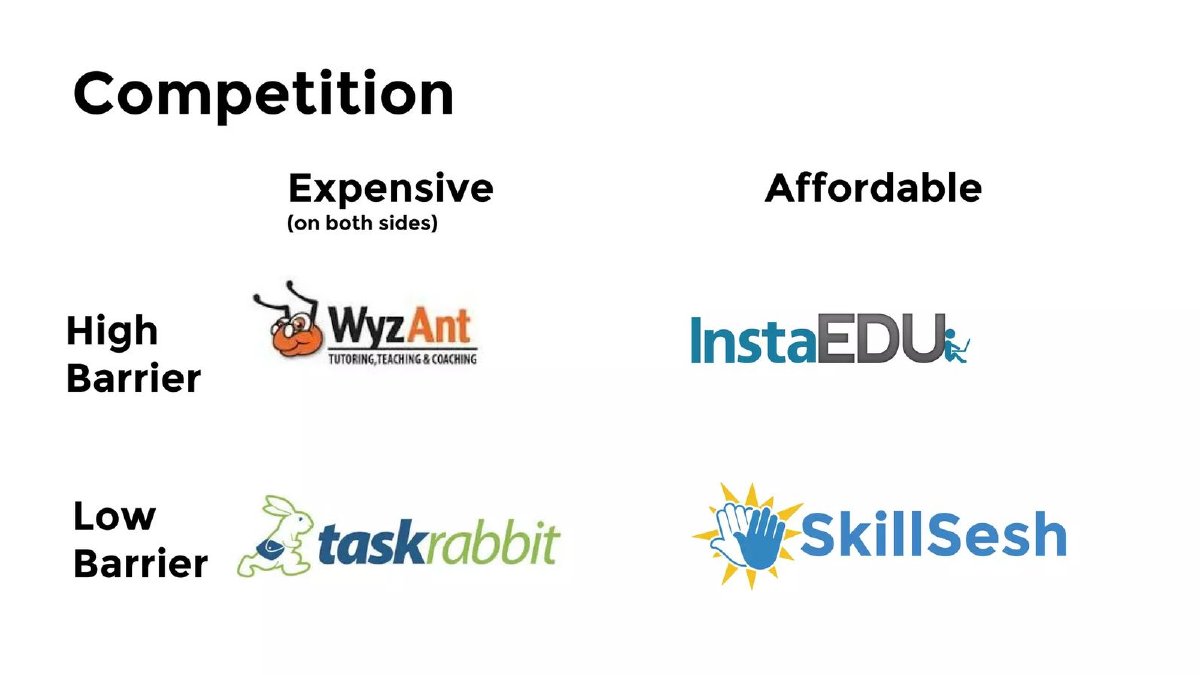
Peer-to-peer marketplace for local skill lessons, pre-launch. Page 2 says conventional tutoring platforms "take 40% of teacher pay"; page 6 says SkillSesh will take a 10% commission per session at launch, marked as the "Lowest % in tutoring".
SkillSesh deck, slide 7. Exact stored slide matched to this analysis.
Our analysis: A placement the deck partly evidences: the price side is quantified, the barrier side is described.
Evidence and limitation: The affordable column has a figure behind it two slides away: 10% against the 40% the deck attributes to rivals. "On both sides" tells the reader that price means what the teacher gives up and what the learner pays. "Barrier" is not defined on this slide; page 8 says "lowest friction for all parties" and page 5 says sign-up takes under five minutes, which is the nearest the deck gets to a measure. The 40% figure is not sourced or attributed to a named rival.
What a founder can adapt: Move the 10% and the rival commission onto the grid itself, name whose 40% it is, and define barrier, for example as minutes to first booking.
Supporting analysis
What the deck claims: "Competition" grid with columns "Expensive (on both sides)" and "Affordable" and rows "High Barrier" and "Low Barrier". WyzAnt: expensive, high barrier. TaskRabbit: expensive, low barrier. InstaEDU: affordable, high barrier. SkillSesh: affordable, low barrier.
Presentation choice: It shows how a single number elsewhere in the deck can turn a column label into a checkable claim.
When it does not fit: Leaving the reader to connect page 2, page 6 and page 7 on their own.
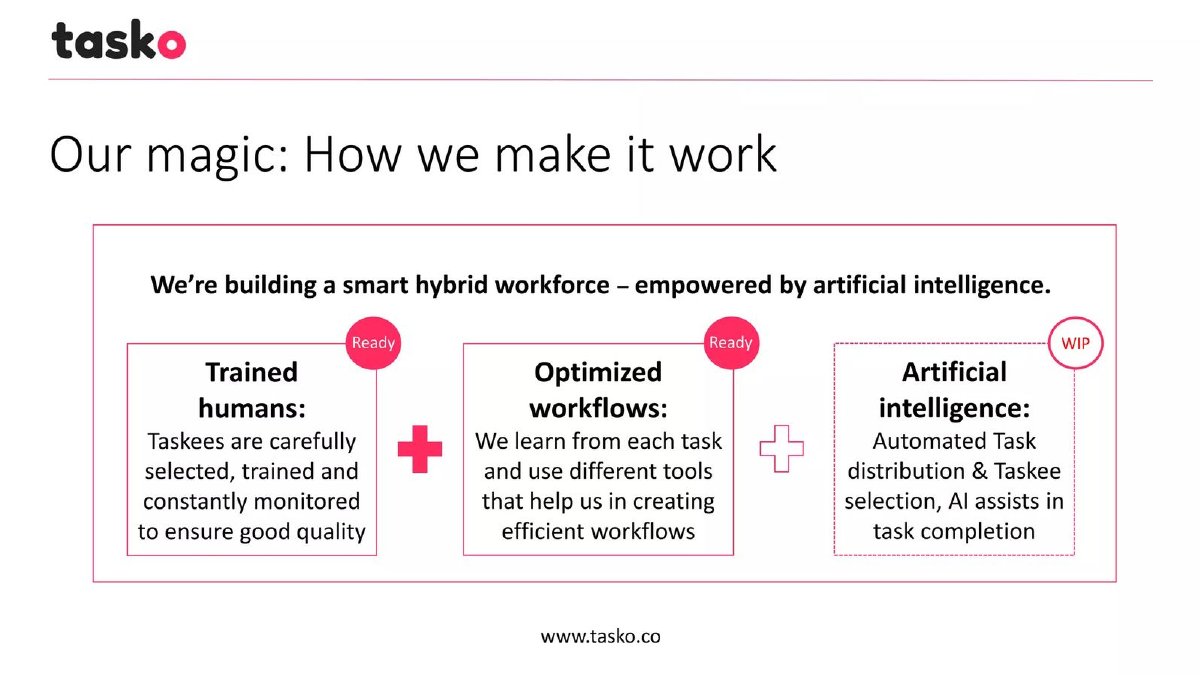
Managed outsourcing of digital tasks, 2016 to 2017. Page 4 says Tasko leverages "emerging market talent"; page 5 shows Tasko selecting the freelancer and checking every task before delivery.
Tasko deck, slide 6. Exact stored slide matched to this analysis.Tasko deck, slide 7. Exact stored slide matched to this analysis.
Our analysis: The corner is explained by named levers, but one lever is unfinished and the price axis has no numbers.
Evidence and limitation: The title states the claim and page 4 names one cost lever, emerging-market freelancers. Page 5 defines "full service" by what Tasko does. Page 7 shows that the automation behind the model is work in progress. No slide gives Tasko's price or a rival's, so how far below Ask Sunday or Get Friday Tasko sits cannot be checked. The deck's cover reads "powered by AI".
What a founder can adapt: Add a price per task for Tasko and two rivals, and say which price holds today with the ready parts alone.
Supporting analysis
What the deck claims: Page 6, "Competitive analysis: Low price & full-service!", axes "Open platform" to "Full service approach" and "Low price" to "High price". Upwork, Fiverr, Freelancer and Amazon Mechanical Turk sit on the open-platform side; Toptal, 99designs and DesignCrowd higher on price; Fancy Hands above the line on the full-service side; Habiliss, Ask Sunday, Get Friday and Tasko below it, with Tasko furthest toward low price and full service. Page 7, "Our magic", lists trained humans and optimized workflows marked "Ready" and artificial intelligence ("automated task distribution & Taskee selection, AI assists in task completion") marked "WIP".
Presentation choice: It shows the value of naming what lets you reach the corner, and the risk when part of it is not built yet.
When it does not fit: A placement that depends on automation still marked work in progress, without saying so on the map.
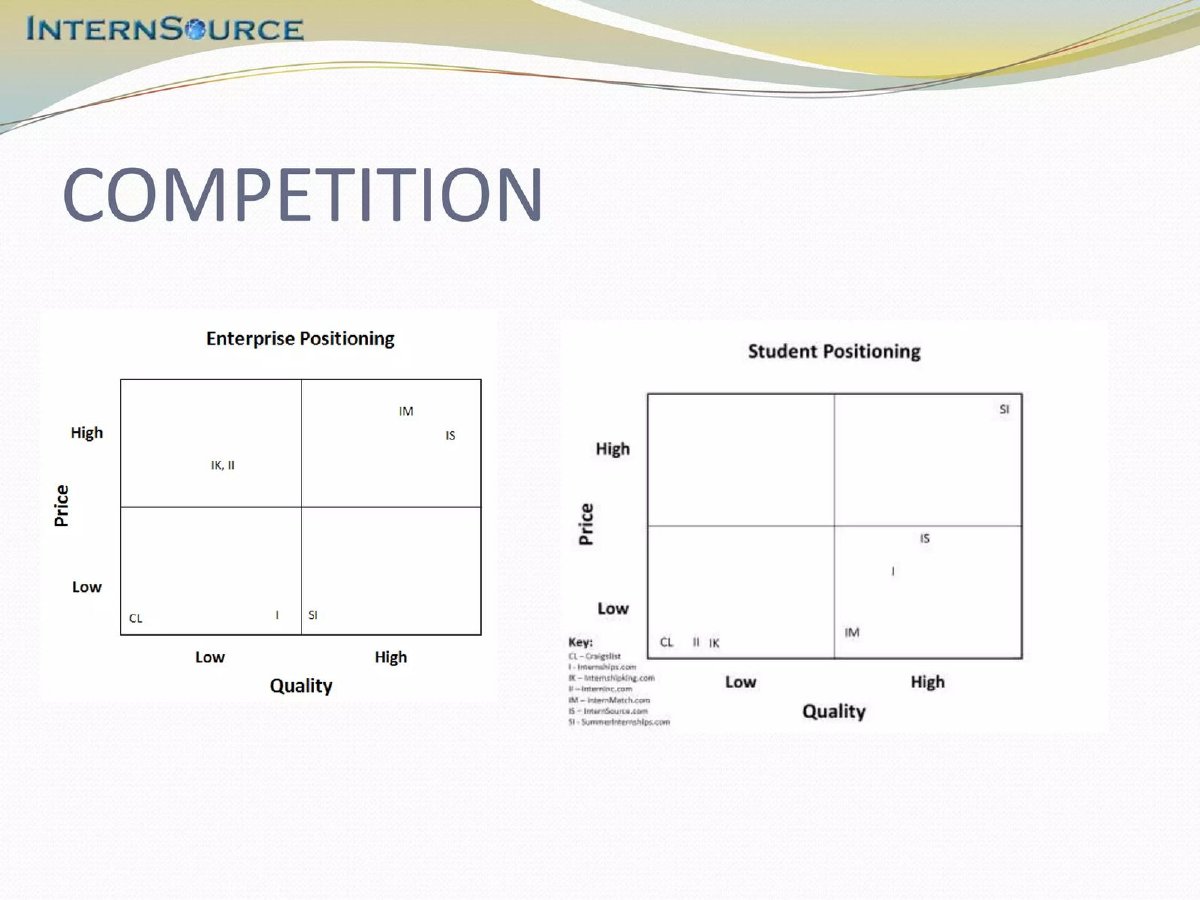
Internship marketplace for students and companies. The map is in the "Additional slides" section that starts on page 22; the main deck's competition pages (7 and 8) are feature tables comparing seven sites.
InternSource deck, slide 24. Exact stored slide matched to this analysis.
Our analysis: The most candid placement of the four, but undefined axes, coded labels and an appendix position weaken it.
Evidence and limitation: The same axes give different answers per side. On the student chart SummerInternships, not InternSource, is in the top corner; InternSource places itself at lower price and somewhat lower quality. On the enterprise chart InternSource shares its corner with InternMatch. Neither chart defines quality or gives prices.
What a founder can adapt: Bring the two maps into the main deck, write company names instead of codes, and define quality as something measured, such as offer rate or ratings.
Supporting analysis
What the deck claims: "Competition" with two charts, both price against quality. "Enterprise Positioning": InternMatch (IM) and InternSource (IS) high price, high quality; InternshipKing and Interninc (IK, II) high price, low quality; Craigslist (CL) and Internships.com (I) low price, low quality; SummerInternships (SI) on the low-price boundary. "Student Positioning": SummerInternships high price, high quality; InternSource and Internships.com low price, higher quality; InternMatch low price near the middle; Craigslist, Interninc and InternshipKing low price, low quality. A key decodes the letters.
Presentation choice: Showing one map per side lets a reader see where a marketplace leads and where it doesn't.
When it does not fit: Letter codes the reader must look up, and a key in small print.
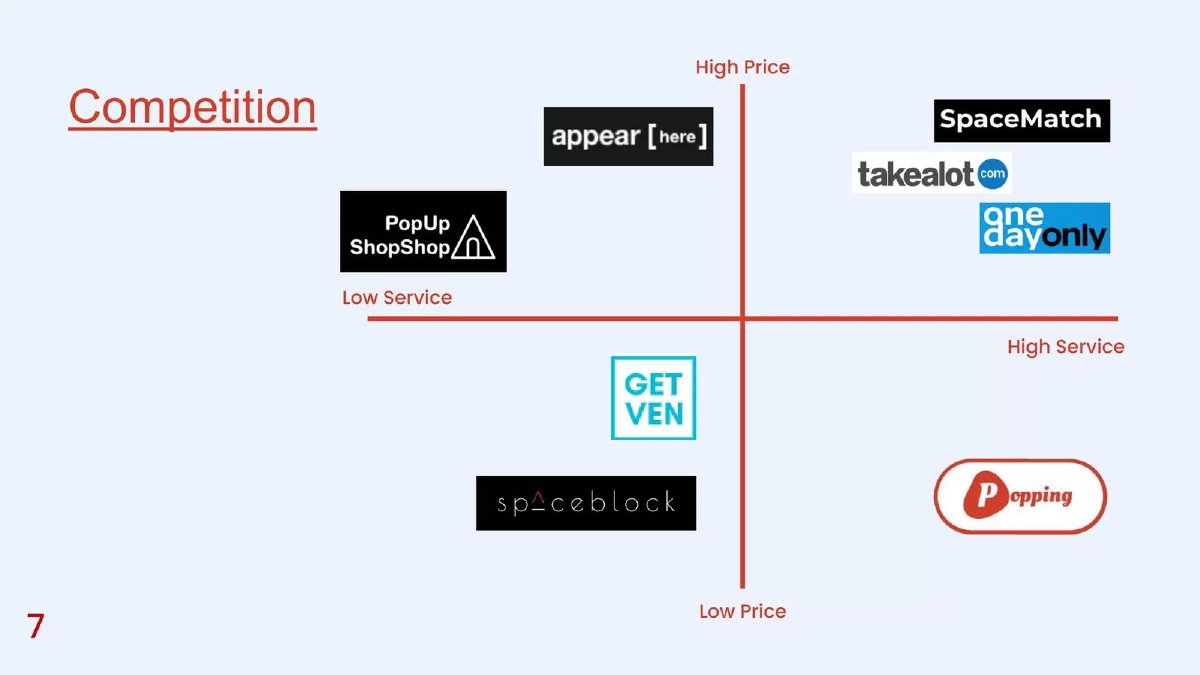
South African platform for pop-up markets and vendor stall bookings, raising $120,000 pre-seed (page 13). Page 5 cites SpaceMatch's 126 temporary property listings in shopping centres as market validation; page 8 gives Popping's take rates: 10% of vendor bookings, 20% of ticket sales and 10% of virtual market sales.
Popping deck, slide 7. Exact stored slide matched to this analysis.
Our analysis: A corner claim with no measure on either axis and no stated reason the corner is reachable.
Evidence and limitation: Popping claims the same corner as Tasko but no slide gives its price or a rival's; the page 8 percentages are Popping's take, not what a vendor pays compared with Appear Here or SpaceMatch. Service is not defined. The rivals are mixed: SpaceMatch and Appear Here rent space, while Takealot and OneDayOnly are online retailers, so the reader cannot tell what common service they are compared on.
What a founder can adapt: Add what a vendor pays per stall day on Popping and on two rivals, define service in one line, and keep only rivals that sell the same thing.
Supporting analysis
What the deck claims: "Competition" map with axes Low Service to High Service and Low Price to High Price. High price: Appear Here, PopUp ShopShop (low service), SpaceMatch, Takealot and OneDayOnly (high service). Low price, low service: GetVen and Spaceblock. Popping alone at low price, high service.
Presentation choice: It shows how a map without measures leaves an investor nothing to test.
When it does not fit: Mixing space-rental firms and online retailers on one map without saying what they share.
Our reading of the four slides. "Partly" means present but incomplete or on another page.
Slide
Axes measured
Reason for the corner
Evidence near the map
Competitors comparable
SkillSesh p7
Partly (price yes, barrier no)
Partly (own 10% vs unsourced 40%)
Partly (pages 2 and 6)
Yes
Tasko p6
No
Partly (talent; AI marked WIP)
Partly (pages 4, 5, 7)
Yes
InternSource p24
No
Not claimed on student side
No (appendix)
Yes
Popping p7
No
No
No
Partly (mixed categories)
Key Takeaways
Your own placement is the claim investors test; rivals' placements come second.
Give each axis a measure: a price, a percentage, a time, a count.
Low price with high service needs a named mechanism that already works.
For a marketplace, one map per side shows where you win and where you don't.
Label quadrants or axes so a reader knows which end is better for the customer.
Keep the evidence on the same slide or one page away.
Evidence your own placement
Fill in one line per axis and one for the corner. A blank line is a question an investor will ask.
Axis 1 measure. What figure puts you on this side, and what are two rivals' figures?
Axis 2 measure. Same for the second axis, or a one-line definition if it can't be measured.
Why you can sit there. Cost structure, segment choice, or outcome you already measure.
Built or planned. Which parts of that reason work today, and which are still being built?
Other side. For a marketplace: where do you sit for the other group?
Rivals. Do all the rivals sell something a customer would choose instead of you?
Copyable framework: We sit at [end of axis 1] because [figure vs rivals] and at [end of axis 2] because [figure or definition]; we can because [mechanism], which [works today / is in progress].
After: Low price: $[x] per task vs $[y] at [rival]. Full service: we pick the freelancer and check every task. Possible because of emerging-market freelancers (working today) and automated assignment (in progress).
What improved: Uses Tasko's claim and levers; bracketed values are placeholders, not company figures.
Illustrative example 2 — written by us
Before: Affordable / Low barrier (grid only)
After: Affordable: our 10% commission vs [named rival]'s [x]% ([source, date]). Low barrier: [n] minutes from sign-up to first booking.
What improved: Uses SkillSesh's own figures from pages 2 and 6; the bracketed values are placeholders.
What this guide covers and what it doesn't
Our main competition slide guide explains when a two-by-two is worth using and warns that axes must be real customer trade-offs. This guide starts where that one stops: you have chosen fair axes and placed yourself in a corner. How do you show that the placement is earned? The marketplace competition guide uses two maps to make a point about commissions; it does not cover placement evidence in general.
Feature tables, status-quo competitors and incumbent response have their own guides and are not repeated here.
Why the corner you choose is the real claim
A positioning map makes two kinds of statement. One is about rivals: where Upwork or WyzAnt sit. Those can be checked against public prices and reviews, and an investor who knows the market will notice a wrong placement. The other is about you, and it is usually the harder claim, because the best corner is normally empty for a reason. Cheap and full-service is hard to deliver at the same time; easy and powerful is hard to build.
So the question an investor asks of your dot is: what do you have that lets you sit there? Acceptable answers are a cost structure (lower commission, cheaper labour, automation), a structural choice (serving a segment rivals ignore), or measured outcomes (prices, retention, satisfaction) that show you are there already. A slogan in the slide title is not an answer.
Give every axis a measure
Words such as "service", "quality" and "barrier" have no units. A reader can't tell how far apart two dots are or whether the gap matters. Where you can, attach a measure to each end: commission percentage, price per task, days to first result, number of steps to sign up. Then the position of your dot can be checked against a figure somewhere in the deck.
When an axis cannot be measured, define it in a short line under the chart: "Service = we manage the freelancer and check every task before delivery." A definition still lets the reader judge whether your rivals are placed fairly.
The cheaper-and-better corner
Two of the four maps claim low price and high service. That is the corner where an investor will look hardest, because it implies either lower costs than everyone else or thinner margins. Say which. If your costs are lower, name the reason (for example, working with freelancers in lower-cost markets) and show it working today. If part of the reason is still being built, say so, and say what price you charge until it is.
If margins are thinner, show the price and the take rate, so the reader can see what you keep per transaction.
Marketplaces: one map per side
A marketplace serves two groups who want different things, and a single map hides that. InternSource draws one map for companies and one for students, with the same axes. The result is more believable precisely because the startup does not win the top corner on both. If your advantage is on one side, show it, and say on the slide what you do about the other side.
Worked example: from a dot to an evidenced placement
Hypothetical example, invented for illustration. A bookkeeping service puts itself at low price and high accuracy against two software tools and two accounting firms. The weak version is the map alone.
The evidenced version adds three short lines under it: "Price: $149 a month, against $400 to $900 at the two firms (their public price pages, September)." "Accuracy: 0.4% of transactions corrected by clients in the last quarter, our data." "How: software does categorisation; one accountant reviews about 120 clients." Each line ties an axis or the corner to a figure a reader can question, and the third line explains why the corner is reachable.
When a map is the wrong format
A two-by-two works when two qualities explain most of a customer's choice. When the choice depends on several features, a table is easier to check, which is why InternSource's main deck uses feature tables on pages 7 and 8 and keeps its maps for the appendix. When the real alternative is a spreadsheet or doing nothing, a map with named companies can hide your largest competitor; our status-quo guide covers that case.
A useful test: cover your own dot and ask whether a customer would agree with where every rival sits. If they would, the map is doing its job and the remaining work is evidencing your placement. If they would argue about the rivals first, fix the axes or switch to a table before adding anything else. Either way, keep the evidence for your own position within one page of the chart, because an investor reading quickly will not search the deck for it.
Reading the four slides together
SkillSesh's map is the only one whose price side is matched by figures elsewhere in the deck. Tasko's title states its claim and its other slides name two of the levers behind it, but one lever is marked as not ready. Popping takes the same corner with no price on any slide. InternSource is the most candid about where it does not lead, but leaves its chart in the appendix with letter codes the reader must decode.
The common gap is the same in three of the four: the map stands alone, and the reader has to search the deck, or guess, for why the startup sits where it does.
Common mistakes
A dot with no reason. Placing yourself in the empty corner without saying what lets you get there.
Unmeasured axes. "Service" or "quality" with no figure or definition can't be checked.
Planned capability shown as current. If the corner depends on something unbuilt, say so on the slide.
One map for two customer groups. Marketplaces often win one side and not the other; show both.
Mixed rival categories. Put only alternatives a customer would actually choose instead of you.
Diagnostic checklist
Each axis has a measure or a one-line definition.
Your own placement is backed by a figure on the slide or the next page.
The reason you can reach your corner is stated.
Anything still being built is labelled as planned.
Every rival on the map sells a real alternative.
Marketplaces show where they sit for each side.
Frequently asked questions
Is it wrong to put ourselves alone in the top-right corner?
No, if the deck shows why you can sit there. Investors discount the corner itself; they credit the evidence for it.
What if our axes can't be measured?
Define each one in a sentence under the chart, so a reader can judge whether rivals are placed fairly. Prefer an axis you can measure if one exists.
Should a positioning map go in the main deck or the appendix?
If it carries your main competitive argument, the main deck. InternSource's two maps are its clearest competitive statement but sit in the appendix behind two feature tables.
How many competitors should be on the map?
Enough to show the real alternatives a customer considers. Leave out companies that sell something different, even if they are well known.
Can we claim lower price and higher quality at the same time?
Yes, with the mechanism and the figures. Name the cost advantage, say whether it works today, and show your price against named rivals.
How we chose these examples
Discovery (2026-10-04): corpus index search for two-by-two competitor maps returned 27 pages. Seven were rendered from the stored deck files and read from the images; three were excluded under our whole-deck rule because the decks carry confidentiality notices, and one because it appears to be a design template. Each remaining deck was checked page by page for such notices.
Closest guides read: the main competition slide guide (fair-axes warning, one example) and the marketplace competition guide (commission comparison). Neither covers evidencing the startup's own placement.
Placements are described as they appear on the slides; company figures are not verified. The worked example is invented and labelled. Drafted with AI assistance and checked by editorial model review, not human-reviewed.