How to Show Seasonal Revenue in a Pitch Deck: Real Slides
If your sales rise and fall with the calendar, a month-by-month chart can look like decline.
How to Show Seasonal Revenue in a Pitch Deck
Many startups do not sell evenly across the year. Insurance renews on fixed dates, schools buy before term starts, shoppers spend in December and companies spend leftover budget at year end. If you raise money with a business like that, your monthly chart has dips that a reader can mistake for stalling or decline, and peaks that a reader can mistake for a new trend. This guide answers a practical question: how do you show seasonal sales on a traction slide so an investor can tell the calendar apart from real growth? It uses four slides from three startup decks: Alan, a French health insurer; Get Groomed, a London mobile barber service; and TopDelivery, a Russian delivery company.
TL;DR
Show at least one full year so the pattern is visible, compare each period with the same period a year earlier rather than with the month before, say in one line on the slide why the pattern exists, and show what you do about it: when you spend, what you sell in the quiet months and how you fund the gap. TopDelivery's two years of monthly bars let a reader compare December with December and January with January. Alan explains its calendar (most contracts are signed in September and October to start on 1 January) and times its marketing to it. Get Groomed shows how the mix between its two customer types changes between low and high season. None of the three slides puts a number on the size of the swing, and that is the step most worth adding.
Four slides that deal with seasonal sales
Each slide was read at full size from the source deck. Quotes are exact.
Alan traction slide — slide 22
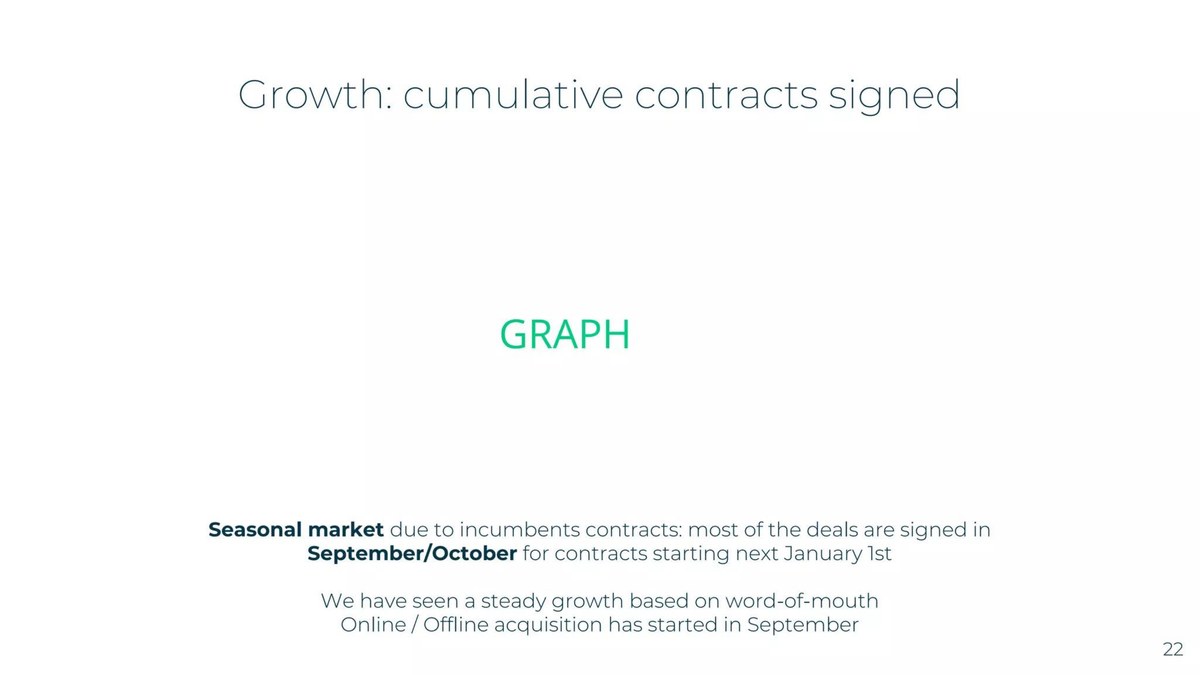
French health insurer for companies, 2017 deck. Growth page; the chart area shows the placeholder 'GRAPH'.
Alan deck, slide 22. Exact stored slide matched to this analysis.
Our analysis: A good one-line explanation of the season paired with the chart type least able to show it.
Evidence and limitation: A clear cause and timing for the seasonal pattern. The chart planned is cumulative, which would hide the pattern; the size of the September and October share is not given.
What a founder can adapt: Chart monthly or quarterly signings and add the share of yearly contracts signed in the peak window.
Supporting analysis
What the deck claims: "Growth: cumulative contracts signed." "Seasonal market due to incumbents contracts: most of the deals are signed in September/October for contracts starting next January 1st." "We have seen a steady growth based on word-of-mouth. Online / Offline acquisition has started in September."
Presentation choice: Shows how to state the cause of a seasonal pattern in one sentence.
When it does not fit: Using a cumulative line to illustrate a seasonal point.
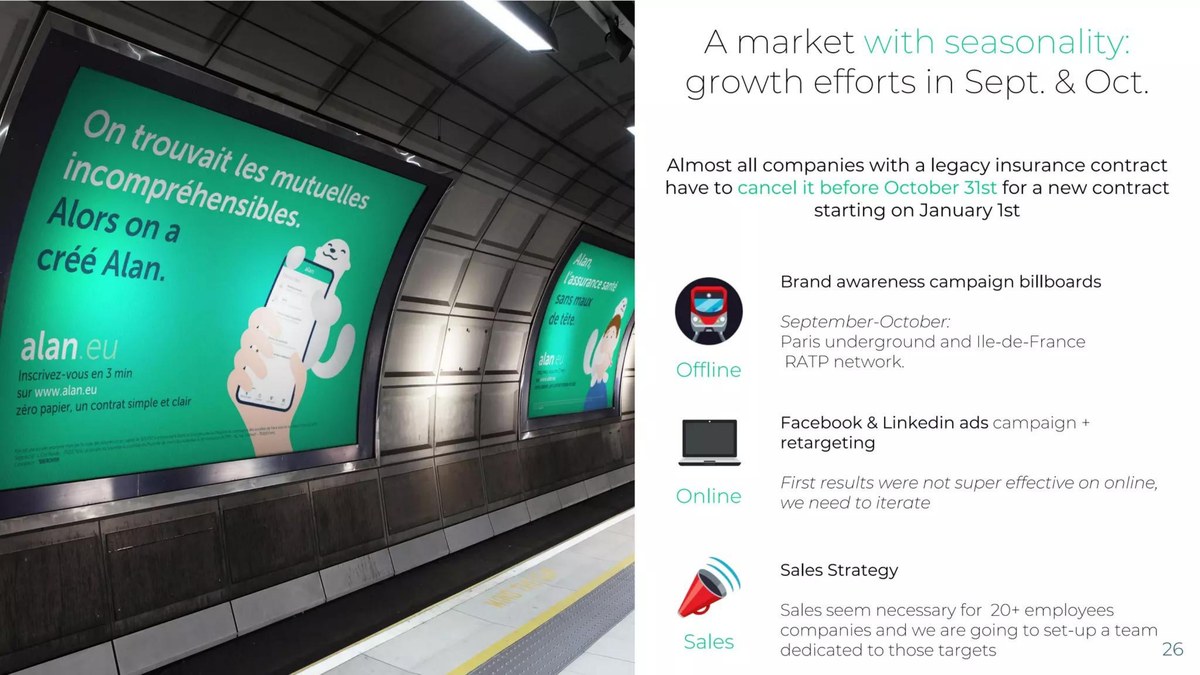
Same deck. Acquisition page, with a photo of its billboard campaign.
Alan deck, slide 26. Exact stored slide matched to this analysis.
Our analysis: The clearest example of a company showing what it does about its season.
Evidence and limitation: The seasonal cause is tied directly to when marketing money is spent. A later page (30) notes a higher monthly burn in September 'due to marketing', with figures redacted.
What a founder can adapt: Add the cost of the peak campaign and the share of the year's sales it produced.
Supporting analysis
What the deck claims: "A market with seasonality: growth efforts in Sept. & Oct." "Almost all companies with a legacy insurance contract have to cancel it before October 31st for a new contract starting on January 1st." Billboards "September-October: Paris underground and Ile-de-France RATP network." Online ads: "First results were not super effective on online, we need to iterate."
Presentation choice: Shows how to connect a seasonal pattern to spending decisions.
When it does not fit: Describing the season without saying what the company does about it.
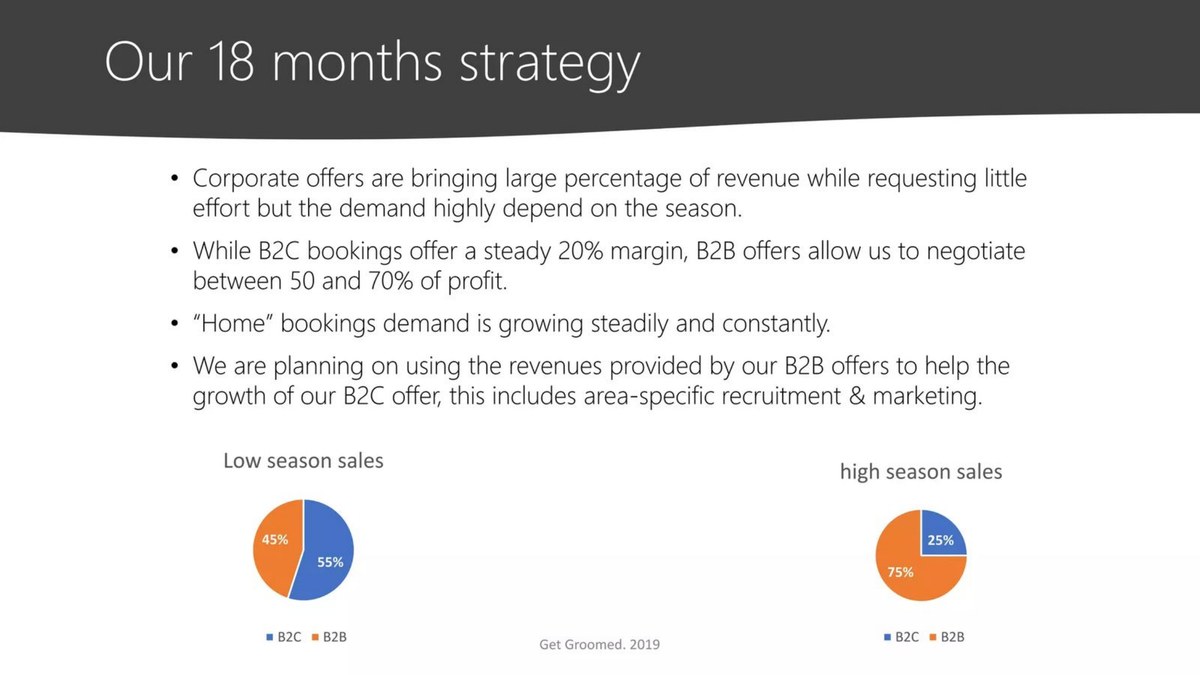
London mobile barber service, 2019. Strategy page with two pie charts.
Get Groomed deck, slide 18. Exact stored slide matched to this analysis.
Our analysis: A useful way to show which part of a business is seasonal, missing the amounts that would make it measurable.
Evidence and limitation: Seasonality is placed in one customer group, and a plan follows from it. Only shares are shown, so the size of each season and the reason for the shift are unknown.
What a founder can adapt: Show sales amounts by customer group for each season, and name the months in each season.
Supporting analysis
What the deck claims: "Low season sales": B2C 55%, B2B 45%. "high season sales": B2C 25%, B2B 75%. Corporate demand "highly depend on the season". "While B2C bookings offer a steady 20% margin, B2B offers allow us to negotiate between 50 and 70% of profit." "'Home' bookings demand is growing steadily and constantly."
Presentation choice: Shows how to separate a seasonal revenue line from a steady one.
When it does not fit: Showing only percentages when the totals change between the two charts.
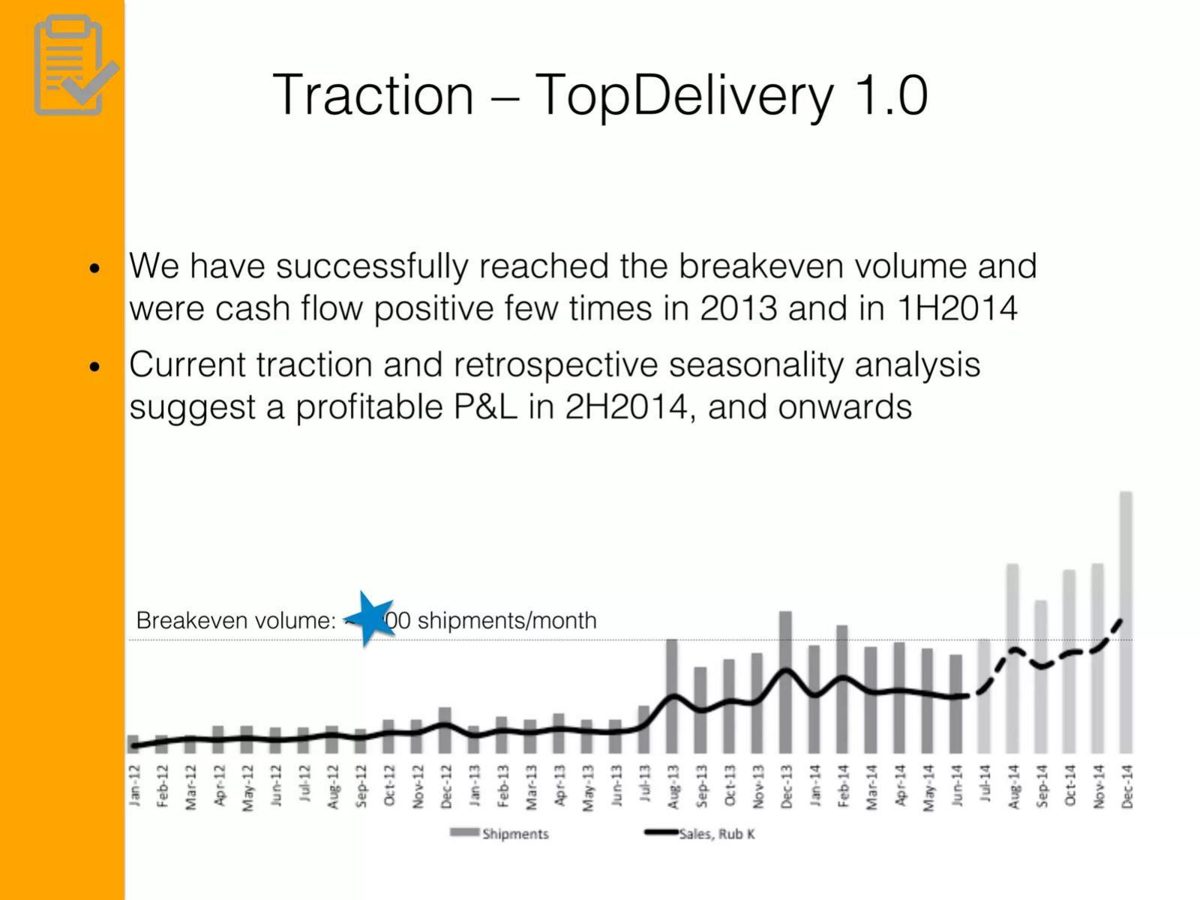
Russian delivery company, 2014. Monthly traction chart, January 2012 to December 2014, forecast from July 2014.
TopDelivery deck, slide 13. Exact stored slide matched to this analysis.
Our analysis: The right raw material for a seasonal reading, with the year-over-year comparison left to the reader.
Evidence and limitation: More than two years of monthly data allow same-month comparisons; in our reading December peaks and January dips repeat. The forecast appears to follow the 2013 shape. No axis values.
What a founder can adapt: Add values and a year-over-year figure for the latest matching months; say what the forecast assumes beyond the seasonal pattern.
Supporting analysis
What the deck claims: Bars: "Shipments"; line: "Sales, Rub K". "Breakeven volume: [first digits covered] shipments/month." "Current traction and retrospective seasonality analysis suggest a profitable P&L in 2H2014, and onwards."
Presentation choice: Shows why two full cycles of monthly data make seasonality visible.
When it does not fit: Leaving readers to work out from bar heights how much of a rise is seasonal.
Show twelve months or more so a reader can see the full cycle, not one peak or one trough.
Compare each month or quarter with the same period last year, not with the period just before.
Explain the cause of the pattern in one plain sentence on the slide.
Put a number on the swing: the share of yearly sales that falls in the peak months.
Show what the business does about it: timing of spend, off-season revenue, cash cover for quiet months.
If a forecast repeats last year's pattern, say so and mark the forecast clearly.
Plan your seasonal traction slide
Answer these with your own data before you design the page. They are our recommendations, not steps the example companies took.
Cause. In one sentence, what makes your sales rise and fall: a contract date, a school year, weather, holidays, budgets?
Size. What share of last year's sales fell in your busiest one, two or three months?
Growth. How did your latest month or quarter compare with the same period a year earlier?
Which part. Is the whole business seasonal, or one customer group or product line?
Response. What do you do before, during and after the peak: spend, hiring, stock, off-season products?
Cash. How much cash do you need to get through the quiet months and to build for the next peak, and is it in your ask?
Copyable framework: "[Measure] by month, [start] to [end]. [Cause in one sentence]. [X]% of yearly [measure] falls in [months]. [Latest period] up [Y]% on [same period last year]. In the quiet months we [response]. This round funds [peak-season build / runway through the cycle]."
Illustrative example 1 — written by us
Before: "Growth: cumulative contracts signed" with a note that most deals are signed in September and October.
After: "Contracts signed per month, [year] to [year]. Companies can only switch insurer before 31 October for 1 January, so [X]% of contracts are signed in September and October. October signings up [Y]x on last October."
What improved: Our illustrative rewrite of Alan's page 22. Bracketed figures are not stated in the deck.
The question this guide answers
This guide answers one founder question: my sales rise and fall with the season, so how do I present them in a pitch deck without the dips looking like failure or the peaks looking like a breakthrough?
Our library already has guides on growth rates, run rate and month-over-month growth. They tell you how to calculate and label growth. They do not deal with what happens when the calendar itself moves the numbers. Our run-rate guide warns that multiplying a strong month by twelve misleads for seasonal businesses, but stops there. Our travel traction draft notes that travel is seasonal and booked ahead. This guide makes seasonality the subject: how to show the pattern, how to separate it from growth, and how to connect it to spending and the funding request.
Demand note: our own search data for the last three months contains no query about seasonality on a pitch deck, so this page is based on an editorial judgement, not on observed search demand for our site. Current search results for the question return finance and forecasting articles about seasonal businesses, and a general StartupFundraising.com article on fundraising for seasonal businesses, but none that shows real startup slides. We have not estimated search volume.
How we chose and read the examples
We searched the extracted text of the deck library for 'seasonal', 'seasonality', 'peak season', 'high season' and 'low season'. Most matches were in listed-company presentations, where seasonality appears in legal warnings or quarterly results, or in passing product copy (seasonal menus, seasonal items). We excluded listed companies, and kept startup slides where seasonality is part of the traction or growth story.
Three decks qualified. Alan's 2017 deck mentions seasonality on two pages and has a related note on a third. Get Groomed's 2019 deck shows its sales mix in low and high season. TopDelivery's traction page, from 2014, charts two and a half years of monthly shipments and refers to a 'retrospective seasonality analysis'. A fourth candidate, Exotec, mentions renting extra robots to customers for peak season, but only as one line on a customer-service page, so we left it out.
We rendered each page from the source deck. Alan's pages and Get Groomed's page were read at 220 dpi. TopDelivery's page was read from the stored library image at 1200 by 900 pixels; that page is also used in our break-even guide for a different lesson (break-even volume against real volume). We checked our removal-request records before using any deck; none concerns these companies. We did not check any figure against company accounts, and we do not know what any of these companies raised as a result of these decks.
Why seasonal numbers mislead, and what an investor needs
An investor looking at a monthly chart asks two questions: is this business growing, and how fast? Seasonality gets in the way of both. A business that does 40% of its sales in the fourth quarter can show a falling line from January to March every year while growing strongly from one year to the next. The same business can show a jump from September to December that has nothing to do with a new product or a new channel.
Comparing a month with the month before mixes the two effects. Comparing a month with the same month a year earlier removes most of the calendar effect, because both months sit at the same point in the cycle. That is why the most useful single change a seasonal founder can make is to add year-over-year comparisons for matching periods.
An investor also wants to know whether you understand the pattern. That means three things the slide can show: what causes it, how large it is, and what the company does about it. The cause can be a contract date, a school year, the weather or a holiday. The size can be one figure: the share of yearly sales that falls in the busiest months. What you do about it covers when you spend on marketing, whether you have products or customers that buy in quiet months, and how much cash you need to get through them. The last point connects straight to your funding request.
A calendar that drives sales, and spending timed to it: Alan
Alan sells health insurance to French companies. Page 22 of its 2017 deck is headed 'Growth: cumulative contracts signed'. Where the chart should be, the page says 'GRAPH', so the copy in our library has a placeholder. Below it: 'Seasonal market due to incumbents contracts: most of the deals are signed in September/October for contracts starting next January 1st.' Then: 'We have seen a steady growth based on word-of-mouth. Online / Offline acquisition has started in September.'
Page 26 is headed 'A market with seasonality: growth efforts in Sept. & Oct.' It explains the cause in one sentence: 'Almost all companies with a legacy insurance contract have to cancel it before October 31st for a new contract starting on January 1st.' It then lists what Alan does about it: a brand campaign on billboards in the Paris underground in September and October, Facebook and LinkedIn ads ('First results were not super effective on online, we need to iterate'), and a plan to set up a sales team for companies with more than 20 employees.
This is the strongest explanation of cause in the set. A reader learns exactly why sales bunch up, and when. The second page also links the pattern to a decision: the company spends its acquisition money in the two months when buyers can switch. Page 30 adds a related note, with every figure redacted: a monthly burn rate of '€Xk in September due to marketing (€Xk before)'. So the deck connects the season to cash as well: spending rises in the switching window. We do not guess the redacted numbers.
What is missing is the size of the effect and the chart that would show it. The headline chart is cumulative contracts signed, which only ever rises. A cumulative line hides seasonality almost completely: a quiet month shows as a flat stretch, not a dip. If the point is that most deals arrive in September and October, monthly signings, or signings by quarter, would show it far more clearly. The deck also does not say what share of the year's contracts were signed in the two-month window. Note too that 'steady growth based on word-of-mouth' sits beside 'acquisition has started in September', so a reader can't tell how much of the September and October rise came from the season, from the new campaign or from both. That is not a contradiction; it is a question the slide leaves open.
A mix that changes with the season: Get Groomed
Get Groomed sends barbers to homes and offices in London. Its page 18, headed 'Our 18 months strategy' and dated 2019, shows two pie charts. 'Low season sales': 55% B2C (consumers at home) and 45% B2B (corporate offers). 'High season sales': 25% B2C and 75% B2B. The text says corporate offers bring 'large percentage of revenue while requesting little effort but the demand highly depend on the season'; that B2C bookings offer 'a steady 20% margin' while B2B offers 'allow us to negotiate between 50 and 70% of profit'; that home bookings demand 'is growing steadily and constantly'; and that the company plans to use B2B revenue to fund growth of the B2C offer.
The useful idea here is that seasonality can sit in one part of a business, not all of it. Get Groomed separates a steady consumer line from a seasonal corporate line and says which is which. It then turns that into a plan: use the profitable seasonal revenue to pay for the steady line. For a founder with two customer types, this is a clear way to show where the swings come from.
The limits matter. The pies show shares, not amounts. A shift from 45% to 75% B2B could come from corporate sales rising in high season, consumer sales falling, or both; the slide can't tell us which. Using our own arithmetic and an invented example: if consumer sales stayed at 100 units a month in both seasons, they would be 55% of low-season sales and 25% of high-season sales only if total sales rose from about 182 to 400, more than doubling. The slide does not say whether anything like that is true. It also doesn't say which months are high season, why corporate demand is seasonal, or what 'margin' and 'profit' mean here; 20% margin and 50 to 70% profit may not be measured the same way, so we don't compare them directly.
Two years of monthly bars and a forecast built on the pattern: TopDelivery
TopDelivery's page 13, headed 'Traction – TopDelivery 1.0', charts monthly shipments as bars and sales in thousands of roubles as a line, from January 2012 to December 2014. Bars from July 2014 onward are lighter and the line is dashed, marking a forecast. A dotted line marks 'Breakeven volume', with the first digits of the figure covered by a star graphic in the copy we reviewed; we do not guess them. The text says the company reached break-even volume and was cash-flow positive 'few times in 2013 and in 1H2014', and that 'current traction and retrospective seasonality analysis suggest a profitable P&L in 2H2014, and onwards'.
Because the chart covers more than two full years, a reader can make same-month comparisons. In our reading of the chart, December rises above November in both 2012 and 2013, and January falls back in both 2013 and 2014. That repeat is what a seasonal pattern looks like. The forecast for the second half of 2014 also appears to follow the 2013 shape: a rise from July to August, a dip in September and a December high. That fits the text's statement that the forecast uses a seasonality analysis.
Not every jump is seasonal. The step up in August 2013 is much larger than anything in August 2012, so the earlier year does not explain it; something else changed, and the slide doesn't say what. Without values on the axis we can't measure the size of the December peaks or the January dips, and we can't say how much of the forecast's rise is the seasonal pattern and how much is assumed growth. The page gives the reader the right raw material, two years of matching months, but leaves the comparison for the reader to make.
How to build a seasonal traction slide
Start with the chart. Use monthly or quarterly figures, not cumulative ones, so the pattern is visible. Show at least twelve months, and ideally two full cycles so a reader can see that the pattern repeats. If you have two years, consider overlaying them: one line per year on a January-to-December axis. That makes the year-over-year gap the most visible thing on the page.
Lead with a year-over-year figure. Instead of 'Sales up 40% since August', write 'December sales up 2.1x on last December' or 'Q4 bookings up 85% on Q4 last year'. If your business is young and you don't have a prior-year month to compare against, say so and use the longest comparison you have, or trailing twelve-month totals once you have them.
Explain the cause in one line and size the swing in one number. For example: 'Most customers switch insurer in September and October for 1 January; 60% of yearly contracts are signed in those two months.' That second figure is invented for illustration. Use your own data. The point is that a reader should see both the reason and the scale.
Show the response. What do you do in the peak, and what do you do in the trough? Alan's answer is to concentrate acquisition spending in the switching window. Get Groomed's answer is to use a second, steadier customer line. Other answers include selling annual plans billed upfront, adding an off-season product, or using quiet months for product work and hiring.
Connect it to cash and the ask. A seasonal business usually needs more cash before its peak than after it: stock, marketing or staff come first, sales later. If your funding request covers a peak-season build, say so. If your runway calculation assumes peak-month sales, it is wrong for most of the year; base it on the full cycle.
What these examples can and cannot show
The three decks show three useful moves: explaining the cause and timing spend to it (Alan), separating a seasonal customer group from a steady one (Get Groomed), and showing enough months for same-period comparisons (TopDelivery). None shows a year-over-year growth figure or puts a number on the size of the seasonal swing, so the worksheet below supplies those steps as our recommendation, not as something these companies did.
We can't tell from the slides how investors read them, and we don't infer that any of these pages helped or hurt a fundraise. Alan's main chart is a placeholder in our copy and its financial figures are redacted, so our comments on that deck are about structure and explanation, not about results.
Common mistakes
Cumulative charts. A running total hides dips and peaks; use monthly or quarterly figures.
Month-on-month headlines. Comparing December with November mostly measures the calendar.
Peak-month run rate. Multiplying a peak month by twelve overstates yearly sales.
Unexplained dips. A drop with no stated cause reads as decline.
Shares without amounts. Mix percentages can't show whether a line grew or shrank.
Forecasts without assumptions. Say how much of a forecast is the seasonal pattern and how much is growth.
Diagnostic checklist
At least twelve months shown, ideally two cycles.
Monthly or quarterly figures, not cumulative.
Headline growth compares matching periods.
Cause of the pattern stated in one line.
Share of yearly sales in the peak months given.
Response to the season shown.
Cash needs across the cycle tied to the ask.
Forecast clearly marked, with its seasonal assumption stated.
Frequently asked questions
Should I hide seasonality by showing only quarterly or yearly figures?
Yearly figures can be a fair headline if they are what you are judged on, but investors will ask for monthly data in due diligence. It is better to show the pattern and explain it than to have it found later.
What if I don't have a full year of data yet?
Say so on the slide, state the seasonal pattern you expect and why, and use the best outside evidence you have, such as industry calendars or customer contract dates. Mark expectations clearly as expectations.
Is seasonality a problem for investors?
Not by itself. A predictable pattern that the founder understands and plans for is usually easier to accept than unexplained swings. What causes concern is a runway or forecast that ignores it.
Where does seasonality belong: traction, financials or the ask?
Show the pattern on the traction slide, reflect it in the monthly financial plan, and if the round funds a peak-season build or covers quiet months, say so on the ask slide.
How we chose these examples
Corpus: published pitch deck teardowns on StartupFundraising.com. Founder-uploaded private decks are excluded. Listed-company presentations were excluded.
Selection (2026-10-02): we searched extracted slide text for 'seasonal', 'seasonality', 'peak season', 'high season' and 'low season', removed listed companies, legal warnings and passing product mentions, and kept startup slides where seasonality is part of the traction or growth story. Exotec's single line about renting robots for peak season was considered and left out as too brief.
Demand: our search data for the past three months shows no seasonality query for this site; the page rests on an editorial hypothesis that founders of seasonal businesses need this answer. Current search results were checked on 2026-10-02. No search volume is estimated.
Review: Alan pages 22, 26 and 30 and Get Groomed page 18 were rendered from the source decks at 220 dpi; TopDelivery page 13 was read from the stored 1200 by 900 library image. All were checked against company, deck and page number (editorial model review, with AI assistance in drafting; not human-reviewed). Redacted and covered figures were not guessed. No figure was checked against company accounts. Calculations and chart readings are labelled as ours.