Pitch Deck Financials Slides: Projections Examples and What
How to write a pitch deck financials slide: historical results, a three-to-five-year projection built from stated assumptions, burn and runway.
Pitch Deck Financials Slides: Projections Examples and What Works
Compare eleven real financials slides across early-stage, growth, and public-company decks, then build a forecast whose history, assumptions, costs, and runway can be tested.
TL;DR
A financials slide should separate actual results from forecasts, show the few assumptions that drive revenue and costs, and connect burn to runway. These examples show how stage changes the evidence—from early pipeline and spending to reported revenue, margin, and reconciliation notes.
Financials slides from real pitch decks
Each example pairs the exact financials slide from its public deck with specific analysis when the image is available. Figures remain company claims; missing exact images are recorded and never replaced with unrelated slides.
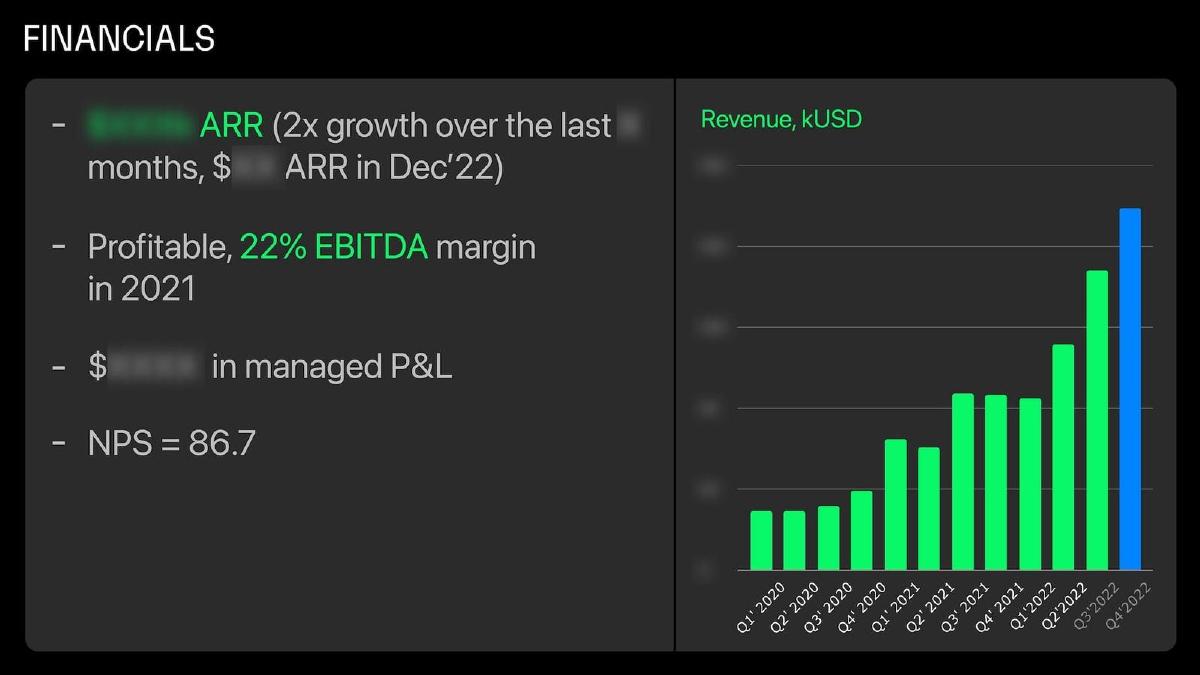
Fuelfinance financials slide — slide 5
A finance-department-as-a-service company for startups.
Fuelfinance deck, slide 5. Exact stored slide matched to this analysis.
Our analysis: Results lead; growth and profitability appear together as facts rather than forecasts.
Evidence and limitation: State how the satisfaction score was measured and on what sample.
What a founder can adapt: If you have results, lead with growth rate, margin and one customer metric.
Supporting analysis
What the deck claims: ARR doubled over a stated period, the company is profitable with a 22% EBITDA margin, and a customer satisfaction score of 86.7 is shown alongside revenue.
Presentation choice: Results lead; growth and profitability appear together as facts rather than forecasts.
When it does not fit: State how the satisfaction score was measured and on what sample.
An early-stage solar-furniture company raising a small private round.
Solgreen deck, slide 6. Exact stored slide matched to this analysis.
Our analysis: Revenue to date, pipeline and goal are stated as three different things.
Evidence and limitation: "Revenue potential" should show the assumptions that link funding to revenue.
What a founder can adapt: Separate booked revenue, pipeline and targets on the slide.
Supporting analysis
What the deck claims: Revenue potential with $250K funding, company revenue to date of $400K, in-process sales for the current quarter of $240K and a sales goal for the year.
Presentation choice: Revenue to date, pipeline and goal are stated as three different things.
When it does not fit: "Revenue potential" should show the assumptions that link funding to revenue.
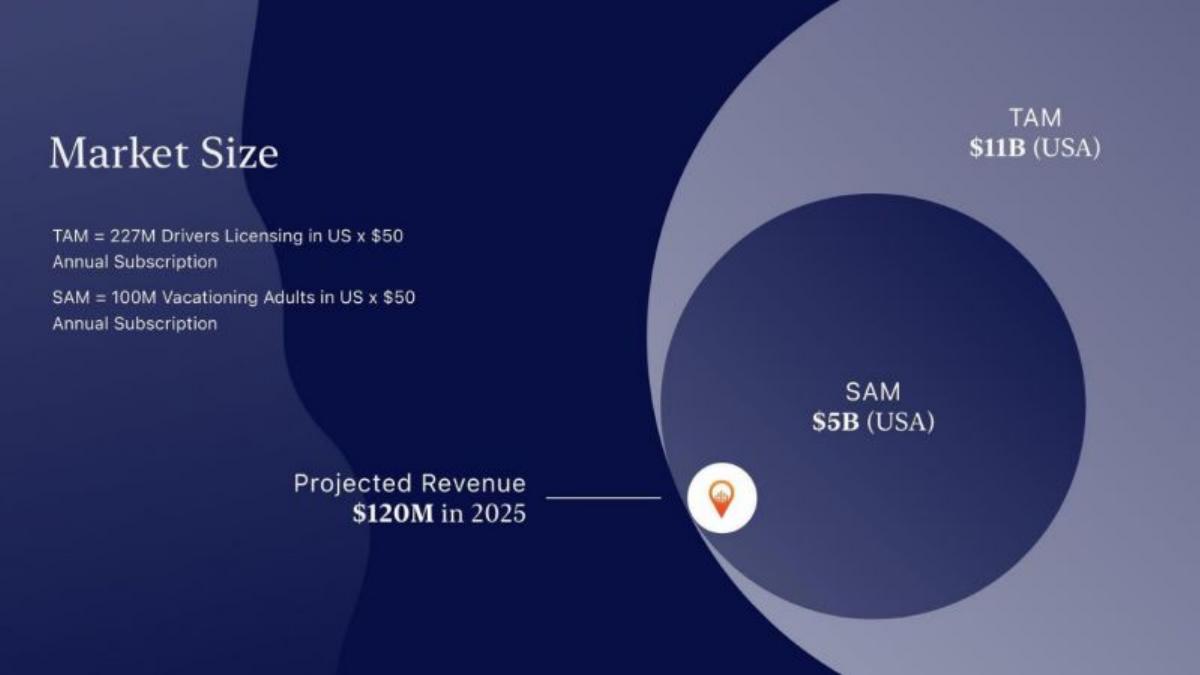
HearHere deck, slide 5. Exact stored slide matched to this analysis.
Our analysis: Included to show the top-down pattern clearly: the arithmetic is visible but the path to revenue is not.
Evidence and limitation: A single projected year without history or costs is hard for an investor to test.
What a founder can adapt: Follow a market figure with the subscriber count your forecast implies and how you will acquire them.
Supporting analysis
What the deck claims: Multiplies licensed drivers and vacationing adults by a $50 annual subscription to size the market and states projected revenue of $120M in 2025.
Presentation choice: Included to show the top-down pattern clearly: the arithmetic is visible but the path to revenue is not.
When it does not fit: A single projected year without history or costs is hard for an investor to test.
An early consumer beverage product sold at outdoor events.
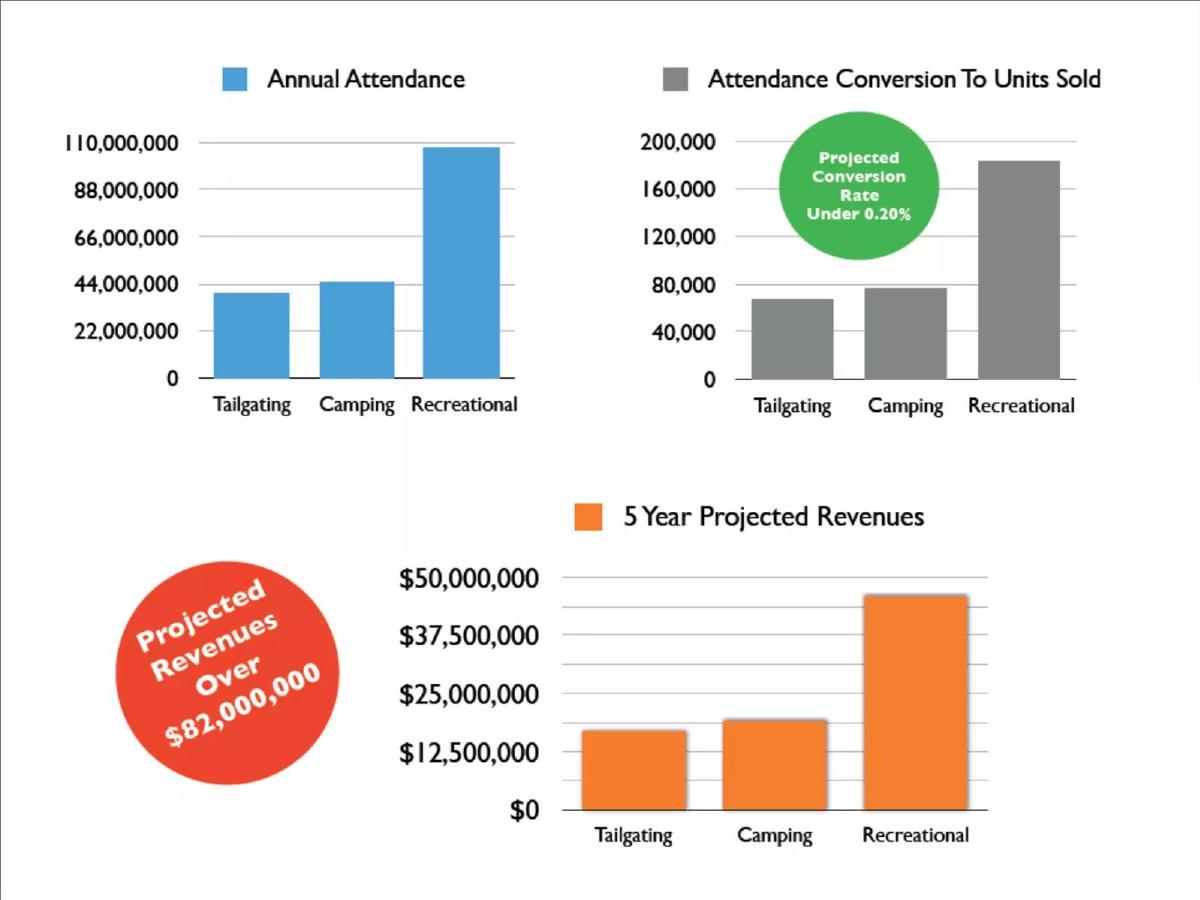
Bev-Rage deck, slide 4. Exact stored slide matched to this analysis.
Our analysis: It states the conversion assumption behind the forecast, which is the right instinct.
Evidence and limitation: Say where the conversion rate comes from — a test, a comparable product or an estimate.
What a founder can adapt: Show the driver and rate behind each projection line.
Supporting analysis
What the deck claims: Annual attendance at tailgating, camping and recreational events, a conversion assumption of under 0.20% to units sold, and a five-year projected revenue chart.
Presentation choice: It states the conversion assumption behind the forecast, which is the right instinct.
When it does not fit: Say where the conversion rate comes from — a test, a comparable product or an estimate.
A public company presenting at an investor conference.
Ladenburg conference deck deck, slide 4. Exact stored slide matched to this analysis.
Our analysis: It shows how mature companies handle non-standard measures: explain and reconcile them.
Evidence and limitation: Seed companies do not need this format; copy the transparency, not the density.
What a founder can adapt: If you use adjusted figures, define them and show how they relate to reported results.
Supporting analysis
What the deck claims: Proven, profitable, double-digit revenue growth, with annual revenue for three years and a note referring to an appendix reconciling GAAP net loss to adjusted EBITDA, with guidance dated.
Presentation choice: It shows how mature companies handle non-standard measures: explain and reconcile them.
When it does not fit: Seed companies do not need this format; copy the transparency, not the density.
Indian defence drone startup (company not named on slide) financials slide — slide 6
A pre-revenue drone developer seeking seed funding; stage and year are not stated on the slide.
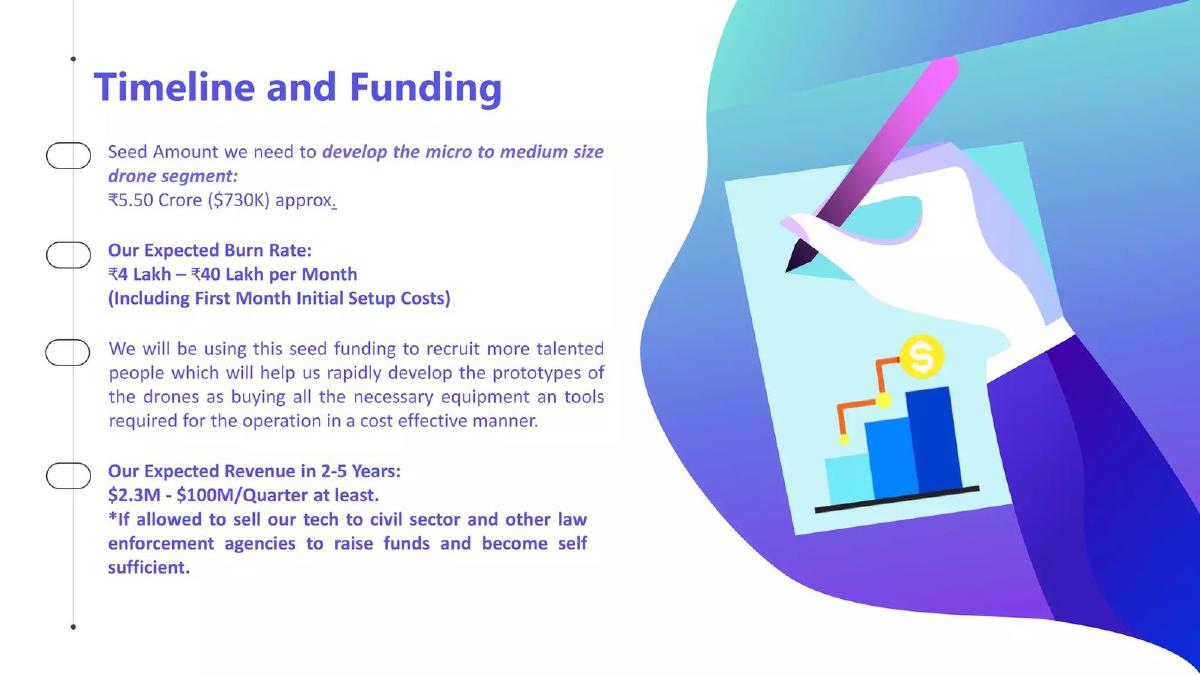
Indian defence drone startup deck, slide 6. Exact stored slide matched to this analysis.
Our analysis: Included as a pattern to improve on. By our arithmetic, ₹5.50 crore lasts roughly 14 months at the top of the burn range and more than ten years at the bottom, so the slide gives no usable runway. The revenue range spans more than 40x and rests on a regulatory condition the slide does not explain.
Evidence and limitation: Do not present a burn range this wide; investors read it as an unfinished plan rather than flexibility.
What a founder can adapt: Replace ranges with one planned monthly burn, the resulting runway in months, and the milestone reached before cash runs out. State regulatory assumptions next to the revenue they unlock.
Supporting analysis
What the deck claims: A 'Timeline and Funding' slide asks for about ₹5.50 crore ($730K) to develop micro to medium drones, gives an expected burn of ₹4 lakh to ₹40 lakh per month (including first-month setup), and projects $2.3M to $100M per quarter in two to five years, conditional on being allowed to sell to civil and law-enforcement buyers.
Presentation choice: Included as a pattern to improve on. By our arithmetic, ₹5.50 crore lasts roughly 14 months at the top of the burn range and more than ten years at the bottom, so the slide gives no usable runway. The revenue range spans more than 40x and rests on a regulatory condition the slide does not explain.
When it does not fit: Do not present a burn range this wide; investors read it as an unfinished plan rather than flexibility.
A freemium educational game for children, with a paid app for parents. The figures are a business plan from September 2020 to September 2022.
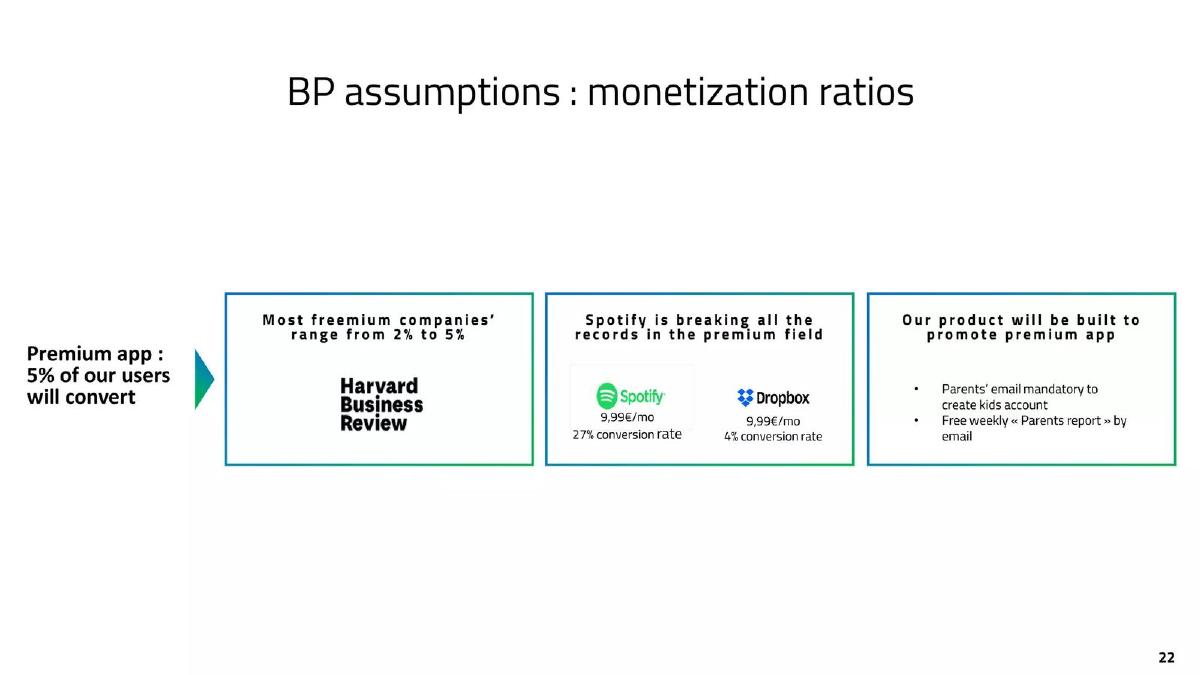
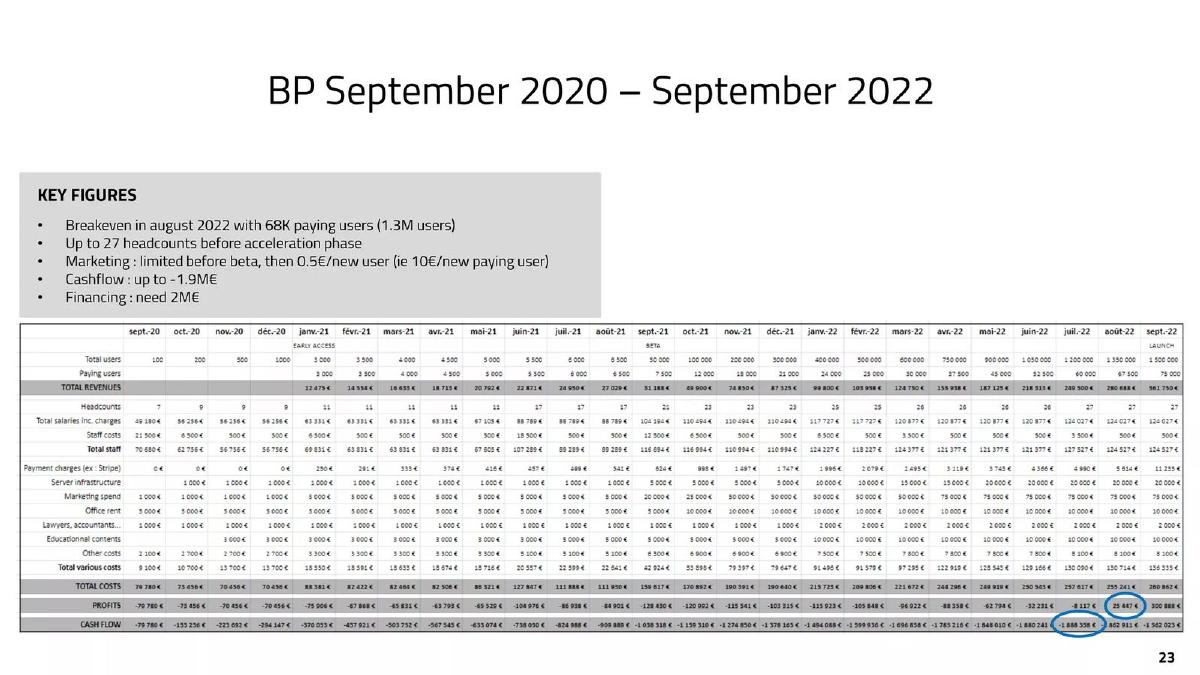
Powerz deck, slide 22. Exact stored slide matched to this analysis.Powerz deck, slide 23. Exact stored slide matched to this analysis.
Our analysis: It shows the break-even month next to the cash low point and sizes the raise to that low point. Our arithmetic confirms August 2022 profit (280,688€ − 255,241€ = 25,447€) and that 0.5€ per user at 5% conversion equals 10€ per paying user.
Evidence and limitation: The headline rounds 67,500 of 1,350,000 to 68K of 1.3M, the paying share varies across periods, and Powerz's own premium price is never stated.
What a founder can adapt: Put the break-even month, the cumulative cash low point and the raise on one slide, with the monthly profit at break-even.
Supporting analysis
What the deck claims: Slide 22: "Premium app : 5% of our users will convert", beside HBR's "2% to 5%" and Spotify and Dropbox conversion rates. Slide 23: "Breakeven in august 2022 with 68K paying users (1.3M users)", "Marketing : limited before beta, then 0.5€/new user (ie 10€/new paying user)", "Cashflow : up to -1.9M€", "Financing : need 2M€", and a monthly table of users, revenue, costs, profit and cash.
Presentation choice: It shows the break-even month next to the cash low point and sizes the raise to that low point. Our arithmetic confirms August 2022 profit (280,688€ − 255,241€ = 25,447€) and that 0.5€ per user at 5% conversion equals 10€ per paying user.
When it does not fit: The headline rounds 67,500 of 1,350,000 to 68K of 1.3M, the paying share varies across periods, and Powerz's own premium price is never stated.
A Kampala "Business in a Box" venture's 2026 investor deck. All figures are a 2027 forecast, not results.
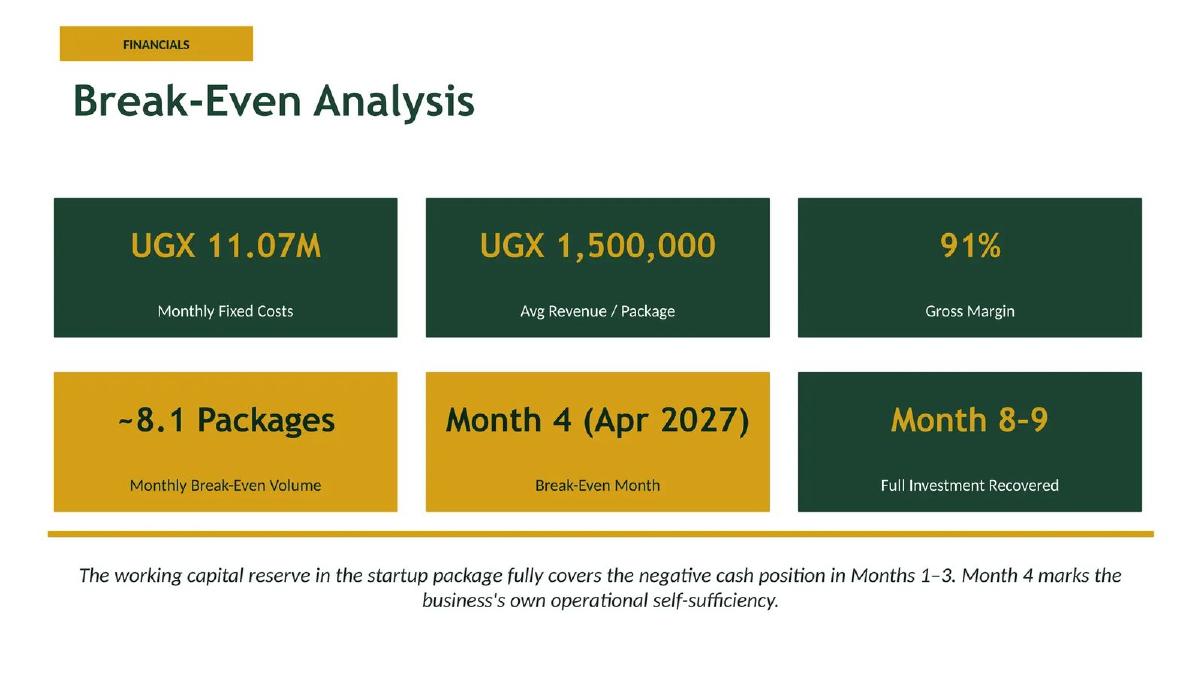
BizMallUG deck, slide 34. Exact stored slide matched to this analysis.
Our analysis: Its break-even volume is transparent and checks out (11.07M ÷ (1.5M × 0.91) ≈ 8.1). It also shows the gap this section warns about from the other side: by our approximate reading of slides 33 and 35, 2027 operating profit (about UGX 49M) falls short of the UGX 65M startup capital, so the payback month is not supported as stated.
Evidence and limitation: Do not label a month "Full Investment Recovered" without showing the cumulative cash line or saying what is recovered. Slide 35 also shows the UGX 35M external share is still being sought.
What a founder can adapt: Show break-even volume from fixed costs, price and margin as clearly as this slide does, then add the cumulative cash low point and define payback against the full amount invested.
Supporting analysis
What the deck claims: "UGX 11.07M Monthly Fixed Costs", "UGX 1,500,000 Avg Revenue / Package", "91% Gross Margin", "~8.1 Packages Monthly Break-Even Volume", "Month 4 (Apr 2027) Break-Even Month", "Month 8-9 Full Investment Recovered", and a note that the working capital reserve covers negative cash in months 1–3.
Presentation choice: Its break-even volume is transparent and checks out (11.07M ÷ (1.5M × 0.91) ≈ 8.1). It also shows the gap this section warns about from the other side: by our approximate reading of slides 33 and 35, 2027 operating profit (about UGX 49M) falls short of the UGX 65M startup capital, so the payback month is not supported as stated.
When it does not fit: Do not label a month "Full Investment Recovered" without showing the cumulative cash line or saying what is recovered. Slide 35 also shows the UGX 35M external share is still being sought.
Investors expect different evidence at each stage. Show the version that matches yours.
Stage
Lead with
Supporting detail
Pre-seed / seed
Burn, runway and simple forecast
Key assumptions, any early revenue
Series A
Revenue history and growth rate
Gross margin, burn multiple, forecast
Growth / public
Several years of reported results
Guidance, reconciliations, segments
Key Takeaways
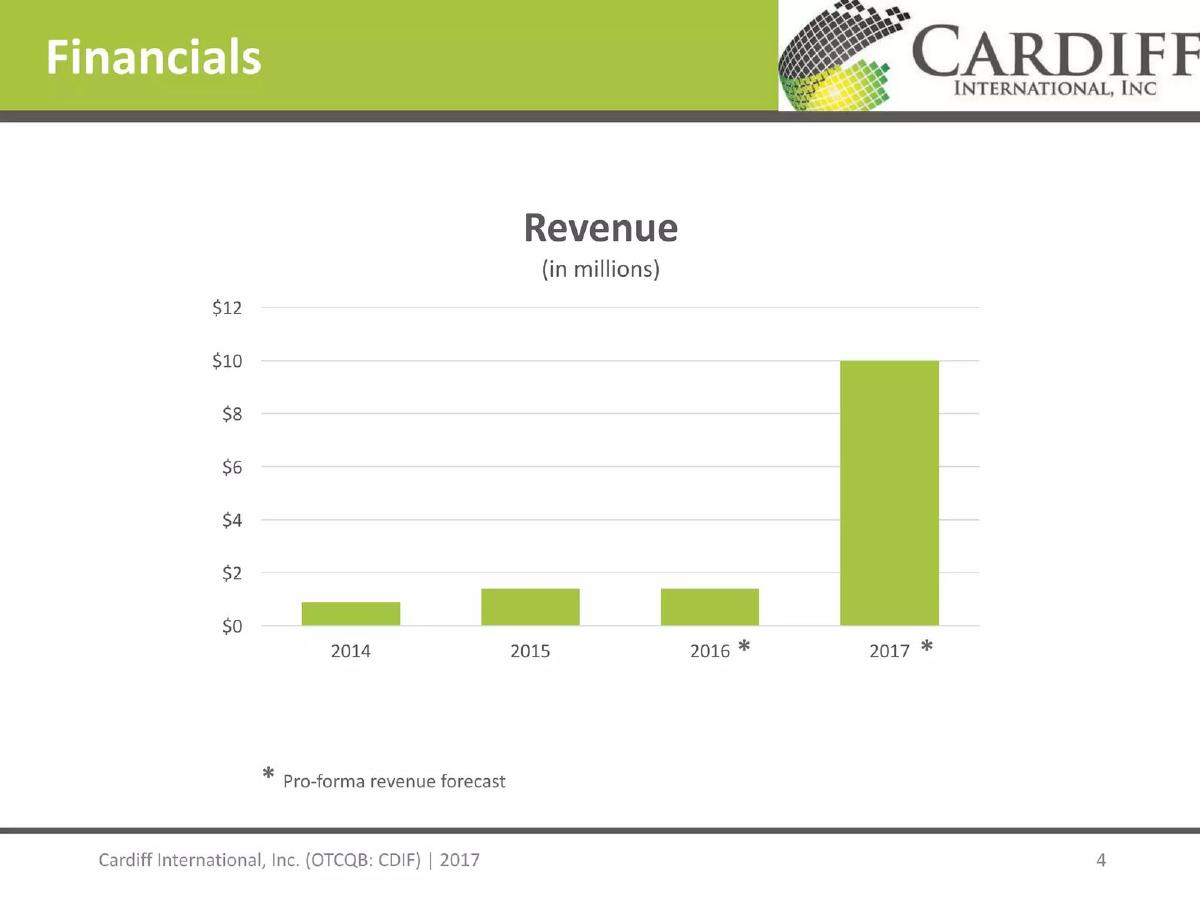
Separate fact, pipeline, and forecast. Solgreen labels revenue to date and in-process sales independently, while Cardiff marks pro-forma years rather than blending them with history.
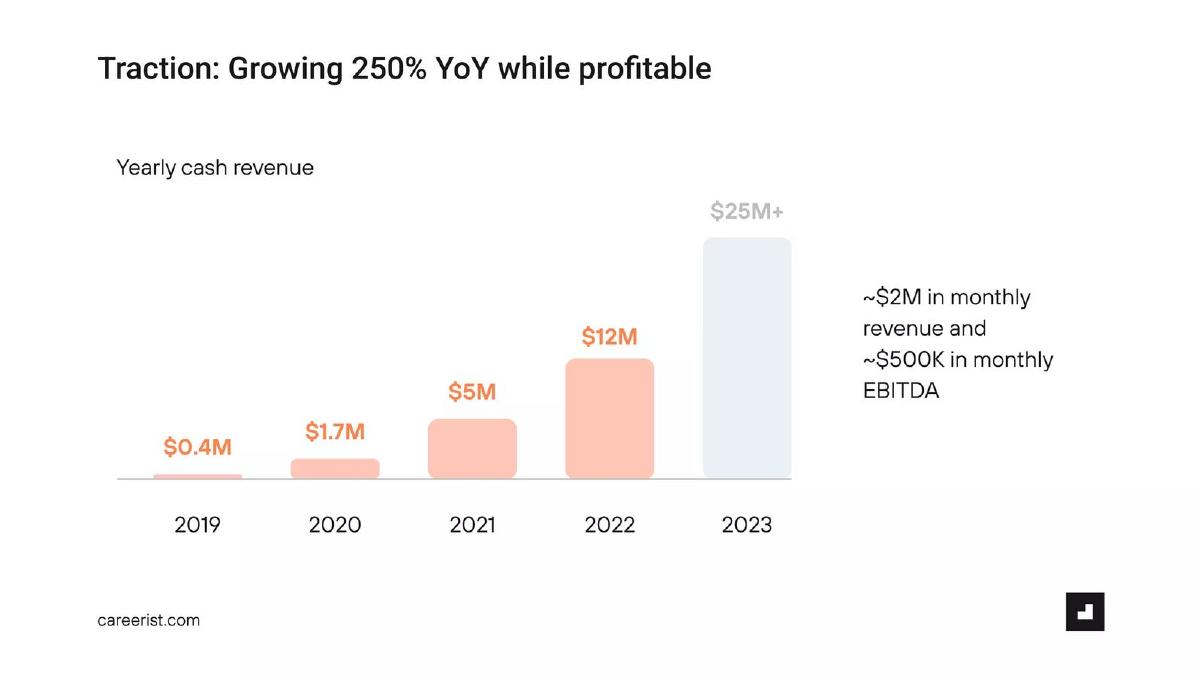
Lead with the strongest checkable financial result. Fuelfinance combines ARR growth with a stated EBITDA margin; Careerist puts growth and profitability in the headline.
Expose the driver behind the curve. Bev-Rage states a conversion assumption, while HearHere's top-down market arithmetic still needs subscriber and acquisition assumptions.
Make the ask reconcile with the model. The drone startup in our examples gives a burn range of ₹4–40 lakh a month, but founders should show one planned-spend case and the milestone it funds.
Build your financials slide
Make the model readable in seconds, then give investors enough inputs to test it.
Actuals. List the most recent revenue, spending, and margin figures, with period and currency.
Forecast. Show three to five years and label every projected period distinctly from history.
Drivers. Name three or four assumptions such as customers, price, retention, hiring, or conversion.
Runway. State monthly net burn, months funded, and the milestone reached before the next round.
Copyable framework: [Actual result] today; forecast to [future result] by [date], driven by [assumptions], with [months] runway to [milestone].
Illustrative example 1 — written by us
Before: $20M revenue in year five
After: $400K recognised revenue today; base case reaches $5M ARR in 36 months from 120 customers at $42K ACV, with 20 months of runway
What improved: The rewrite distinguishes the actual, forecast, drivers, and financing horizon.
What investors use the financials slide for
Sequoia's business plan outline is brief on this section: "Financials — If you have any, please include." That honesty is useful. At pre-seed and seed, many companies have little financial history, and investors know it. What they want from the slide is a sense of the company's scale today, its spending, and how the founders think the numbers will develop.
A forecast is a model of the business, not a promise. Investors read it for internal consistency: does revenue follow from the number of customers and the price on the business model slide? Do costs grow with hiring? Does the burn rate match the runway on the ask slide? A forecast that hangs together earns credibility even when the headline numbers are ambitious.
At later stages, the slide shifts from forecast to track record. Growth-stage and public-company decks in our corpus lead with several years of reported revenue, margin and EBITDA, and often include reconciliation notes. That level of detail is a sign of stage, not a template for a seed company. (Sequoia Capital)
What to put on the slide
History. Revenue for recent periods, even if small. If you are pre-revenue, show spending to date and anything that indicates demand, such as pre-orders or signed letters of intent, clearly labelled. Solgreen's slide, for an early-stage solar product, states revenue to date and in-process sales for the current quarter separately — two distinct facts.
The forecast. Three to five years of revenue, gross margin, operating costs and net income or loss. A simple table or two-line chart is enough. Label every forecast year as a forecast.
Key assumptions. Three or four lines stating what drives the forecast: customers added per month, price, retention, hiring plan. These are what an investor will argue with, so it is better to show them than have them discovered in a spreadsheet.
Burn and runway. Monthly net spending and how long current cash plus the new round lasts. This connects the financials to the ask. The drone startup's burn range of ₹4–40 lakh a month makes runway impossible to read, which invites the question of what the plan actually is.
Building a forecast investors can test
The most defensible forecasts are built from the bottom up: number of customers, times price, times retention, plus any other revenue. Each input comes from something you have observed or can justify. A top-down forecast — take a market size, assume a percentage — is easy to build and easy to dismiss.
HearHere's slide shows the top-down pattern: it multiplies a number of licensed drivers and vacationing adults by a $50 annual subscription to reach a market size, then states a projected revenue for a future year. The multiplication is clear, but an investor will want to know how many subscribers that revenue implies and how the company will acquire them.
Bev-Rage's slide takes a step towards bottom-up by showing an attendance figure and a conversion assumption of under 0.20% to units sold before a five-year revenue projection. Stating the conversion assumption is the right instinct; the next step is to show where that rate comes from.
Whatever method you use, show a base case you believe. Some founders add a downside case, which demonstrates that they have considered what happens if growth is slower. Avoid presenting only an upside case as the plan.
Seed, Series A and later: how the slide changes
At seed, the forecast is mostly assumption and the burn and runway matter most. Keep it simple: a few years of revenue and costs, the drivers, and the months of runway the round buys.
At Series A, investors expect a year or more of real revenue data and a forecast that grows from it. Metrics such as annual recurring revenue, growth rate, gross margin and burn multiple become central. Fuelfinance's slide — ARR doubling over a stated period, profitable with a 22% EBITDA margin, plus a customer satisfaction score — is a compact example of results-led financials.
At growth stage and in public markets, the slide leads with reported history. Ladenburg-conference and Needham-conference versions of the same company's deck show annual revenue for three years and guidance, with a note referring investors to an appendix reconciling GAAP net loss to adjusted EBITDA. Those notes exist because non-standard measures need explanation; private companies using adjusted figures should explain them too.
Profitability and growth together
A small number of decks in our corpus show that a company is growing and profitable at the same time. Careerist's reads "Growing 250% YoY while profitable" with yearly revenue and EBITDA. That combination changes the conversation: the round funds acceleration rather than survival.
If you can show both, lead with it. If you cannot, do not imply it. Investors will check whether "profitable" means monthly, annual, on a contribution basis or after all costs. State which.
When your forecast reaches break-even: the month, the cash low point and the raise
A forecast "break-even" usually means one month in which revenue covers that month's costs. It does not mean the money spent getting there has come back. Show the break-even month, the lowest point of cumulative cash and the amount you are raising together, so investors can see how much money the plan needs before it pays for itself.
Powerz's slide 23 (below) shows the gap clearly. Its key figures say "Breakeven in august 2022 with 68K paying users (1.3M users)", "Cashflow : up to -1.9M€" and "Financing : need 2M€". In the table, August 2022 has revenue of 280,688€ and costs of 255,241€, a profit of 25,447€, while cumulative cash stands at -1,862,911€; the lowest point is -1,888,358€ in July 2022. By our arithmetic, at that monthly profit it would take about 73 months to earn back the cash already spent. The 2M€ raise is sized to cover the cash low point, which is the right link to make.
Check that the headline matches the table. The table shows 67,500 paying users out of 1,350,000 in August 2022, exactly 5%; the headline rounds these to 68K and 1.3M. Use the table figures, or say that the headline is rounded.
Show the conversion path, not one rate. Slide 22 states "5% of our users will convert", but the table does not hold 5% throughout: in the early-access months every user is counted as paying, and in December 2021 it is 21,000 of 300,000, or 7%. If the rate changes over the forecast, show when and why.
State your own price. The slide cites other companies' figures — Harvard Business Review's "2% to 5%" freemium range, Spotify at 9,99€/mo with a "27% conversion rate" and Dropbox at 9,99€/mo with "4%" — but never gives Powerz's premium price. Dividing the table's revenue by paying users gives about 4.16€ per paying user a month up to August 2022, which is our calculation, not a price the company states. Label benchmark rates as other companies' figures.
What the slides leave unknown: Powerz's premium price, how many paying users cancel each month, whether the conversion benchmarks apply to a children's app, and whether any beta results exist. The figures are a September 2020 to September 2022 business plan, not results.
BizMallUG's slide 34 (below) makes the opposite choice: it names a break-even month and a payback month, but never shows the cash low point. It lists "UGX 11.07M Monthly Fixed Costs", "UGX 1,500,000 Avg Revenue / Package", "91% Gross Margin", "~8.1 Packages Monthly Break-Even Volume", "Month 4 (Apr 2027) Break-Even Month" and "Month 8-9 Full Investment Recovered", and says the working capital reserve "fully covers the negative cash position in Months 1–3". The volume checks out: 11.07M ÷ (1.5M × 0.91) ≈ 8.1 packages.
The payback claim is the part to question. Slide 35 sizes startup capital at UGX 65,000,000, including a UGX 13,000,000 "Working Capital Reserve (3 months)", funded by "UGX 30M Owner Equity (committed) + UGX 35M External Investment/Loan Sought". Reading slide 33's revenue chart by eye (about 7.5M, 9M and 12M for January to March 2027, rising to 25.5M in December) and applying the slide's 91% margin and fixed costs, our approximate arithmetic puts the months 1–3 shortfall near UGX 7M, inside the reserve, and total operating profit for 2027 near UGX 49M. That is below the UGX 65M invested, so "Full Investment Recovered" by month 8–9 does not follow from these slides unless it means something narrower, such as earning back only the early losses. The deck does not say which.
Where the two agree and differ: both name a break-even month; Powerz shows the cumulative cash low point and sizes its raise to it, while BizMallUG sizes a reserve but shows no cumulative cash line and makes a payback claim it does not support. Show all three on one slide — the first month revenue covers costs, the lowest cumulative cash balance, and the month cumulative cash returns to zero against the full amount invested — and say what "recovered" counts.
Format and design
A financials slide fails when it is a dense spreadsheet. Kevin Hale's advice at Y Combinator is that each slide should be understood at a glance. For financials, that usually means one chart of revenue (history and forecast visually distinguished) and a small table of three to five lines.
Distinguish actuals from forecasts visually: solid bars for history, lighter or hatched bars for projections, and a clear label. Put the full model in the data room and say so on the slide.
Use consistent units. Mixing thousands and millions, or monthly and annual figures, on one slide causes errors in the investor's reading. Label currency and period on every axis. (Y Combinator)
Common mistakes
Forecast with no history. Even small actual numbers anchor the forecast. Show what you have.
Revenue without costs. A revenue line alone hides burn. Show costs and net income or loss.
Unstated assumptions. Investors will find the drivers anyway. Show three or four on the slide.
Top-down only. Market share assumptions are easy to dismiss. Build revenue from customers, price and retention.
Actuals and forecasts look the same. Distinguish them visually and in labels.
Runway that disagrees with the ask. Burn on this slide must match the months on the ask slide.
Break-even shown without the cash low point. One profitable month does not repay earlier spending. Show cumulative cash at its lowest and the raise that covers it.
Diagnostic checklist
Recent actual revenue and spending
Three to five years of forecast, labelled
Revenue, gross margin, costs, net result
Three or four key assumptions
Monthly burn and runway
Break-even month shown with the cumulative cash low point
Actuals and forecasts visually distinct
Adjusted measures defined
Full model available in the data room
Frequently asked questions
How many years of projections should a pitch deck include?
Three to five years is common. At seed, the first eighteen to twenty-four months matter most because they cover the runway; later years show ambition and the shape of the business.
What if I am pre-revenue?
Show spending to date, burn, runway and a forecast built from clearly stated assumptions. Sequoia's outline acknowledges this directly: include financials if you have any. (Sequoia Capital)
Should I show a detailed spreadsheet on the slide?
No. Show a chart and a short table, and put the full model in the data room. A slide should be readable at a glance. (Y Combinator)
Bottom-up or top-down forecast?
Bottom-up forecasts built from customers, price and retention are easier to defend. Top-down market-share forecasts are useful as a sense check, not as the plan.
What KPIs should I forecast?
The ones that drive revenue in your model: customers or users, average revenue per customer, retention or churn, and gross margin. For subscription businesses, annual recurring revenue and burn are usually central.
Should I include EBITDA or adjusted figures?
Only if they help explain the business, and always with a definition. Growth-stage decks often reconcile adjusted figures to reported results; private companies should be equally clear about what is excluded.
How we chose these examples
Corpus: published pitch deck teardowns on StartupFundraising.com, including some growth-stage and public-company investor presentations, labelled as such. Founder-uploaded private decks are excluded entirely.
Selection: our slide-type classifier is not reliable enough to pick examples, so we searched extracted slide text for financial projection, forecast, P&L and EBITDA language with year references, between slides three and twenty-five. We read 40 matching slides and chose ten that show a clear approach, including one common pattern to improve on.
Review: examples were selected and described by our editorial model from the extracted slide text and checked against that text. No person has yet reviewed these examples for this page.
Financial figures quoted are the companies' own statements on their slides; we have not verified them and they are not investment information.
Update (29 September 2026): the Powerz example and break-even section were added after searching slide text across the whole library; every quoted figure was checked against the exact slide images. BizMallUG (slide 34, read with slides 33 and 35) was added the same day as a contrasting example.
We make no claim that any financials slide caused a fundraising outcome.