Pitch Deck Business Model Slides: Real Examples and What
How to write a business model slide investors can model: who pays, for what, how much and how often, with examples of subscription, commission.
Pitch Deck Business Model Slides: Real Examples and What Works
Compare twelve real business model slides across subscriptions, marketplaces, transaction fees, revenue shares, per-unit licences, physical products and fees that may be paid in equity, then make your own model calculable.
TL;DR
A business model slide should identify who pays, what they buy, how much they pay, and how often—plus material costs or revenue shares. These examples show how a few precise inputs can make a model legible, and why unranked lists of possible revenue streams create uncertainty.
Business model slides from real pitch decks
Each example pairs the exact business model slide from its public deck with specific analysis when the image is available. Prices and economics remain deck claims; missing exact images are recorded and never replaced.
Twine business model slide — slide 9
A freelance marketplace connecting companies with creative professionals.
Verified source excerpt — slide 9
Companies post project briefs with a budget; Twine takes a 20% commission for facilitating hire and payment; ratings and milestones create trust and reduce platform circumvention.
The exact business model slide image is not present in the stored slide-image set. No substitute is used.
Our analysis: Who pays, what share and how leakage is controlled — all in three lines.
Evidence and limitation: Show whether the commission is on the total project or on each milestone payment; it affects when revenue is recognised.
What a founder can adapt: For any marketplace, state the take rate, the paying side, and one mechanism that keeps transactions on the platform.
Supporting analysis
What the deck claims: Companies post project briefs with a budget; Twine takes a 20% commission for facilitating hire and payment; ratings and milestones create trust and reduce platform circumvention.
Presentation choice: Who pays, what share and how leakage is controlled — all in three lines.
When it does not fit: Show whether the commission is on the total project or on each milestone payment; it affects when revenue is recognised.
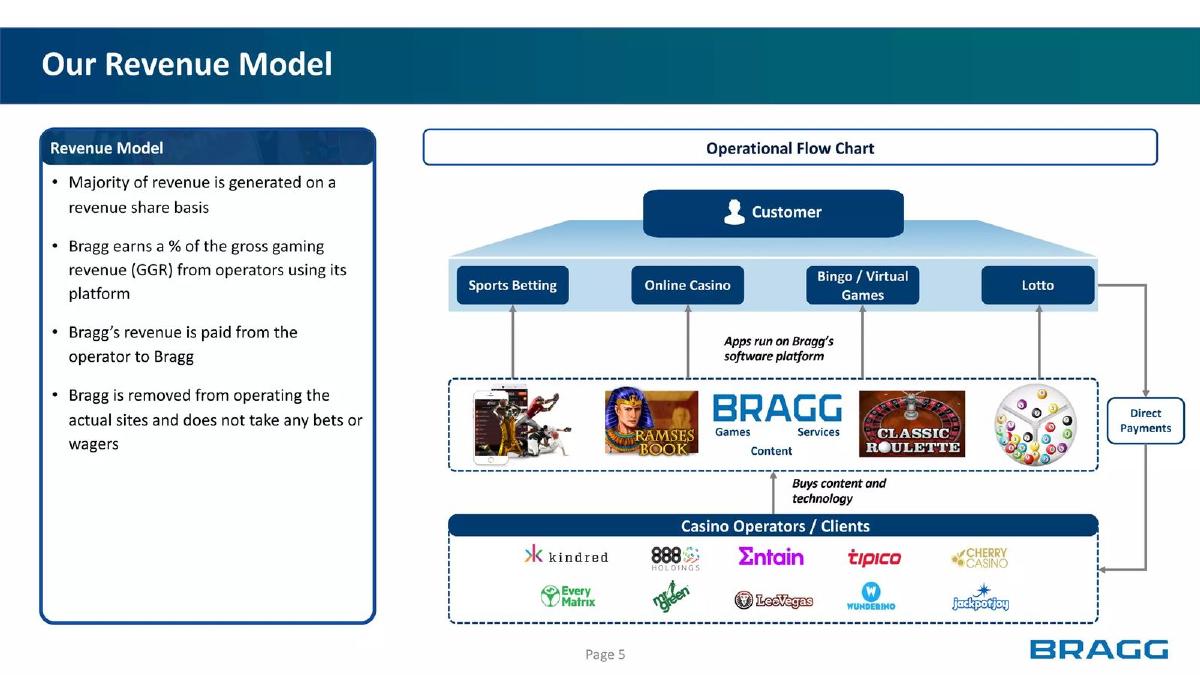
A listed gaming-content supplier presenting to investors.
Bragg Gaming Group deck, slide 6. Exact stored slide matched to this analysis.
Our analysis: It names the pool the share comes from and who pays it.
Evidence and limitation: Add the typical share range; a percentage of an undefined pool is hard to model.
What a founder can adapt: For revenue-share models, name the revenue you take a share of and whether you or the partner collects it.
Supporting analysis
What the deck claims: Most revenue is earned on a revenue-share basis, as a percentage of gross gaming revenue from operators using its platform, paid by the operator.
Presentation choice: It names the pool the share comes from and who pays it.
When it does not fit: Add the typical share range; a percentage of an undefined pool is hard to model.
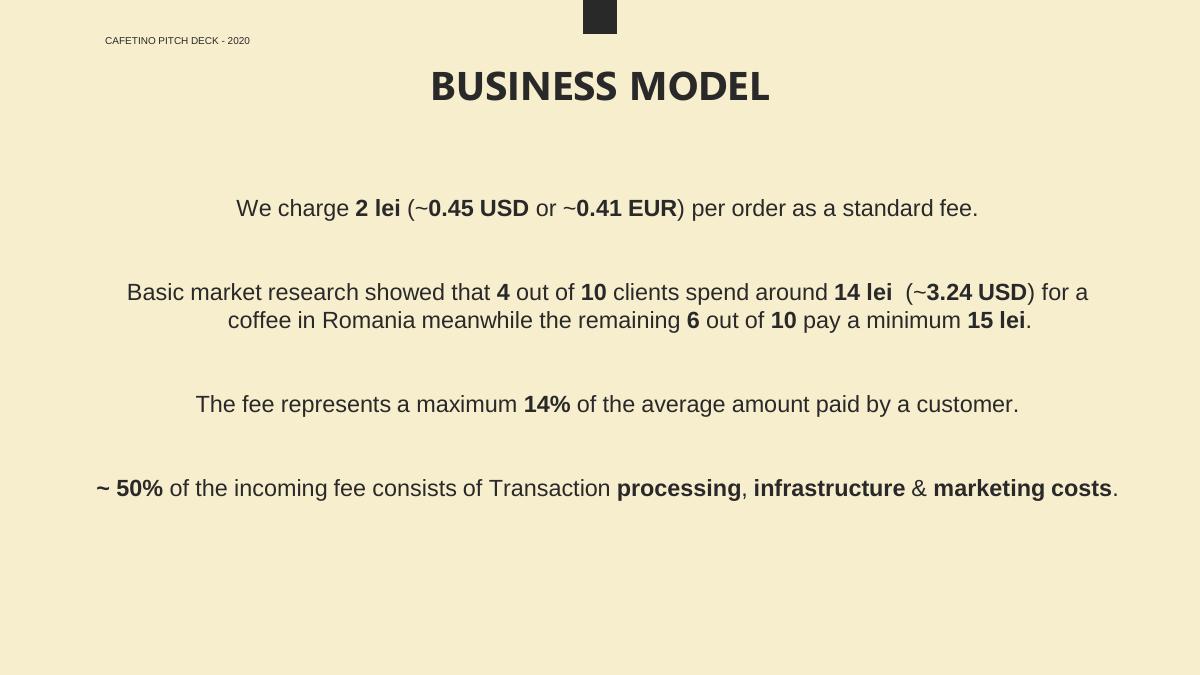
A coffee-ordering app in Romania; the slide header reads "Cafetino pitch deck - 2020".
Cafetino deck, slide 6. Exact stored slide matched to this analysis.
Our analysis: It gives the fee, relates it to what the customer already pays, and discloses the cost of delivering it — enough to estimate contribution per order.
Evidence and limitation: The slide does not say whether the customer or the café pays the fee, and the market research behind the 4-in-10 split is described only as basic.
What a founder can adapt: State the fee and what it is charged on, express it as a share of order value, and say roughly how much of it you keep.
Supporting analysis
What the deck claims: A standard fee of 2 lei (about $0.45) per order; the company's own market research puts typical coffee spend at 14–15 lei, so the fee is at most 14% of the average order; about 50% of the fee goes on transaction processing, infrastructure and marketing.
Presentation choice: It gives the fee, relates it to what the customer already pays, and discloses the cost of delivering it — enough to estimate contribution per order.
When it does not fit: The slide does not say whether the customer or the café pays the fee, and the market research behind the 4-in-10 split is described only as basic.
A marketplace for booking skill and tutoring sessions.
SkillSesh deck, slide 6. Exact stored slide matched to this analysis.
Our analysis: A low take rate is presented as a deliberate strategy to increase transactions, and the session price lets an investor work out revenue per booking (roughly $2.50–$4 by our arithmetic).
Evidence and limitation: The "lowest in tutoring" claim is unsourced, and the freemium plan introduces a second model before the first is proven; keep future models clearly secondary.
What a founder can adapt: If your take rate is a competitive choice, say so and give the transaction value it applies to.
Supporting analysis
What the deck claims: At launch a 10% commission on every session booked, described in a footnote as the lowest percentage in tutoring; average sessions of $25–40 according to the company's user data and external research; a possible freemium model charging pro users later.
Presentation choice: A low take rate is presented as a deliberate strategy to increase transactions, and the session price lets an investor work out revenue per booking (roughly $2.50–$4 by our arithmetic).
When it does not fit: The "lowest in tutoring" claim is unsourced, and the freemium plan introduces a second model before the first is proven; keep future models clearly secondary.
A cloud video-surveillance software company selling through telecom service providers.
Iveda deck, slide 5. Exact stored slide matched to this analysis.
Our analysis: The billing unit (camera per month), the paying customer (the service provider) and the cost allocation (the provider hosts) are all visible, which is why the slide can credibly call the model scalable.
Evidence and limitation: No price per camera appears, so the investor still cannot size revenue; "extremely scalable" is the company's description, not evidence.
What a founder can adapt: In a channel model, name the partner that pays you, the unit you bill, and who carries the infrastructure cost.
Supporting analysis
What the deck claims: Service providers pay a monthly licence fee per camera for the SENTIR software and install it in their own data centres, so they carry the hosting and storage cost; a diagram shows cameras feeding a telecom data centre and out to screens.
Presentation choice: The billing unit (camera per month), the paying customer (the service provider) and the cost allocation (the provider hosts) are all visible, which is why the slide can credibly call the model scalable.
When it does not fit: No price per camera appears, so the investor still cannot size revenue; "extremely scalable" is the company's description, not evidence.
A US dating marketplace linking daters with restaurants, bars and cafés.
Kama deck, slide 5. Exact stored slide matched to this analysis.
Our analysis: The two-sided diagram makes the flow of money visible, and the run-rate target is traceable: 100 venues at $99 a month is about $119,000 a year.
Evidence and limitation: The large market counts (singles, restaurants) sit beside the model without a conversion path; the $120,000 is a forecast, and the discount funded by venues is not reconciled with the $99 fee.
What a founder can adapt: For a two-sided model, draw both sides, mark which one pays you, and tie any target to a stated number of paying units.
Supporting analysis
What the deck claims: Daters spend $30–$70 per date and receive a 10–20% discount; venues pay $99 per month; a B2B subscription model with a $120,000 revenue run rate expected by December 2020 based on 100 partnering venues.
Presentation choice: The two-sided diagram makes the flow of money visible, and the run-rate target is traceable: 100 venues at $99 a month is about $119,000 a year.
When it does not fit: The large market counts (singles, restaurants) sit beside the model without a conversion path; the $120,000 is a forecast, and the discount funded by venues is not reconciled with the $99 fee.
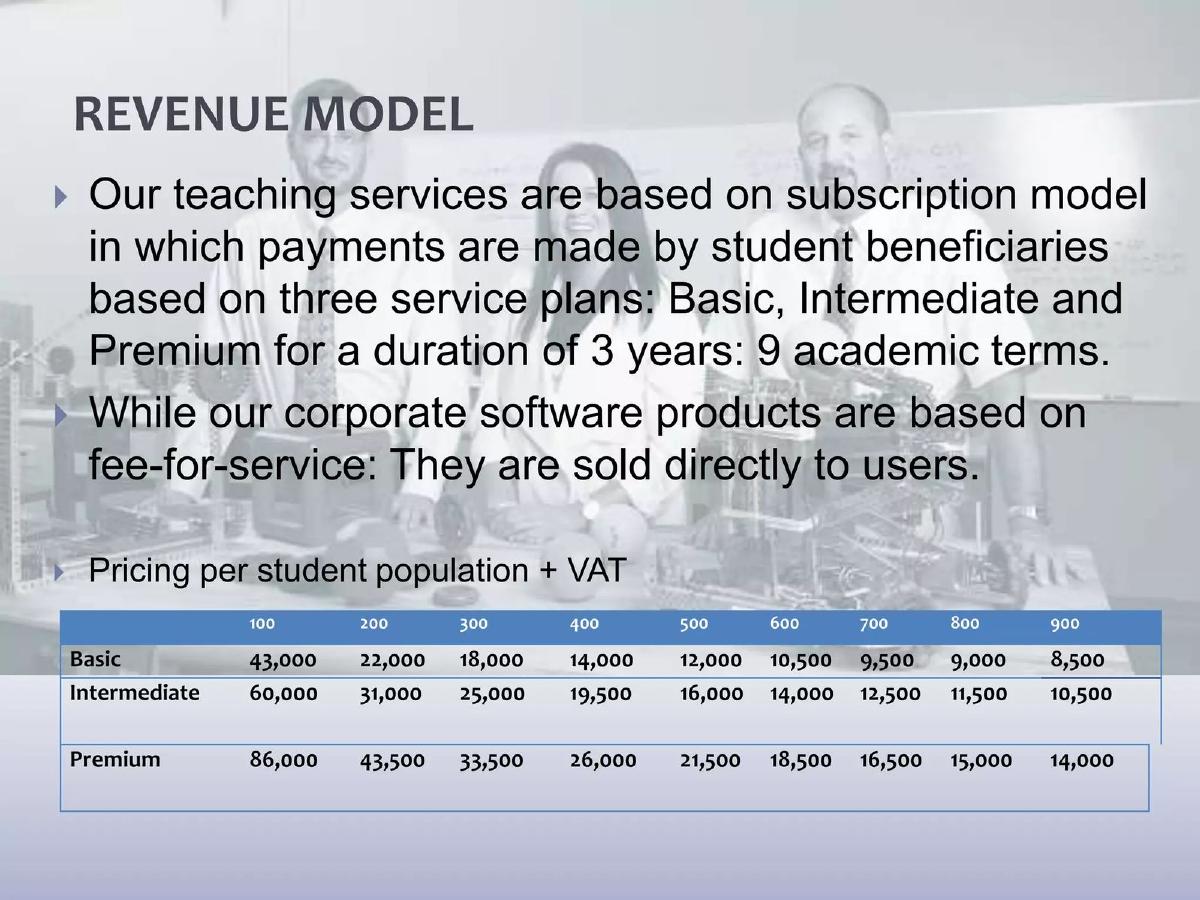
An education-technology company with teaching services and corporate software.
Cereus deck, slide 6. Exact stored slide matched to this analysis.
Our analysis: The volume-pricing table shows how price changes with customer size, which is information most tiered models leave out.
Evidence and limitation: The table shows no currency and the slide does not say which plan most customers choose; the corporate software stream has no price at all.
What a founder can adapt: If pricing depends on customer size, a compact volume table can replace paragraphs of explanation.
Supporting analysis
What the deck claims: Teaching services are subscriptions paid by students on Basic, Intermediate and Premium plans over three years (nine terms); corporate software is fee-for-service; a table prices each plan by student population from 100 to 900, with the price per unit falling as population rises.
Presentation choice: The volume-pricing table shows how price changes with customer size, which is information most tiered models leave out.
When it does not fit: The table shows no currency and the slide does not say which plan most customers choose; the corporate software stream has no price at all.
A consumer selfie-competition app, pre-revenue at the time of the deck.
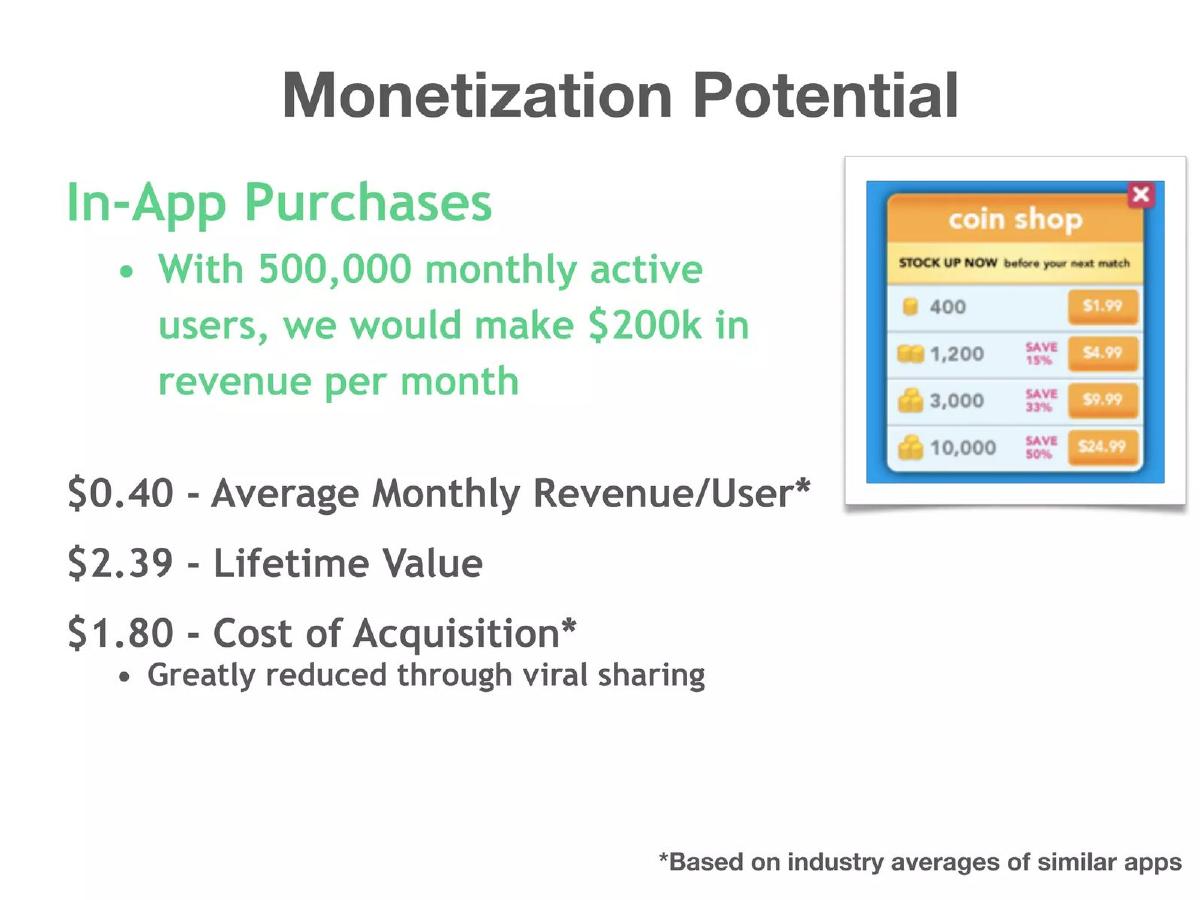
Pickle deck, slide 5. Exact stored slide matched to this analysis.
Our analysis: Included as a pattern to handle carefully: the projection is internally consistent (500,000 × $0.40 = $200,000) and honestly footnoted, but none of it is the company's own data.
Evidence and limitation: A lifetime value only about 1.3 times acquisition cost undermines the case; "greatly reduced through viral sharing" is an assumption that needs evidence.
What a founder can adapt: If you must show pre-launch economics, label the source of each assumption as Pickle does, and show the in-app pricing that produces them.
Supporting analysis
What the deck claims: In-app coin purchases; with 500,000 monthly active users it would make $200k per month; $0.40 average monthly revenue per user, $2.39 lifetime value and $1.80 acquisition cost, footnoted as based on industry averages of similar apps.
Presentation choice: Included as a pattern to handle carefully: the projection is internally consistent (500,000 × $0.40 = $200,000) and honestly footnoted, but none of it is the company's own data.
When it does not fit: A lifetime value only about 1.3 times acquisition cost undermines the case; "greatly reduced through viral sharing" is an assumption that needs evidence.
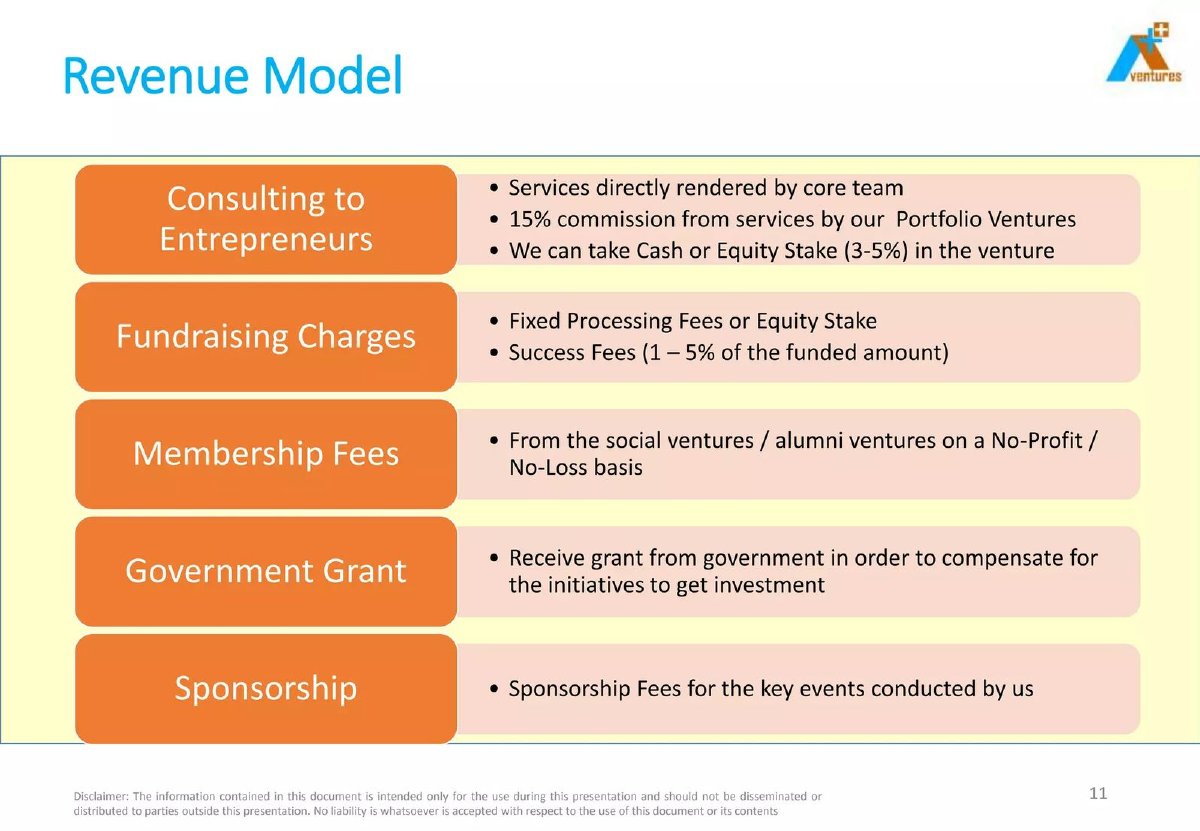
A platform that screens and mentors early-stage startups and connects them with investors. Stage and year are not stated on the slide.
Plan A deck, slide 11. Exact stored slide matched to this analysis.
Our analysis: It states openly that some fees may be paid as a stake in the client, and gives the stake size for consulting (3–5%).
Evidence and limitation: No fee amounts, no split between cash and equity clients and no valuation basis appear, and five revenue streams sit side by side with no leader, so an investor cannot size any of them.
What a founder can adapt: If you accept equity instead of cash, show it as its own line, separate from cash revenue, with the number of stakes and how you value them.
Supporting analysis
What the deck claims: "Revenue Model": Consulting to Entrepreneurs — "Services directly rendered by core team", "15% commission from services by our Portfolio Ventures", "We can take Cash or Equity Stake (3-5%) in the venture". Fundraising Charges — "Fixed Processing Fees or Equity Stake", "Success Fees (1 – 5% of the funded amount)". Also membership fees "on a No-Profit / No-Loss basis", a government grant and event sponsorship fees.
Presentation choice: It states openly that some fees may be paid as a stake in the client, and gives the stake size for consulting (3–5%).
When it does not fit: No fee amounts, no split between cash and equity clients and no valuation basis appear, and five revenue streams sit side by side with no leader, so an investor cannot size any of them.
The essential numbers differ by model. These are the ones investors most often ask for.
Model
Must show
Useful if you have it
Subscription
Price per unit and billing period
Average contract size, retention
Marketplace
Take rate and paying side
Repeat purchase rate, leakage controls
Revenue share
The revenue pool and your share
Partner concentration
Physical product
Unit cost and price by channel
Channel mix
Per-transaction fee
Fee, what it is charged on, cost to deliver
Fee as a share of order value
Per-unit licence
Billing unit and who carries hosting cost
Units per customer
Key Takeaways
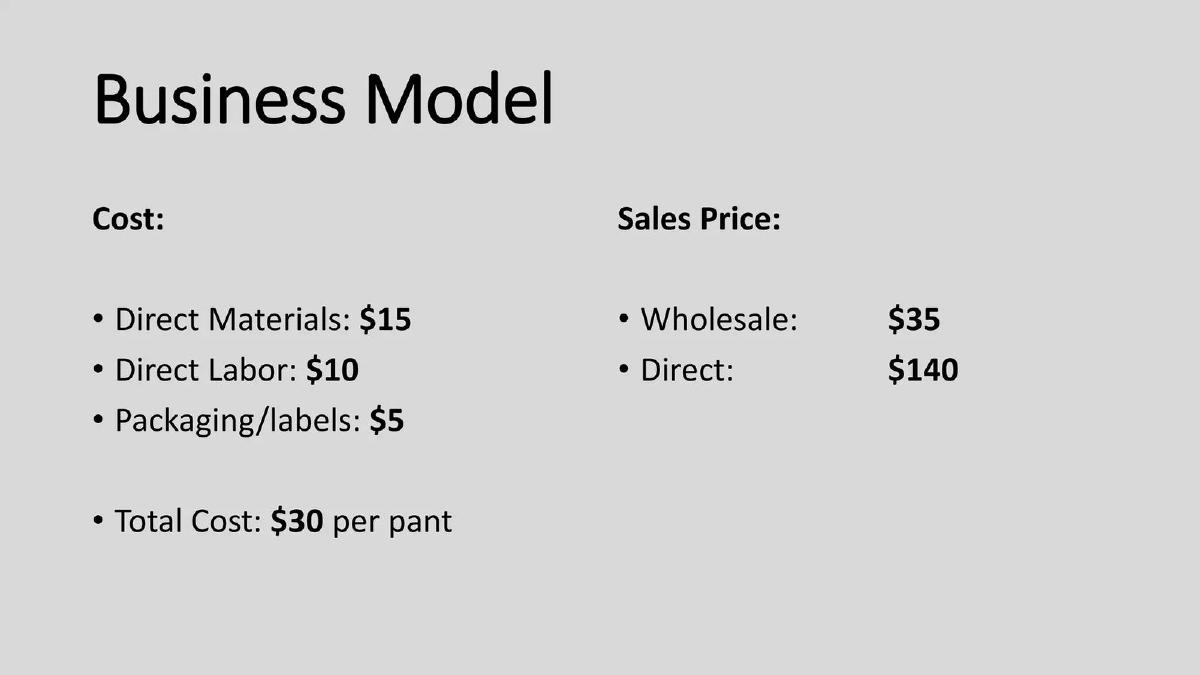
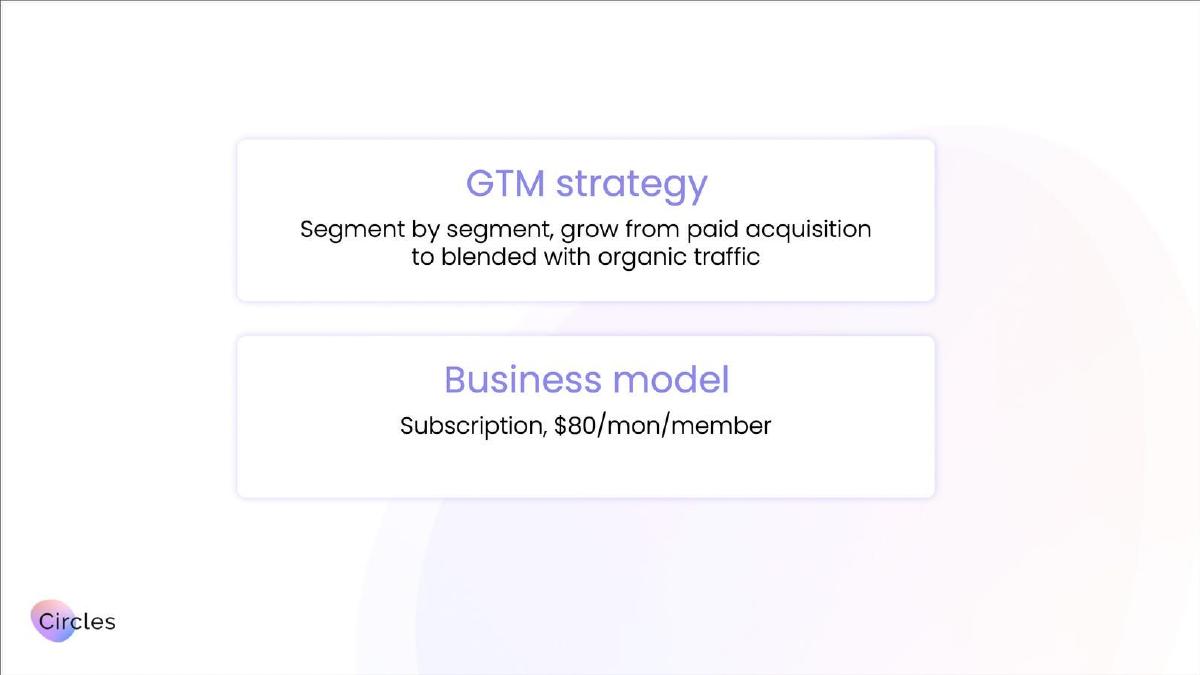
Make the unit calculable. Polar Pants shows cost and price by channel, while Circles states a monthly per-member price.
Name the paying side and the share. Twine's claimed 20% commission is only useful because the slide also identifies the company posting the project as payer.
Show what the fee is worth to the customer and what it costs you. Cafetino sets its per-order fee against the typical coffee price and says roughly half of the fee goes on processing, infrastructure and marketing.
Label projections as projections. Pickle's revenue, lifetime value and acquisition cost figures are hypothetical and based on industry averages, and its own numbers imply only a modest margin between the two.
Show model risk, not only price. HomeFit's stated 50/50 professional split exposes the margin constraint an investor would test next.
Build your business model slide
Give an investor the minimum inputs needed to sketch revenue and gross margin without guessing.
Payer. Name the exact customer or marketplace side that pays.
Unit. Define what is purchased: seat, member, transaction, project, loan, or product.
Price and frequency. State the price or take rate and whether it repeats monthly, annually, or per transaction.
Cost and risk. Show material supplier shares, unit costs, funding costs, or leakage risks.
Copyable framework: [Customer] pays [price] per [unit] every [frequency]; after [material cost/share], we retain [margin or revenue].
Illustrative example 1 — written by us
Before: Multiple flexible revenue streams
After: Employers pay $30 per active seat each month; implementation is a separate one-time fee
What improved: The rewrite identifies payer, unit, price, frequency, and the relationship between recurring and one-off revenue.
What investors are looking for
Sequoia's business plan outline gives this section a one-line brief: "How do you intend to thrive?" The question is broader than pricing. An investor wants to understand how each customer turns into revenue, whether that revenue repeats, and whether the margin left over can pay for growth.
In practice they will try to build a simple model from your slide: number of customers, times price, times frequency, minus the cost of serving them. If the slide gives them the inputs, the model is quick and the conversation moves on. If it does not, they will either ask — using up meeting time — or make their own assumptions, which may be less favourable than yours.
The business model slide also sets up later slides. Traction should be measured in the unit the business model charges for. Financials should grow from the same price and frequency. If the model says per-seat subscription and the traction slide shows downloads, the investor has to reconcile the two. (Sequoia Capital)
The four inputs to put on the slide
Who pays. Name the paying customer precisely. In a marketplace, say which side pays. Twine's slide makes it clear that companies posting projects pay, not the freelancers. In a business-to-business-to-consumer model, say whether the business or the end user is billed.
What they pay for. A subscription to software, a fee per transaction, a commission on a sale, a unit of physical product, a licence. Iveda's slide says telecom service providers pay a monthly licence fee per camera and host the system in their own data centres — so an investor learns both the billing unit and who carries the hosting cost.
How much. A real price or an average. HomeFit gives an average monthly payment of $500 and a 50/50 split with fitness professionals. Circles, a support-group company, states "Subscription, $80/mon/member". A number makes the model concrete even if it will change.
How often. Monthly, annual, per transaction, one-off. Recurring revenue is valued differently from one-off sales, so be explicit. If different customer groups buy on different terms — as on Cereus's slide, where students buy three-year subscription plans while corporate software is sold fee-for-service — show both and say which matters more.
Common business model types and how to show each
Subscription. Show price per unit (user, seat, location, member), billing period and, when you have it, typical contract size. If there are tiers, show the tier most customers choose rather than every tier.
Marketplace or commission. Show the take rate and who pays it. Twine's 20% commission and SkillSesh's 10% commission per booked session are both stated in one line. Add one line on how the platform prevents customers from going around it; Twine notes that ratings and project milestones "reduce platform circumvention".
Revenue share. Show whose revenue you share and the basis. Bragg Gaming Group's slide says it earns a percentage of the gross gaming revenue from operators using its platform. It names the pool of money its share comes from, though not the size of the share.
Physical product. Show unit cost, selling price and channel. Polar Pants lists direct materials, labour and packaging adding up to $30 per unit, against a wholesale price of $35 and a direct price of $140. The gap between those two channel prices is the most important fact on the slide, because it shows why channel mix matters to margin.
Per-transaction fee. Show the fee, what it is charged on, and what it costs to deliver. Cafetino charges a flat 2 lei per order, relates that to typical coffee prices, and states that about half of the fee is consumed by processing, infrastructure and marketing costs.
Showing unit economics without overclaiming
Many investors will want to see unit economics — what it costs to acquire a customer, what the customer pays over time, and what margin remains. At seed, you may not have enough history for reliable figures. Show what you have and label the rest as targets.
Physical product companies can often show real per-unit margins from the start, as Polar Pants does. Software and marketplace companies usually need a few months of retention data before lifetime value means anything. If your numbers are based on a handful of customers or a short period, say so; investors will discount unlabelled figures more heavily than labelled estimates.
Pickle, a selfie-game app, shows how this looks when nothing has happened yet: its $0.40 monthly revenue per user, $2.39 lifetime value and $1.80 acquisition cost are footnoted as industry averages of similar apps. The labelling is honest; the implied ratio of about 1.3 to 1 is the number an investor would question. Keep acquisition cost and lifetime value on the same basis. If lifetime value is calculated on gross margin, acquisition cost should include all sales and marketing spending, not only paid advertising. Investors who find a mismatch will question the rest of the model.
Multiple revenue streams: when to show them
It is tempting to show every way the company could make money. Listing subscription, per-project and pay-per-use pricing side by side can signal flexibility, but it can also signal that the company has not yet found out what customers will pay for.
A useful rule is to lead with the stream that earns most of today's revenue, or that you expect to earn most of it in the next eighteen months, and show others as secondary. If a second stream is essential, explain how it relates to the first.
Multi-sided models need an extra line on sequence. Kama's dating-marketplace slide shows daters spending $30–$70 per date and venues paying $99 a month; it is clear the venue subscription is the revenue line, but investors will also want to know which side has to be won first.
When you may be paid in shares instead of cash
Some service businesses, such as accelerators, advisers and fundraising platforms, offer to take an ownership stake in a client instead of a cash fee. Plan A's revenue model slide (slide 11) says of consulting to entrepreneurs: "We can take Cash or Equity Stake (3-5%) in the venture", and of fundraising charges: "Fixed Processing Fees or Equity Stake", alongside "Success Fees (1 – 5% of the funded amount)".
The slide makes the option clear. It doesn't give what an investor needs to model it: how large the cash fees are, how often clients choose equity over cash, how the company would put a value on a 3–5% stake in an early-stage venture, or when, if ever, that stake could be sold. A cash fee arrives when it is billed. A stake is worth something only if the client company later raises money at a higher price, is sold or lists, and many early-stage companies do neither.
So keep the two apart on the slide. Show cash fees as revenue with their price and frequency. Show equity taken as a separate line: the number of stakes held, the typical percentage, and the basis for any value you give (for example, the price of the client's latest funding round, with its date). Don't add the value of stakes to cash revenue, and don't imply a stake is as good as cash. How non-cash payment is recorded in accounts depends on the applicable accounting standards; confirm it with your accountant rather than stating it on the slide.
Template: "Cash: [fee] per [service], [n] paying clients in [period]. Equity instead of cash: [n] stakes of [x–y]% taken in [period]; valued at [$ / not valued], based on [latest round price and date]. Equity is not included in revenue." Leave a field blank if you don't have the figure yet.
Where the slide sits and how it connects
Business model slides usually follow the product or solution slide and come before traction or go-to-market. That order lets the investor understand what the company sells, then how it charges, then how well that is working.
Some decks combine business model with go-to-market or with market size. Circles puts its go-to-market strategy and business model on the same slide; Lola, a travel software company, combines "SaaS and Transactional revenue" with its sales motion. Combining can work when both fit in a few lines. If either needs a chart, give it its own slide.
For healthcare companies where reimbursement determines who pays, a standard business model slide is often not enough. Our healthcare reimbursement guide covers how to show billing codes, payer mix and coverage risk.
Common mistakes
Listing revenue streams without a leader. Several possible models suggest uncertainty. Lead with the one that earns, or will earn, most of the revenue.
No numbers. "Subscription" is a category, not a model. Add the price and billing period.
Unclear paying side. In marketplaces and business-to-business-to-consumer models, investors need to know exactly who is billed.
Unlabelled targets. Unit economics based on a few customers should be labelled as early or targets.
Traction measured in a different unit. If you charge per seat, show seats on the traction slide, not downloads.
Counting equity as cash. A stake taken instead of a fee is not cash revenue. Show it on its own line, with how you value it.
Ignoring cost of revenue. Supplier splits, hardware and payment costs change the margin. Show them if they are material.
Diagnostic checklist
Who pays, named precisely
What they pay for
Price or average revenue per unit
Billing frequency, recurring or one-off
Take rate or revenue split if relevant
Unit cost for physical products
Targets labelled as targets
Traction and financials use the same unit
Any equity taken instead of fees shown separately from cash revenue
Frequently asked questions
What is the difference between a business model slide and a revenue model slide?
Decks use the terms interchangeably. Strictly, the revenue model is how you charge, while the business model also covers costs and margin. On the slide, cover at least who pays, for what, how much and how often.
Should I show pricing tiers?
Show the tier most customers choose, or a typical contract size. A full pricing table is better in the appendix.
Do I need unit economics at seed?
Show what you have and label estimates clearly. Physical product companies can usually show per-unit margin; software companies often need a few months of retention data first.
Can I combine business model and go-to-market on one slide?
Yes, if both fit in a few lines, as several decks in our examples do. If either needs a chart, give it its own slide.
What does Sequoia ask for in this section?
Sequoia's business plan outline asks, simply, "How do you intend to thrive?" Treat that as a prompt to explain how customers turn into repeatable, profitable revenue. (Sequoia Capital)
How is a healthcare business model different?
When insurers or government programmes pay, you also need to show billing codes, payer mix and coverage risk. Our healthcare reimbursement guide covers that in detail.
How we chose these examples
Corpus: published pitch deck teardowns on StartupFundraising.com. Founder-uploaded private decks are excluded entirely.
Selection: our slide-type classifier is not reliable enough to pick examples, so we searched extracted slide text for business and revenue model headings combined with a price, percentage or pricing term, between slides three and twenty-five. We read 40 matching slides and chose ten that show a clear approach. In the 2026-09-24 image upgrade we searched slides two to six (the range held in our image archive) for the same headings, inspected each candidate image, and replaced five examples whose slides are not archived with six whose exact slides are.
Review: examples were selected and described by our editorial model from the extracted slide text and, for examples with images, the slide image itself. No person has yet reviewed these examples for this page.
Prices and splits quoted are the companies' own statements on their slides at the time; we have not verified them and they may have changed.
We make no claim that any business model slide caused a fundraising outcome.