Unit Economics Slide: LTV, CAC and Payback Examples
How startups show unit economics in a pitch deck: LTV, CAC, LTV:CAC and CAC payback period. Real slides compared, with a worksheet.
Unit Economics Slide: LTV, CAC and Payback Examples
Twelve real slides, shown in full, compare how startups present what one customer costs to acquire and what that customer is worth.
TL;DR
A unit economics slide shows whether each new customer makes money: what you spend to win one (CAC), what they bring in over time (LTV), and how long it takes to earn back the acquisition cost (payback). The clearest slides below, Minut's and Female Invest's, give LTV and CAC as real numbers with the unit and period. Super.com adds payback on the first transaction and gross-profit-based LTV:CAC. Weaker slides give only a ratio, or a ratio with the inputs hidden. Show both inputs, say how you calculated them, and state the time period.
Unit economics slides from real pitch decks
Each example shows the exact stored slide above its analysis and links to the full teardown. Figures are as shown on the slides; we have not verified them. Stage and year are given only where the slide or deck states them.
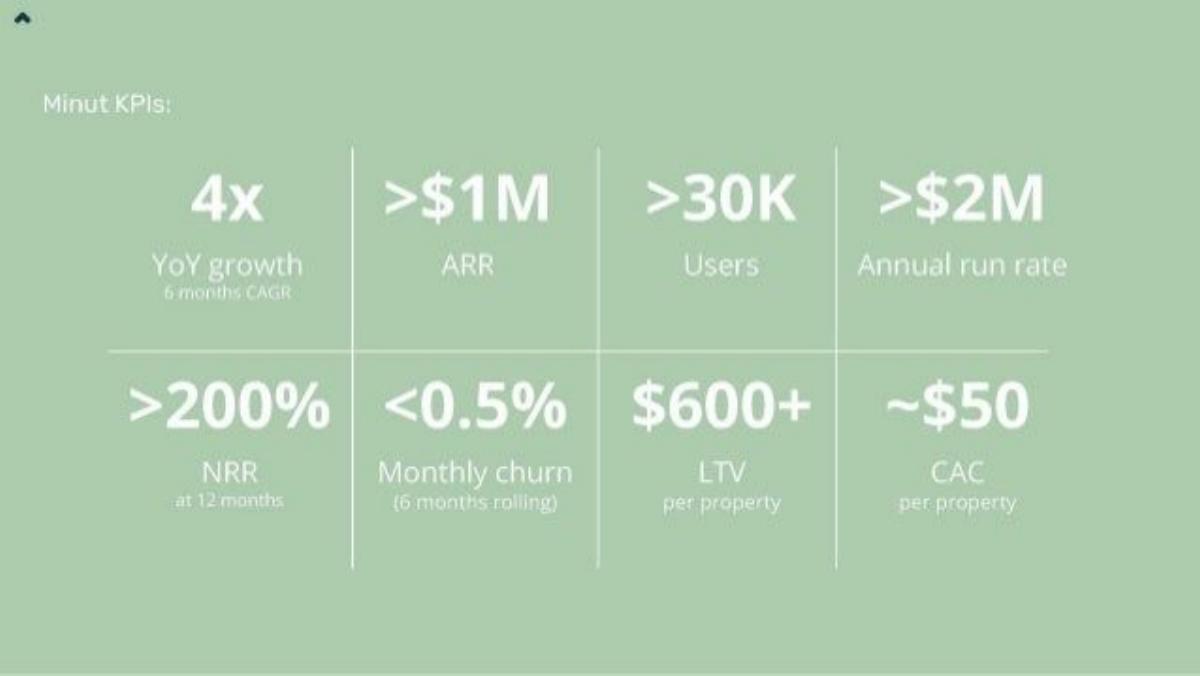
Minut unit economics slide — slide 5
Home monitoring for short-term rentals. Stage and year are not stated on the slide.
Minut deck, slide 5. Exact stored slide matched to this analysis.
Our analysis: LTV and CAC are both shown in dollars per property, next to the churn and retention that produce them.
Evidence and limitation: Eight numbers on one slide compete. The LTV:CAC ratio (about 12x) is left for the reader to work out.
What a founder can adapt: Put LTV and CAC in the same unit (per customer, per seat, per property) beside churn.
Supporting analysis
What the deck claims: "Minut KPIs": 4x YoY growth (6 months CAGR); >$1M ARR; >30K users; >$2M annual run rate; >200% NRR at 12 months; <0.5% monthly churn (6 months rolling); $600+ LTV per property; ~$50 CAC per property.
Presentation choice: LTV and CAC are both shown in dollars per property, next to the churn and retention that produce them.
When it does not fit: Eight numbers on one slide compete. The LTV:CAC ratio (about 12x) is left for the reader to work out.
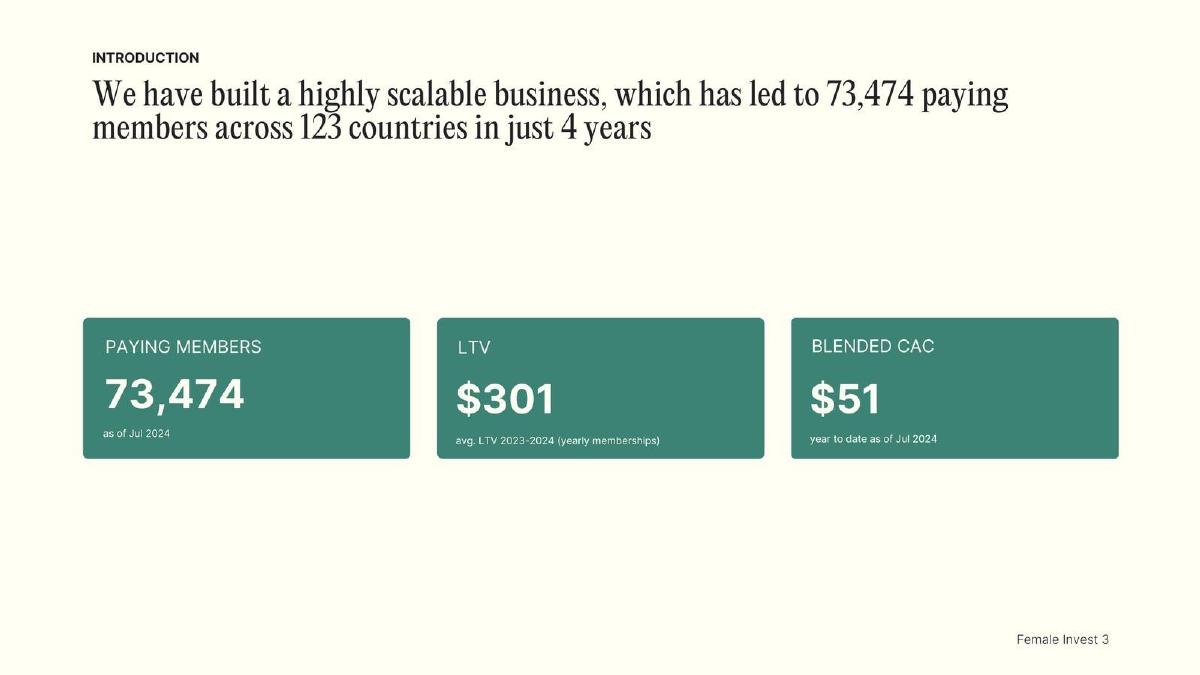
Investing education membership. Figures dated July 2024.
Female Invest deck, slide 3. Exact stored slide matched to this analysis.
Our analysis: Each number carries its period and basis, so an investor knows exactly what was measured.
Evidence and limitation: LTV covers yearly memberships only while CAC is blended. Say whether monthly members would change the picture.
What a founder can adapt: Label every figure with its period and what it includes, like "blended" or "yearly plans only".
Supporting analysis
What the deck claims: "We have built a highly scalable business, which has led to 73,474 paying members across 123 countries in just 4 years." Tiles: paying members 73,474 (as of Jul 2024); LTV $301 (avg. LTV 2021–2024, yearly memberships); blended CAC $51 (year to date as of Jul 2024).
Presentation choice: Each number carries its period and basis, so an investor knows exactly what was measured.
When it does not fit: LTV covers yearly memberships only while CAC is blended. Say whether monthly members would change the picture.
Super.com deck, slide 4. Exact stored slide matched to this analysis.
Our analysis: It uses gross profit, gives payback on the first purchase, and separates actual from estimated.
Evidence and limitation: The revenue chart has no values on the axis. Label the bars.
What a founder can adapt: Show when a customer pays back and the ratio over a stated window, based on gross profit.
Supporting analysis
What the deck claims: "High & Efficient Growth with Strong Unit Economics." Net revenue chart 2018A–2022A: "Growth at ~100% CAGR from 2018 to 2022"; "Gross margin of ~80%". "Customers payback gross profit on their first transaction — 1st transaction GP LTV:CAC of ~2x." "Estimated 4x+ GP LTV:CAC over 36 months — consistently improving GP LTV:CAC of customer cohorts."
Presentation choice: It uses gross profit, gives payback on the first purchase, and separates actual from estimated.
When it does not fit: The revenue chart has no values on the axis. Label the bars.
Afrocenchix deck, slide 5. Exact stored slide matched to this analysis.
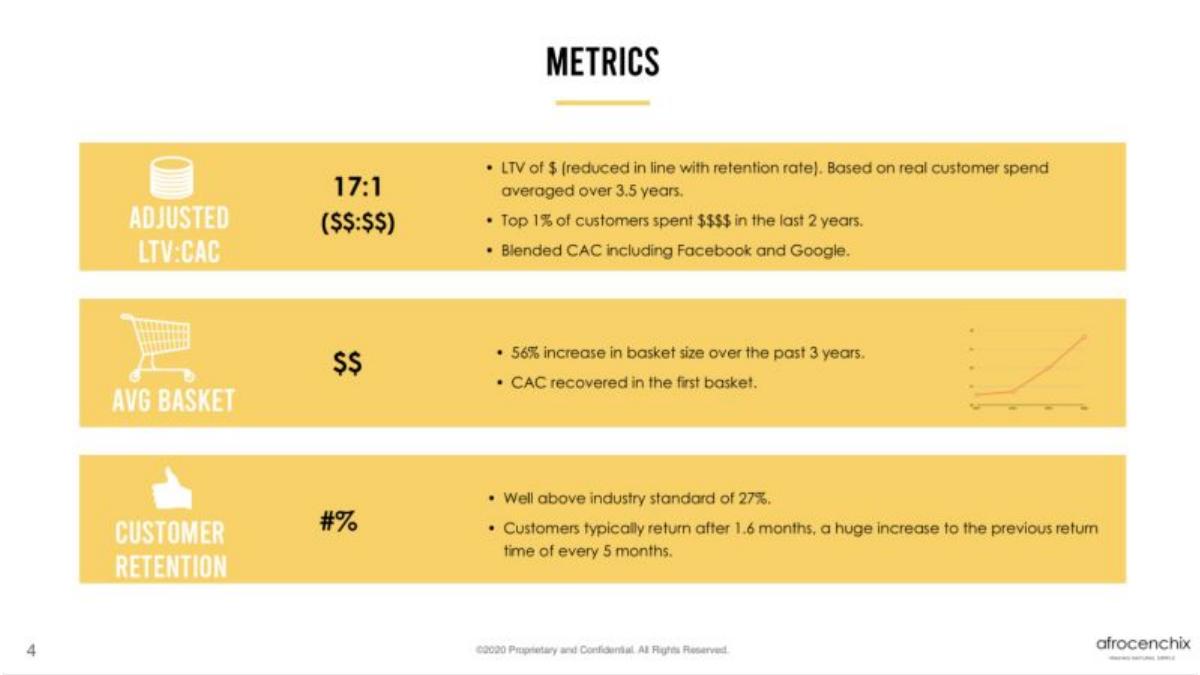
Our analysis: It explains how LTV was calculated (real spend, adjusted for retention) and that CAC includes paid channels.
Evidence and limitation: The published version replaces the inputs with placeholders. A ratio without the numbers behind it is hard to trust.
What a founder can adapt: Explain your method in one line: what spend, over what period, adjusted how.
Supporting analysis
What the deck claims: "Metrics": Adjusted LTV:CAC 17:1 ($$:$$) — "LTV of $ (reduced in line with retention rate). Based on real customer spend averaged over 3.5 years. Top 1% of customers spent $$$$ in the last 2 years. Blended CAC including Facebook and Google." Avg basket $$ — "56% increase in basket size over the past 3 years. CAC recovered in the first basket." Customer retention #% — "Well above industry standard of 27%."
Presentation choice: It explains how LTV was calculated (real spend, adjusted for retention) and that CAC includes paid channels.
When it does not fit: The published version replaces the inputs with placeholders. A ratio without the numbers behind it is hard to trust.
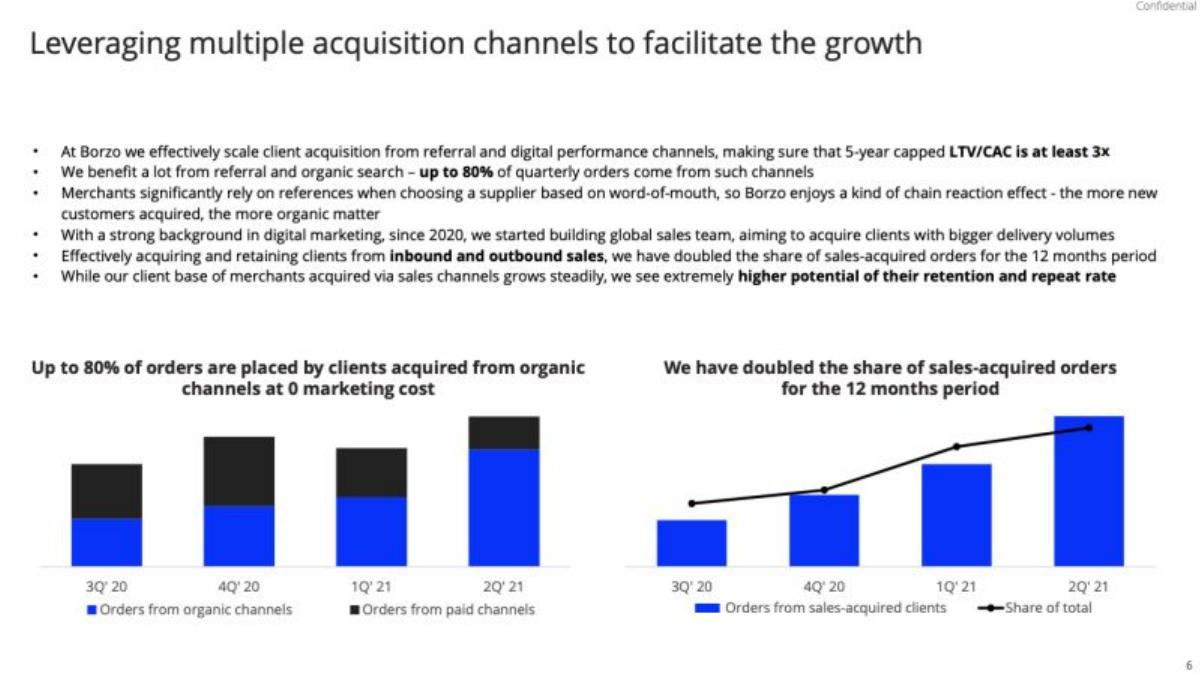
Same-day delivery platform. The charts cover Q3 2020–Q2 2021.
Borzo deck, slide 6. Exact stored slide matched to this analysis.
Our analysis: It caps LTV at five years and sets a minimum ratio for each channel, which shows discipline.
Evidence and limitation: The 3x is a target, not a measured result, and the charts have no values. Show the actual ratio.
What a founder can adapt: State the LTV window and the ratio you require before spending on a channel.
Supporting analysis
What the deck claims: "Leveraging multiple acquisition channels to facilitate the growth." Bullets include: "we effectively scale client acquisition from referral and digital performance channels, making sure that 5-year capped LTV/CAC is at least 3x"; "up to 80% of quarterly orders come from such channels". Charts: "Up to 80% of orders are placed by clients acquired from organic channels at 0 marketing cost"; "We have doubled the share of sales-acquired orders for the 12 months period".
Presentation choice: It caps LTV at five years and sets a minimum ratio for each channel, which shows discipline.
When it does not fit: The 3x is a target, not a measured result, and the charts have no values. Show the actual ratio.
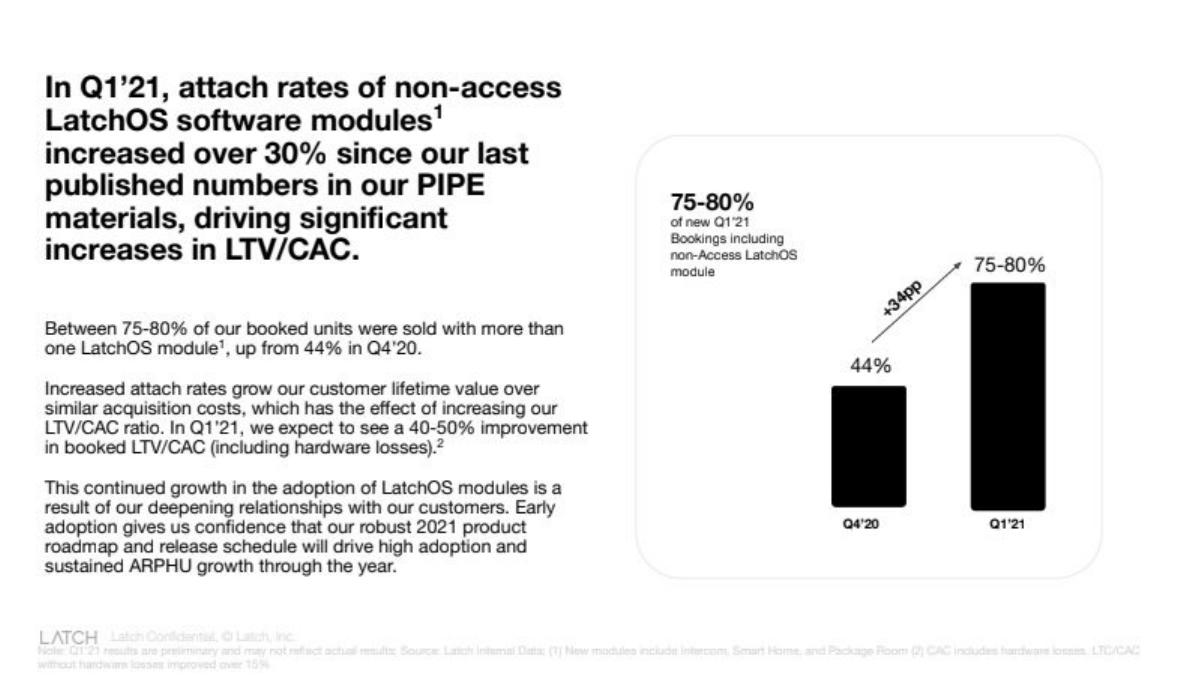
Smart access and building software. Figures refer to Q4 2020 and Q1 2021.
Latch deck, slide 6. Exact stored slide matched to this analysis.
Our analysis: It shows the lever behind the ratio (more software sold per unit) and includes hardware losses.
Evidence and limitation: The improvement is an expectation and the ratio itself isn't given. Give the current figure.
What a founder can adapt: Show what you're changing to improve unit economics, not only the result.
Supporting analysis
What the deck claims: "In Q1'21, attach rates of non-access LatchOS software modules increased over 30% since our last published numbers in our PIPE materials, driving significant increases in LTV/CAC." "Between 75–80% of our booked units were sold with more than one LatchOS module, up from 44% in Q4'20." "In Q1'21, we expect to see a 40–50% improvement in booked LTV/CAC (including hardware losses)." Chart: 44% to 75–80%.
Presentation choice: It shows the lever behind the ratio (more software sold per unit) and includes hardware losses.
When it does not fit: The improvement is an expectation and the ratio itself isn't given. Give the current figure.
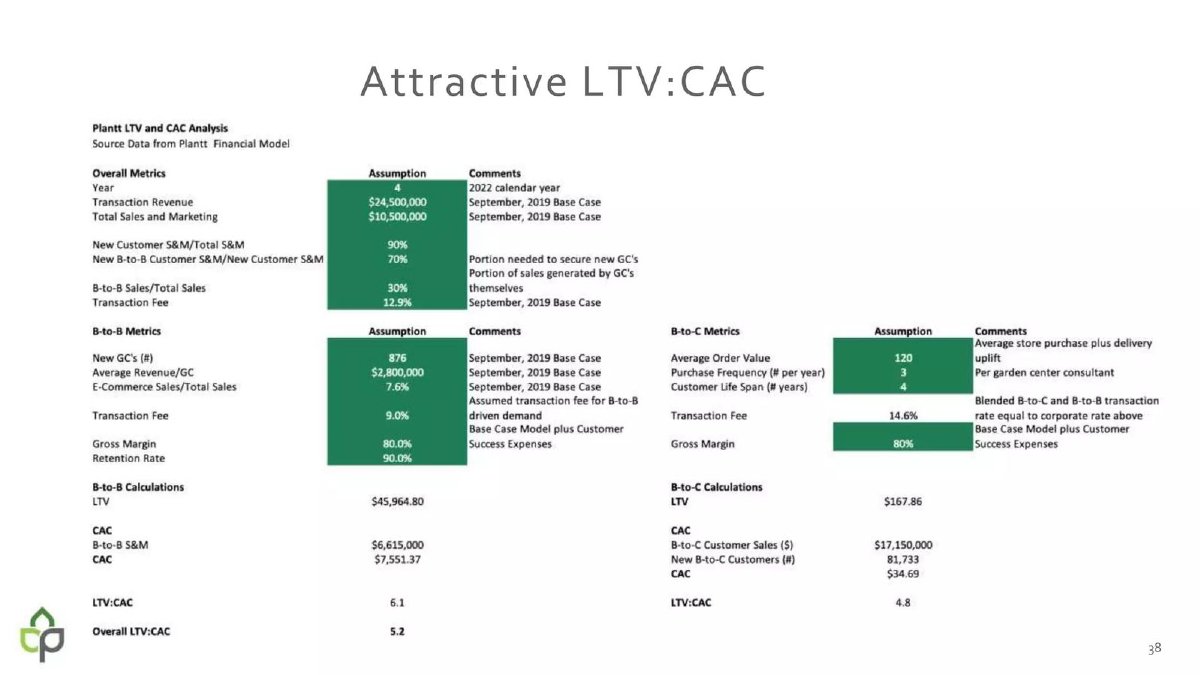
Online ordering and delivery for independent garden centres. The deck is dated November 2019; the figures are a forecast for 2022.
Plantt deck, slide 38. Exact stored slide matched to this analysis.
Our analysis: It shows its inputs, labels them as a base-case forecast, uses gross margin, and splits the two customer types. Our arithmetic reproduces both CAC figures from the inputs shown.
Evidence and limitation: The B2B LTV equals 3 years of gross profit, but the slide lists 90% retention without saying how that became 3 years, and it doesn't explain how the overall 5.2 was worked out. CAC is allocated from one budget by assumed shares.
What a founder can adapt: Put the inputs, the formula and the scenario date on the slide so a reader can recompute each figure.
Supporting analysis
What the deck claims: "Attractive LTV:CAC." "Source Data from Plantt Financial Model." Year 4 ("2022 calendar year"); transaction revenue $24,500,000 and total sales and marketing $10,500,000 ("September, 2019 Base Case"); new customer S&M/total S&M 90%; new B-to-B customer S&M/new customer S&M 70%. B-to-B: 876 new garden centres; average revenue per garden centre $2,800,000; e-commerce sales/total sales 7.6%; transaction fee 9.0%; gross margin 80.0%; retention rate 90.0%; LTV $45,964.80; CAC $7,551.37; LTV:CAC 6.1. B-to-C: average order value 120; 3 purchases a year; 4-year life span; transaction fee 14.6%; gross margin 80%; LTV $167.86; 81,733 new customers; CAC $34.69; LTV:CAC 4.8. "Overall LTV:CAC 5.2."
Presentation choice: It shows its inputs, labels them as a base-case forecast, uses gross margin, and splits the two customer types. Our arithmetic reproduces both CAC figures from the inputs shown.
When it does not fit: The B2B LTV equals 3 years of gross profit, but the slide lists 90% retention without saying how that became 3 years, and it doesn't explain how the overall 5.2 was worked out. CAC is allocated from one budget by assumed shares.
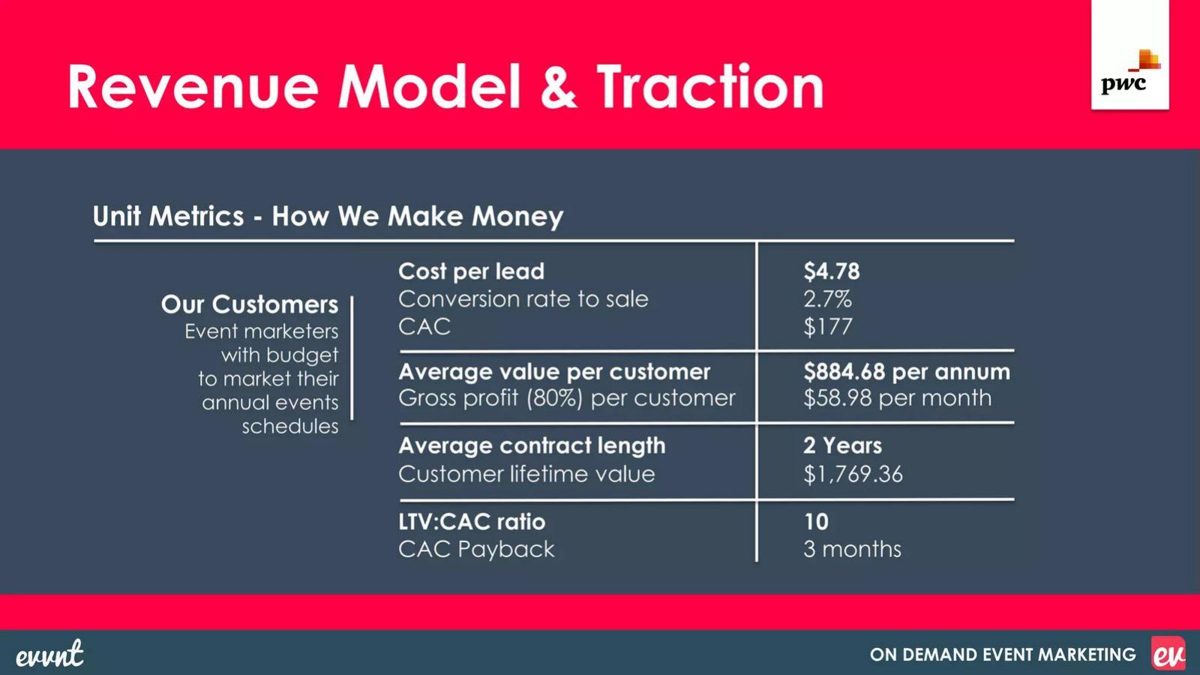
On-demand event marketing for event marketers. Stage and year are not stated on the slide.
Evvnt deck, slide 10. Exact stored slide matched to this analysis.
Our analysis: Every input behind payback is on the slide, and the sums check: $4.78 ÷ 2.7% ≈ $177, $884.68 × 80% ÷ 12 = $58.98, and $177 ÷ $58.98 = 3.0 months (our arithmetic).
Evidence and limitation: Payback uses gross profit, but the $1,769.36 LTV is two years of revenue ($884.68 × 2), so the ratio of 10 is on revenue. On gross profit, two years is $1,415.52, about 8x (our arithmetic). Use one basis for both.
What a founder can adapt: Show CAC and monthly gross profit per customer next to the payback figure so a reader can divide one by the other.
Supporting analysis
What the deck claims: "Unit Metrics - How We Make Money." Cost per lead $4.78; conversion rate to sale 2.7%; CAC $177. Average value per customer $884.68 per annum; gross profit (80%) per customer $58.98 per month. Average contract length 2 years; customer lifetime value $1,769.36. LTV:CAC ratio 10; CAC payback 3 months.
Presentation choice: Every input behind payback is on the slide, and the sums check: $4.78 ÷ 2.7% ≈ $177, $884.68 × 80% ÷ 12 = $58.98, and $177 ÷ $58.98 = 3.0 months (our arithmetic).
When it does not fit: Payback uses gross profit, but the $1,769.36 LTV is two years of revenue ($884.68 × 2), so the ratio of 10 is on revenue. On gross profit, two years is $1,415.52, about 8x (our arithmetic). Use one basis for both.
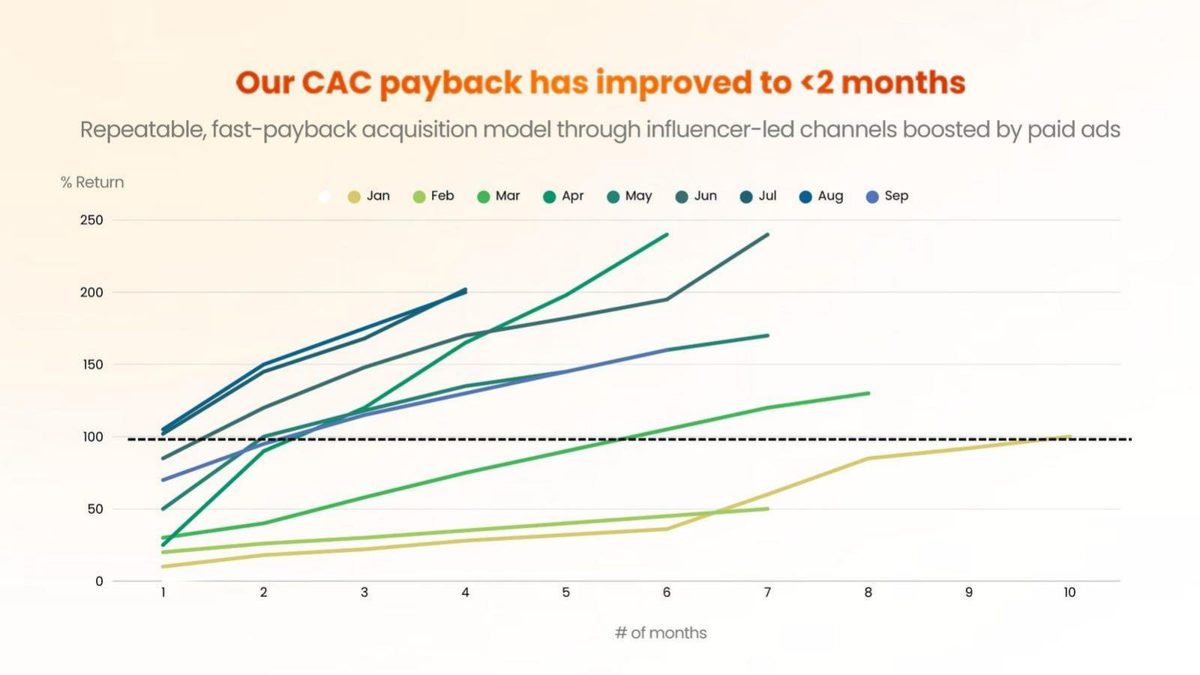
Creator and community platform. The chart shows monthly cohorts from January to September; the year is not stated on the slide.
Nas.com deck, slide 21. Exact stored slide matched to this analysis.
Our analysis: A cohort chart lets investors see when each month's customers repaid their acquisition cost, and that the improvement is in recent cohorts, not one average.
Evidence and limitation: Our reading of the chart (estimate): the July and August cohorts are at about 100% in month 1, January reaches 100% around month 10, and February is near 50% at month 7. The headline describes the best cohorts, and the slide doesn't say whether return is revenue or gross profit.
What a founder can adapt: Plot cumulative return per cohort against a 100% line, and label what 'return' measures.
Supporting analysis
What the deck claims: "Our CAC payback has improved to <2 months." "Repeatable, fast-payback acquisition model through influencer-led channels boosted by paid ads." Line chart of "% Return" by "# of months" for cohorts Jan to Sep, with a dashed line at 100%.
Presentation choice: A cohort chart lets investors see when each month's customers repaid their acquisition cost, and that the improvement is in recent cohorts, not one average.
When it does not fit: Our reading of the chart (estimate): the July and August cohorts are at about 100% in month 1, January reaches 100% around month 10, and February is near 50% at month 7. The headline describes the best cohorts, and the slide doesn't say whether return is revenue or gross profit.
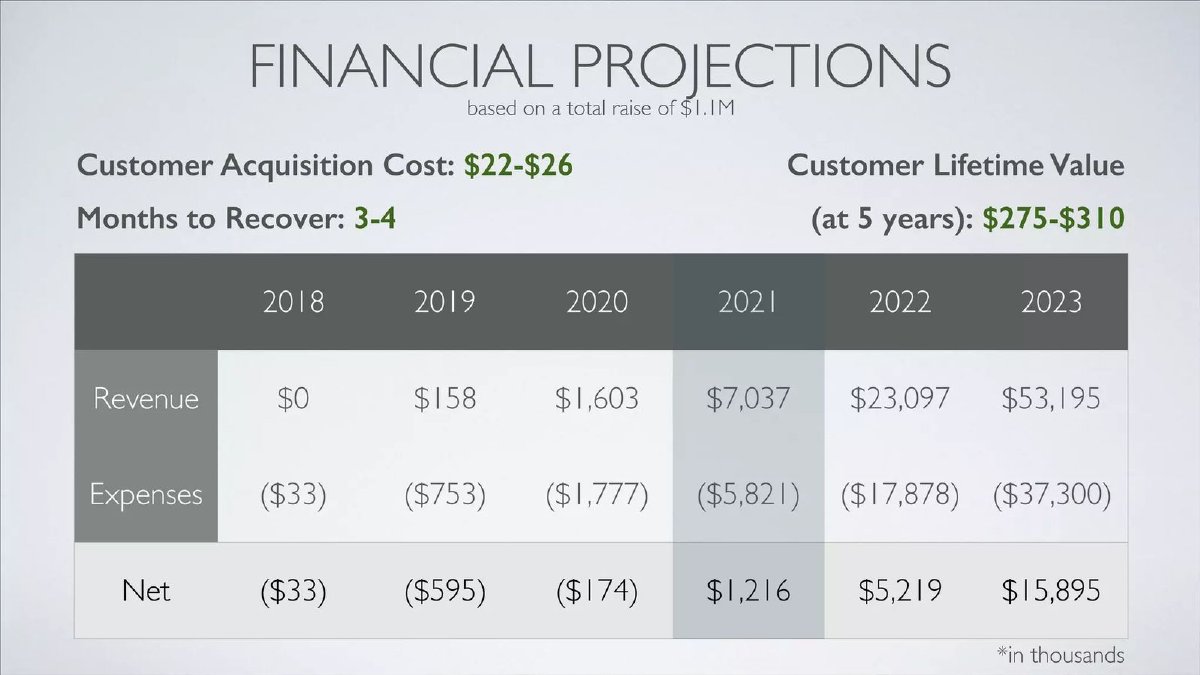
The slide is titled Financial Projections, "based on a total raise of $1.1M", with 2018 revenue of $0; every figure is a forecast.
Uniscen deck, slide 14. Exact stored slide matched to this analysis.
Our analysis: It is a planned payback, shown before any customers, next to the model it comes from. It shows how forecast payback should be read: as an assumption to test.
Evidence and limitation: Recovering $22–$26 in 3–4 months implies about $5.50–$8.67 a month per customer, but $275–$310 over five years is about $4.58–$5.17 a month (our arithmetic). The two ranges can't use the same monthly figure unless churn or margin differ, and the slide doesn't say which.
What a founder can adapt: Label forecast payback as a forecast and show the monthly profit per customer it assumes.
Supporting analysis
What the deck claims: "Customer Acquisition Cost: $22-$26." "Months to Recover: 3-4." "Customer Lifetime Value (at 5 years): $275-$310." Revenue 2018–2023 (in thousands): $0, $158, $1,603, $7,037, $23,097, $53,195; net ($33), ($595), ($174), $1,216, $5,219, $15,895.
Presentation choice: It is a planned payback, shown before any customers, next to the model it comes from. It shows how forecast payback should be read: as an assumption to test.
When it does not fit: Recovering $22–$26 in 3–4 months implies about $5.50–$8.67 a month per customer, but $275–$310 over five years is about $4.58–$5.17 a month (our arithmetic). The two ranges can't use the same monthly figure unless churn or margin differ, and the slide doesn't say which.
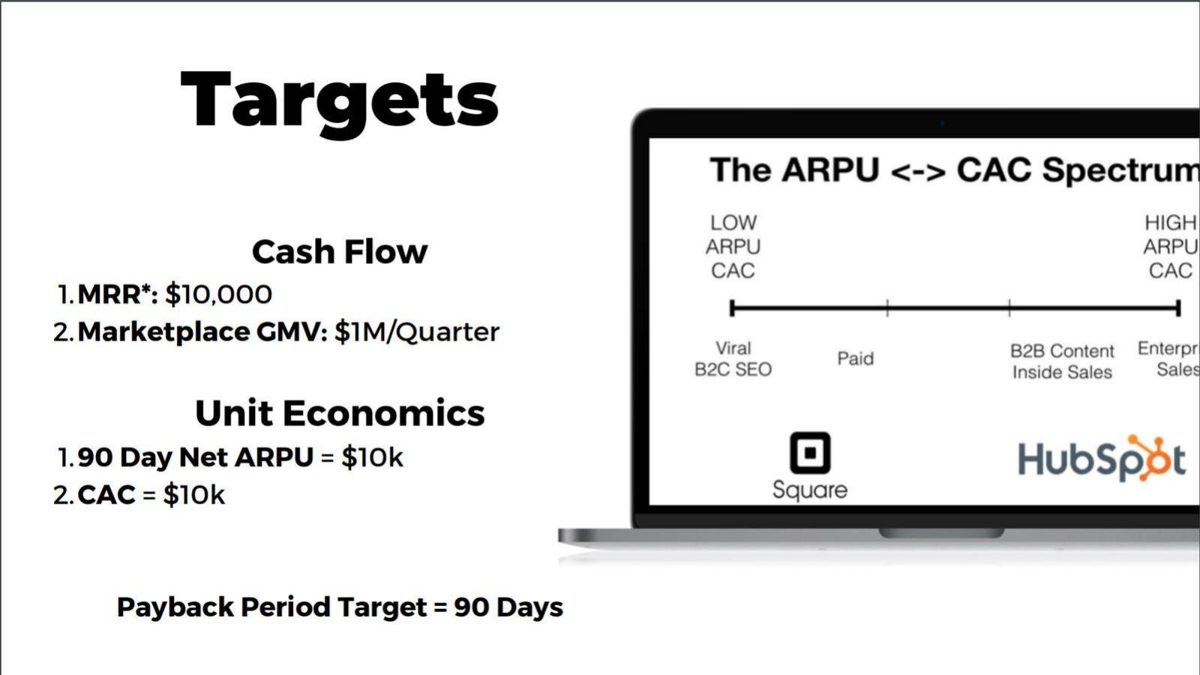
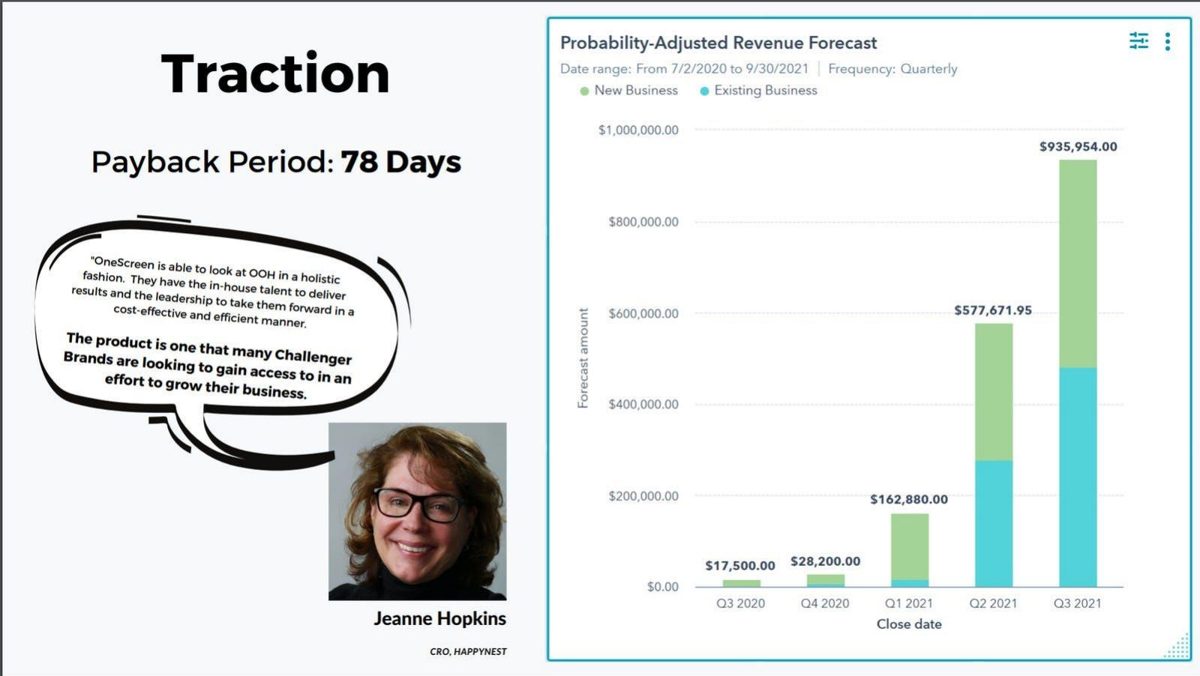
Out-of-home advertising marketplace. Slide 13 is titled Targets; slide 14 is titled Traction. The revenue chart on slide 14 covers 7/2/2020 to 9/30/2021.
OneScreen.ai deck, slide 13. Exact stored slide matched to this analysis.OneScreen.ai deck, slide 14. Exact stored slide matched to this analysis.
Our analysis: The target is defined by its inputs: net revenue per customer in 90 days equals CAC. That makes the target easy to check and easy to report against.
Evidence and limitation: The 78-day figure appears without CAC or ARPU, sits next to a probability-adjusted forecast rather than booked revenue, and 'net' is not defined, so a reader can't tell how it was measured.
What a founder can adapt: Report the actual payback with the same inputs you used to set the target.
Supporting analysis
What the deck claims: Slide 13: "Unit Economics 1. 90 Day Net ARPU = $10k 2. CAC = $10k." "Payback Period Target = 90 Days." Slide 14: "Payback Period: 78 Days" beside a "Probability-Adjusted Revenue Forecast" (Q3 2020 $17,500 to Q3 2021 $935,954) and a customer quote.
Presentation choice: The target is defined by its inputs: net revenue per customer in 90 days equals CAC. That makes the target easy to check and easy to report against.
When it does not fit: The 78-day figure appears without CAC or ARPU, sits next to a probability-adjusted forecast rather than booked revenue, and 'net' is not defined, so a reader can't tell how it was measured.
After: Blended CAC $48 (last 6 months). Gross-profit LTV $190 over 24 months, so LTV:CAC is 4x. Payback in 5 months, down from 9 after annual plans launched.
What improved: Our illustrative rewrite; the figures are invented. It gives both inputs, the basis, the window, payback and the driver.
What this guide adds
The financials guide covers projections; the business model guide covers how you charge; the SaaS traction guide covers revenue growth. This guide covers only customer-level economics: what a customer costs and what they return.
When your LTV and CAC come from a financial model
Many early decks take LTV and CAC from a forecast rather than from customers already won. That is fine if the slide says so and shows enough for a reader to redo the sums. Plantt's slide 38 (below) is a useful case: it lists its inputs, and most of its figures can be recomputed from them.
Show each formula's inputs next to the result. Plantt's B2B CAC is total sales and marketing ($10.5M) × share spent on new customers (90%) × share of that aimed at business customers (70%) = $6,615,000, divided by 876 new garden centres = $7,551.37. Its B2C CAC works the same way: $10.5M × 90% × 30% ÷ 81,733 customers = $34.69. A reader can check both.
Say which lifetime you actually used. Plantt lists a 90% retention rate for business customers, but its B2B LTV of $45,964.80 is exactly 3 years of yearly gross profit per garden centre ($2.8M × 7.6% online × 9% fee × 80% margin = $15,321.60). The slide does not say how 90% retention became 3 years. If you assume a lifetime, state it; if you derive it from retention, show the step.
Say whether spend was measured or allocated. Plantt's CAC comes from splitting one sales and marketing budget by assumed percentages, not from spend tracked per segment. Label allocated CAC as allocated.
Count your own take, not your customer's revenue. Plantt's B2B value is its fee income from each garden centre, not the garden centre's $2.8M in sales. Make clear which one your LTV measures.
Explain any blended ratio. Plantt shows 6.1 for B2B and 4.8 for B2C, then an overall 5.2 without saying how the two were combined. Give the weighting, or show only the segment ratios.
Label the date and scenario. Plantt's figures are year 4 (2022) of a September 2019 base case, a forecast, and the slide says so. Keep modelled figures visibly separate from anything measured.
Payback: show the months, the inputs and the basis
CAC payback is acquisition cost divided by the gross profit one customer brings in each month. It tells an investor how long the cash spent winning a customer stays tied up, and so how much capital growth needs. A payback figure is only usable when the reader can see four things: the inputs, whether it uses gross profit or revenue, whether it is measured or planned, and which customers it covers.
Put the inputs on the slide. Evvnt (below) lists CAC ($177) and gross profit per customer ($58.98 a month), so its 3-month payback can be checked by division. Its LTV, though, is two years of revenue, not gross profit. Keep payback and LTV on the same basis.
Show cohorts when payback is improving. Nas.com plots cumulative return for each monthly cohort against a 100% line. The headline ("<2 months") matches the recent cohorts; the earliest cohorts took far longer. A chart like this is more convincing than a single average, but it still needs to say what "return" measures.
Label forecast payback as a forecast. Uniscen's "Months to Recover: 3–4" sits on a projections slide with zero revenue in the first year. That is fine, but the monthly profit it implies should agree with the lifetime value beside it, and on Uniscen's slide the two ranges don't obviously match.
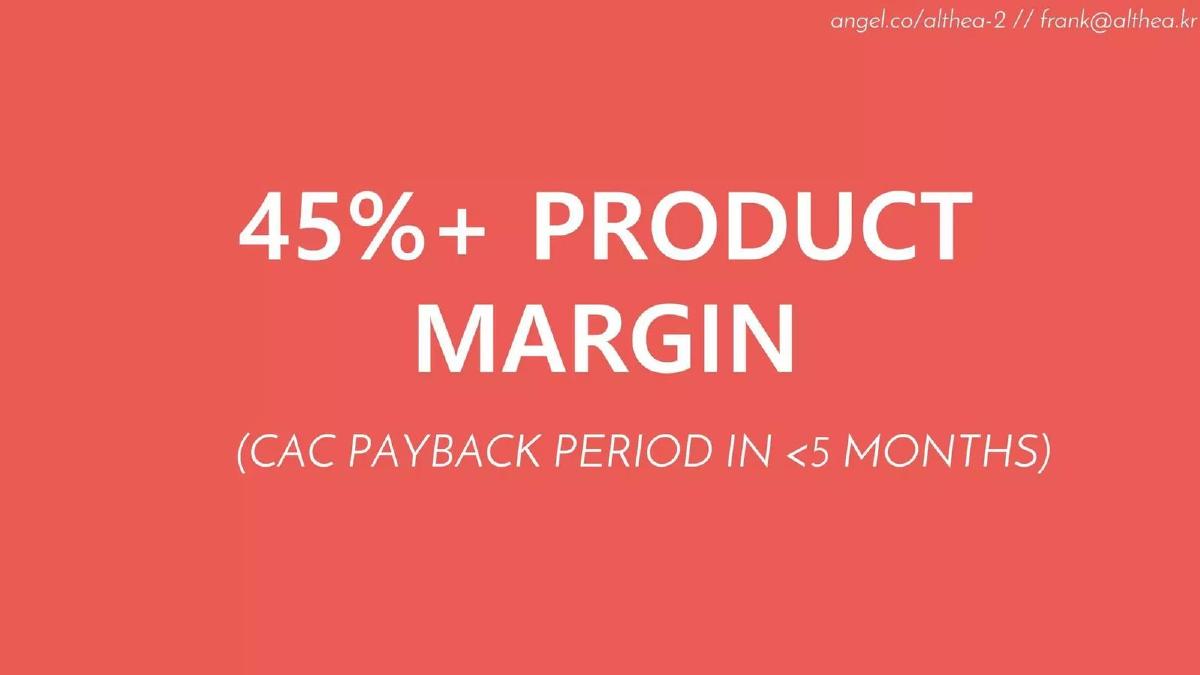
Report actual payback the way you set the target. OneScreen.ai defines its 90-day target by its inputs (90-day net revenue per customer equals CAC), then reports 78 days on its traction slide with no inputs. Althea's "CAC payback period in <5 months" (below) gives a product margin but not whether payback uses it. If you only have room for the headline, footnote the CAC period, the margin used and the customers included.
Don't confuse CAC payback with investor or project payback. Years until a store, a plant or an investor's money is repaid is a different measure; label which one you mean.
Common mistakes
Ratio without inputs. Give LTV and CAC in dollars.
Revenue-based LTV. Use gross profit.
No time window. Cap LTV at a stated number of months or years.
Paid-only CAC shown as blended. Say which it is.
Targets shown as results. Separate measured from expected.
Figures that can't be recomputed. Show the inputs, and say which lifetime and which cost split you used.
Diagnostic checklist
LTV and CAC are given as values.
LTV is based on gross profit over a stated window.
CAC says blended or paid.
Payback period is shown, with CAC and monthly gross profit per customer, and labelled measured or forecast.
Measured figures are separated from targets.
Modelled LTV and CAC show their inputs, the lifetime used and the scenario date.
Frequently asked questions
How we chose these examples
Corpus: published pitch deck teardowns on StartupFundraising.com. Founder-uploaded private decks are excluded.
Selection (2026-09-24): we searched extracted text of slides 2–6 for LTV, CAC, lifetime value and payback (59 decks), narrowed to slides about unit economics (about 22), and inspected ten. We excluded slides where every figure was redacted or a placeholder with no method (Arist, Empowerly, Faye) and one that repeated another's content. Slides from these decks used in other guides are different slide numbers.
Overlap check: financials, business model and SaaS traction guides don't cover customer-level LTV, CAC or payback as their subject.
Review: all seven stored slide images were inspected on 2026-09-24 and matched to company, deck and slide number (editorial model review). No person has yet completed an editorial review of this page.
Plantt slide 38 added 2026-09-28: the stored image was rendered from the original deck file (hash-checked, 43 pages) and every figure quoted was checked against the image; the CAC and LTV arithmetic is ours (editorial model review).
Payback section added 2026-09-29: the completed research index was searched for payback, months to recover and CAC payback wording. Evvnt p10, Nas.com p21, Uniscen p14 and OneScreen.ai p13-14 were rendered from hash-checked original public deck files and every quoted figure was checked against the image; the arithmetic and chart readings are ours (editorial model review). Inspected and not used: Signal AI p21 (its own values are covered in the stored image), Mathison p17 (a headline payback without basis, the same lesson as Althea), Veremark p15 (segment payback with the CAC and contract-value cells blank), Rippling p10 (an illustrative cash-on-cash metric). These four examples each cover a different form of payback: inputs shown, a cohort chart, a forecast, and a target versus a reported actual.
Figures are as shown on the slides. We make no claim that any slide caused a fundraising outcome.