Gross Margin in a Pitch Deck: Which Margin to Show, 12 Real
How to state a margin on a pitch deck traction slide: gross, contribution or EBITDA margin, on which revenue, for which period.
Gross Margin in a Pitch Deck: Say Which Margin, on Which Revenue, for Which Period
Early traction slides often put a margin beside revenue: "60% gross margins", "85% margins", "38.7% contribution margin". The word "margin" covers several different measures, and the figure depends on which costs are subtracted, which revenue it is divided by, and over what period. This guide compares twelve real slides on those points.
TL;DR
Name the margin, the revenue it is measured on, and the period. Everphone comes closest, naming type and scope: "Contribution margin 38.7% across the portfolio", and says it covers the whole portfolio. Fuelfinance gives a different measure with a year: "22% EBITDA margin in 2021". Glambot, Cirrus Identity, CloudCoffer and 100Plus at least say "gross". Buffer's "97% margins", Sickweather's "85% margins" and Sourceeasy's "45% margins" don't say which margin they mean, so a reader can't compare them with each other or with a gross margin benchmark. Up All Night's "20%+ gross margins" blends two revenue types (subscriptions and sales) whose margins are likely very different.
Margin claims on real pitch deck slides
Each example shows the exact stored slide above its analysis and links to the full teardown. Most fully defined first. Figures are quoted as shown; calculations are ours.
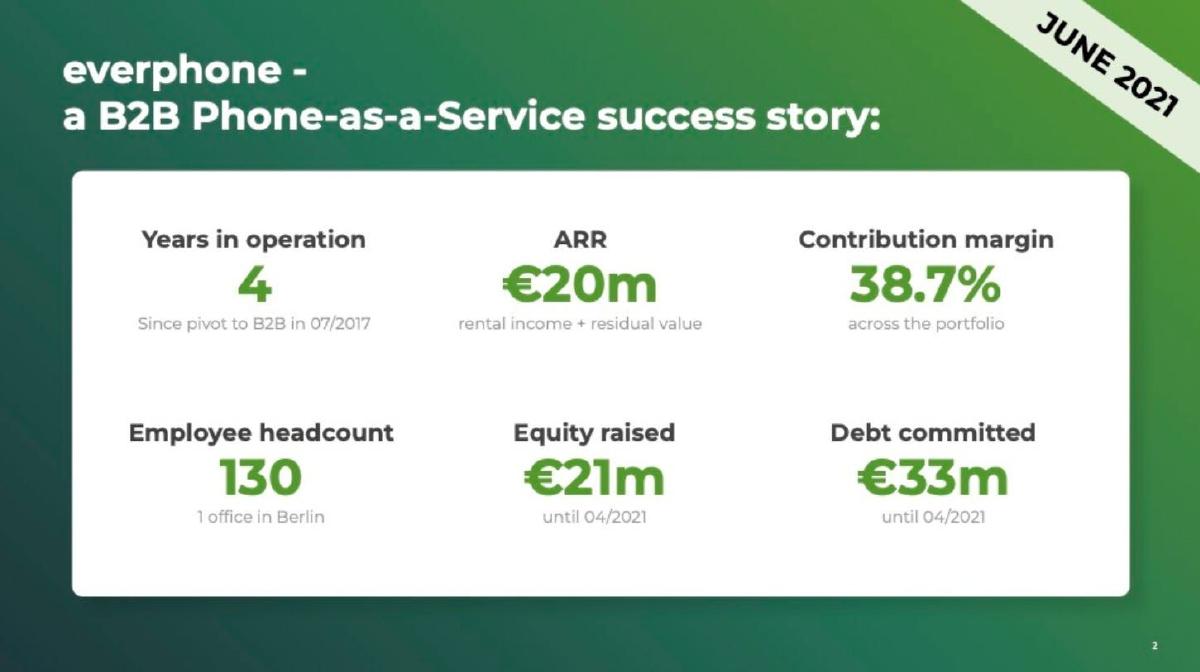
Everphone traction slide — slide 2
Phones as a service for businesses, Series C. A six-figure summary dated "June 2021".
Everphone deck, slide 2. Exact stored slide matched to this analysis.
Our analysis: The most fully labelled margin in this set: type and scope are named. The slide defines ARR separately; it does not say that ARR is the revenue the margin is divided by, or which period the margin covers.
Evidence and limitation: The margin type (contribution) and scope ("across the portfolio") are stated, and the slide is dated. ARR is defined as including residual value, meaning what devices are expected to be worth at the end of a lease, so it isn't purely recurring rental revenue. The slide doesn't say which variable costs the contribution margin subtracts.
What a founder can adapt: Name the margin, its scope, the revenue it is divided by and its period, and add one line on which costs it subtracts.
Supporting analysis
What the deck claims: "Years in operation 4 (since pivot to B2B in 07/2017)." "ARR €20m, rental income + residual value." "Contribution margin 38.7%, across the portfolio." Also headcount 130, equity raised €21m and debt committed €33m (until 04/2021).
Presentation choice: For a hardware-rental business, contribution margin across the device portfolio is more informative than gross margin on any one device, and the scope label tells the reader it is an aggregate.
When it does not fit: Don't compare a contribution margin with another company's gross margin.
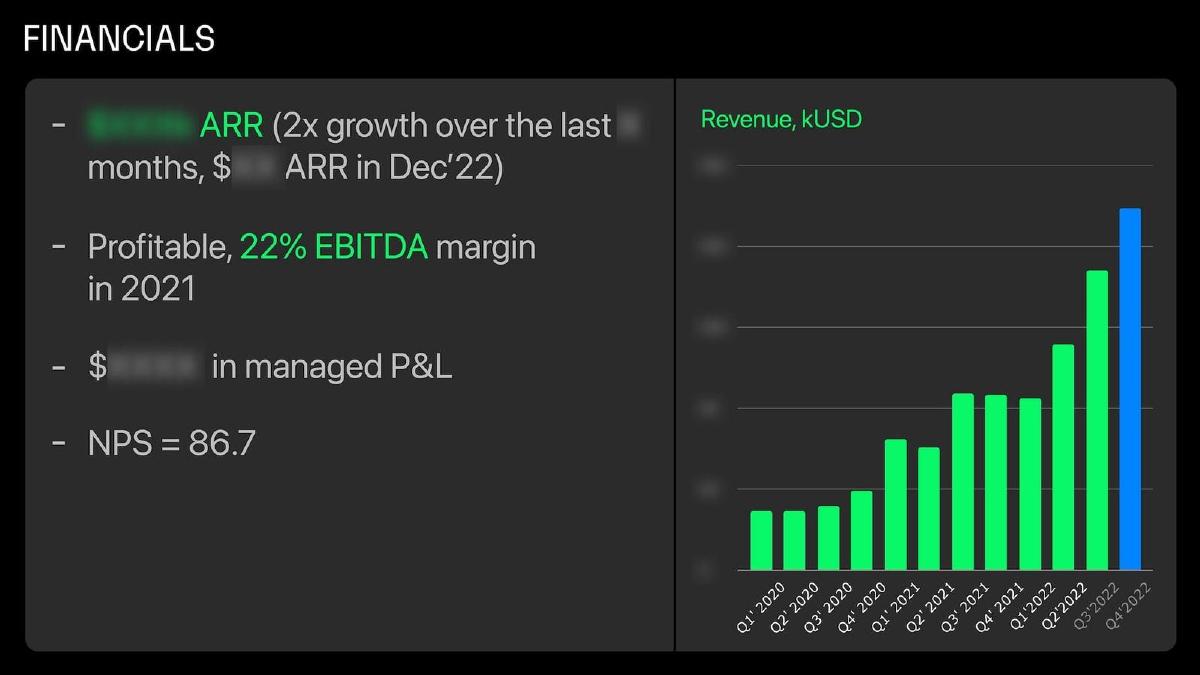
Outsourced finance for startups, seed. A "Financials" slide with a quarterly revenue chart; several values are blurred in this copy.
Fuelfinance deck, slide 5. Exact stored slide matched to this analysis.
Our analysis: A clearly labelled profitability margin, from an earlier year than the other figures.
Evidence and limitation: The margin type (EBITDA) and year are stated. The 2021 margin is a year earlier than the Dec'22 ARR, so it describes an earlier period. The chart's axis values are blurred, and the different colour on Q4 2022 isn't explained on the slide (it may mark a partial or forecast quarter).
What a founder can adapt: If you show EBITDA margin, say so and give the year; add gross margin separately if unit profitability matters to your story.
Supporting analysis
What the deck claims: "ARR (2x growth over the last [blurred] months, $[blurred] ARR in Dec'22)." "Profitable, 22% EBITDA margin in 2021." "NPS = 86.7." Chart "Revenue, kUSD", Q1 2020 to Q4 2022, with the last bar in a different colour.
Presentation choice: An EBITDA margin answers a different question from gross margin: whether the whole company covered its operating costs, not whether each sale is profitable.
When it does not fit: Don't set a margin from one year beside growth from a later period without making the difference obvious.
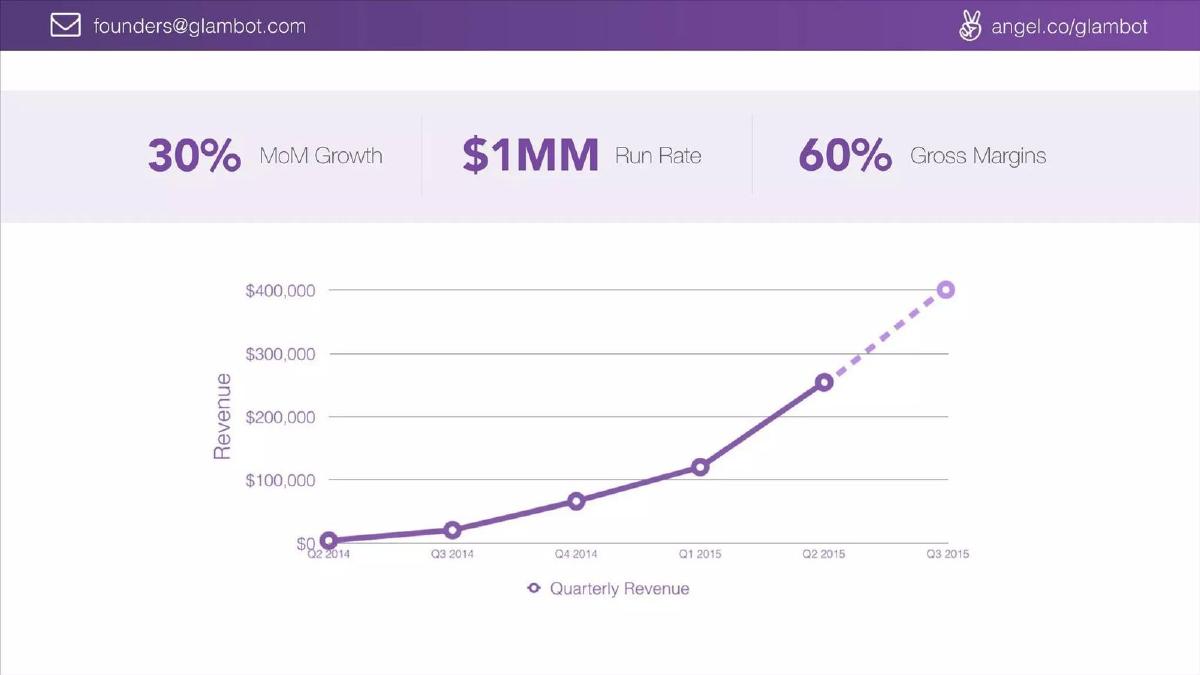
Online beauty retailer, seed. Three figures over a quarterly revenue chart.
Glambot deck, slide 6. Exact stored slide matched to this analysis.
Our analysis: Gross margin named; period and revenue scope not stated.
Evidence and limitation: The margin is labelled gross. The slide doesn't say over which period or whether it is on product sales only. The dashed final segment suggests Q3 2015 is projected, though no legend says so.
What a founder can adapt: "60% gross margin, [period], after discounts and returns" answers the obvious follow-up.
Supporting analysis
What the deck claims: "30% MoM Growth." "$1MM Run Rate." "60% Gross Margins." Chart "Quarterly Revenue", Q2 2014 to Q3 2015; the Q3 2015 segment is dashed, ending at about $400,000.
Presentation choice: For a retailer, 60% gross margin is a claim about product cost and pricing; readers will want to know whether it holds after discounts and returns.
When it does not fit: Don't leave a projected segment unlabelled on the chart beside your metrics.
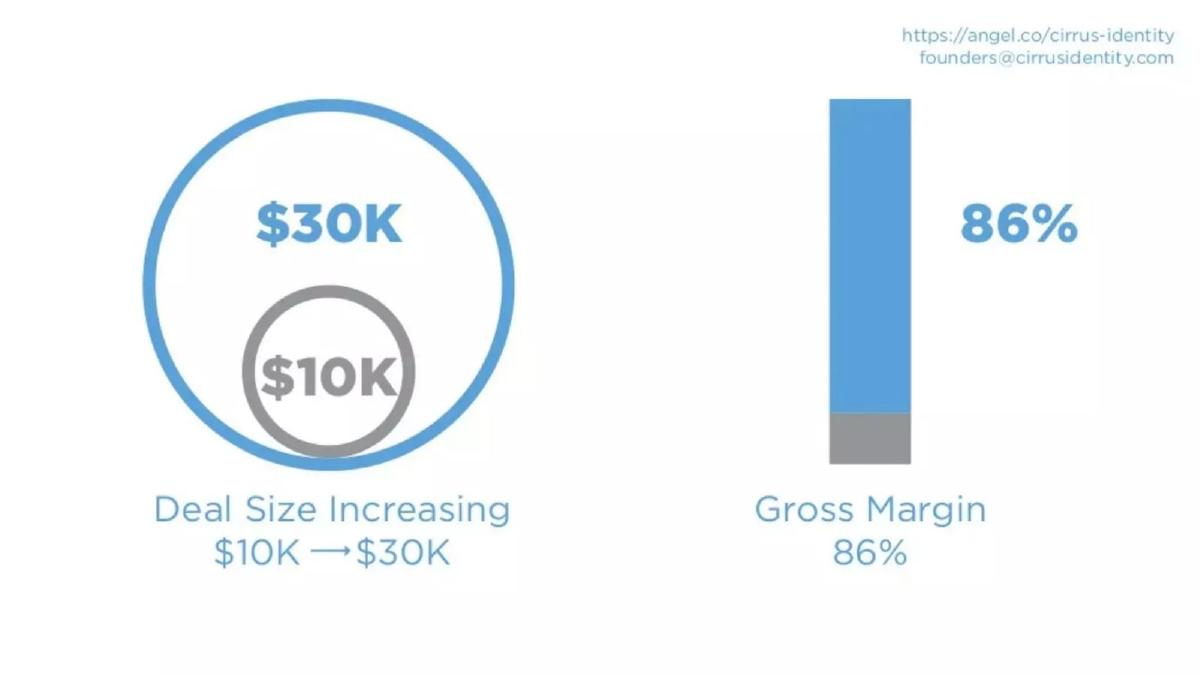
Cirrus Identity deck, slide 6. Exact stored slide matched to this analysis.
Our analysis: A labelled gross margin beside an undated deal-size trend.
Evidence and limitation: Gross margin is named. The period, and whether it includes services or implementation revenue, aren't stated. The deal-size change has no dates.
What a founder can adapt: State the period and whether services are included, or show software and services margins separately.
Supporting analysis
What the deck claims: "Deal Size Increasing $10K → $30K." "Gross Margin 86%", shown as a bar.
Presentation choice: Software with implementation work often has a lower margin on services; a reader will want to know whether 86% covers both.
When it does not fit: Don't imply a trend ("increasing") without dates.
Enterprise data security, seed. Three figures in a band.
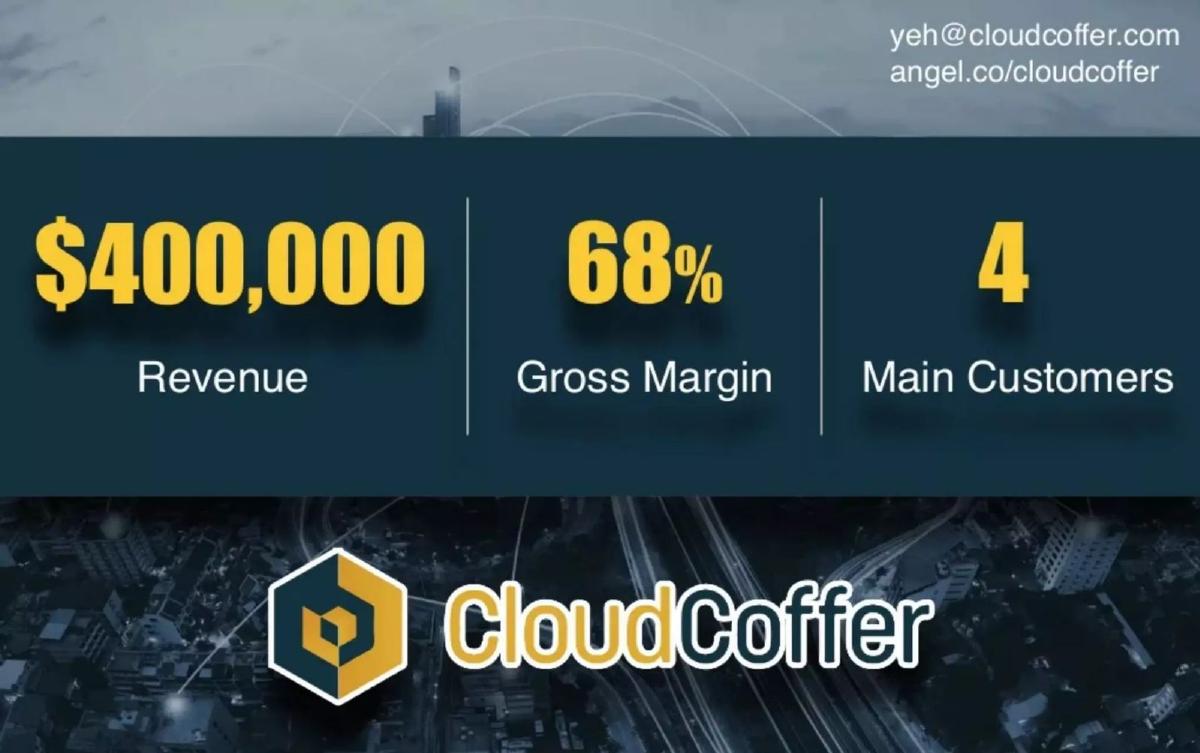
CloudCoffer deck, slide 6. Exact stored slide matched to this analysis.
Our analysis: A named gross margin with no period, beside a small customer base.
Evidence and limitation: Gross margin is named, but no period is given for either revenue or margin. With four main customers, the margin may depend heavily on a few contracts.
What a founder can adapt: Add the period ("FY[year]") and, if relevant, how concentrated revenue is.
Supporting analysis
What the deck claims: "$400,000 Revenue." "68% Gross Margin." "4 Main Customers."
Presentation choice: Putting the customer count next to the margin is useful context: a margin from four customers may change as the mix changes.
When it does not fit: Don't present a margin from a few contracts as a stable business characteristic.
Remote patient monitoring. A dense company overview with charts and a financials table.
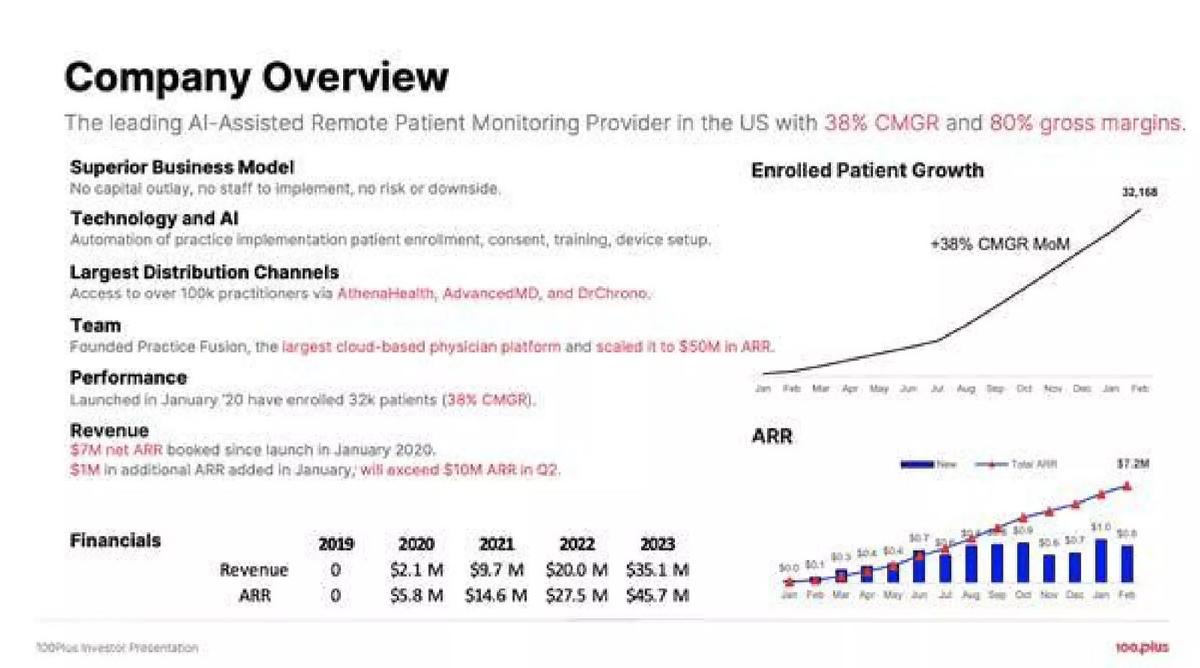
100Plus deck, slide 2. Exact stored slide matched to this analysis.
Our analysis: A gross margin stated once, next to a table that mixes actual and likely projected years without labels.
Evidence and limitation: The margin is labelled gross, but no period is given. The table runs to 2023 while the text refers to activity since January 2020, so later columns are presumably projections, though the table doesn't mark them. Revenue and ARR differ a lot in each year (for example $2.1M vs $5.8M in 2020), which the slide doesn't explain.
What a founder can adapt: Mark actual and forecast columns, and give the period of the gross margin.
Supporting analysis
What the deck claims: Subtitle: "38% CMGR and 80% gross margins." Financials table: revenue 2019 $0, 2020 $2.1M, 2021 $9.7M, 2022 $20.0M, 2023 $35.1M; ARR 2020 $5.8M rising to $45.7M in 2023. Text: "Launched in January '20", "$7M net ARR booked since launch".
Presentation choice: When actuals and forecasts sit in one table, a reader can't tell whether the 80% is achieved or planned.
When it does not fit: Don't leave forecast years unlabelled next to an achieved-sounding margin.
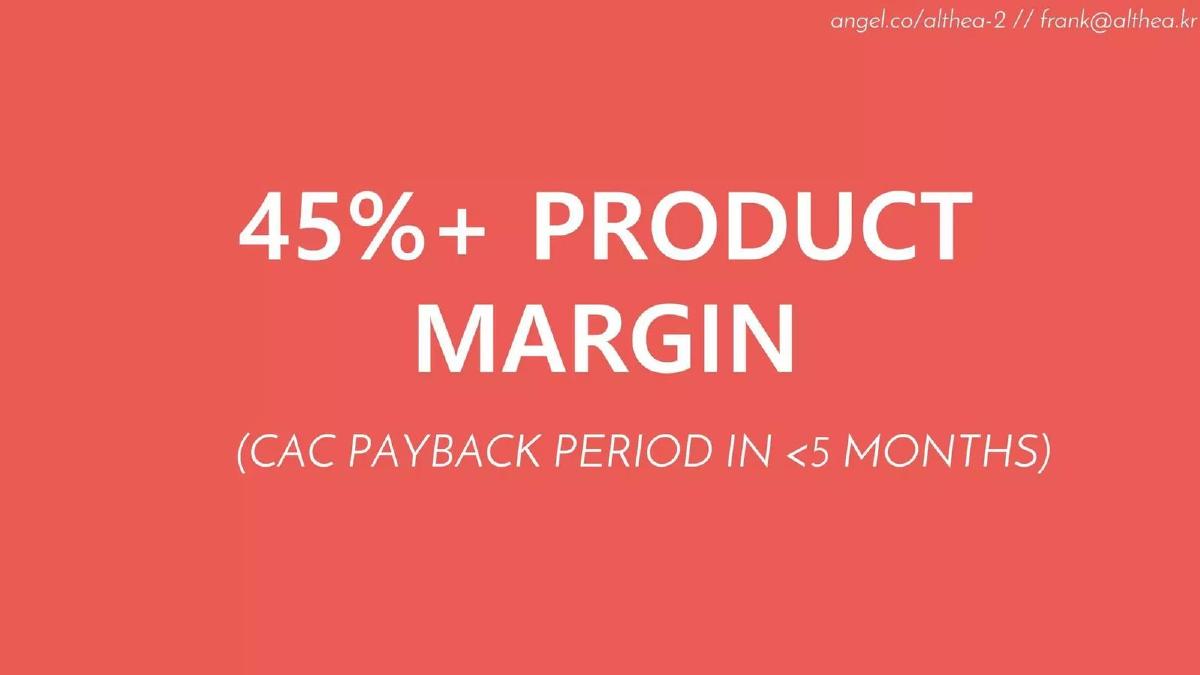
Althea deck, slide 5. Exact stored slide matched to this analysis.
Our analysis: A margin under a non-standard name, tied to a payback claim.
Evidence and limitation: "Product margin" isn't a standard term; it may mean gross margin on products, or margin after some fulfilment costs. "45%+" is a lower bound. No period is given. Linking margin to CAC payback is useful, since payback is usually calculated on gross profit, but the calculation isn't shown.
What a founder can adapt: Say "gross margin" (or define product margin) and show the payback calculation: CAC ÷ (monthly revenue per customer × gross margin).
Supporting analysis
What the deck claims: "45%+ Product Margin (CAC payback period in <5 months)."
Presentation choice: The link to payback shows why margin matters, but the reader can't check it without knowing what the margin includes.
When it does not fit: Don't use a custom margin name without defining it.
Nightlife events, seed. "In 1 year in 1 market." Three figures over a crowd photo.
Up All Night deck, slide 5. Exact stored slide matched to this analysis.
Our analysis: A blended margin across two revenue types.
Evidence and limitation: Gross margin is named, but it is a single blended figure across subscriptions and sales, which likely have different costs. It is a lower bound, and "increasing" has no data shown. The one-year period covers the revenue; the slide doesn't say whether the margin is for the same year.
What a founder can adapt: Show the margin for each revenue type, or the revenue mix beside the blended figure.
Supporting analysis
What the deck claims: "$600,000 from subscriptions and sales." "25% month over month growth in revenue." "20%+ Gross margins and increasing."
Presentation choice: If subscriptions carry a high margin and event sales a low one, a blended 20% says little about either, and will move as the mix shifts.
When it does not fit: Don't claim a margin is increasing without showing at least two periods.
SEO software, Series B. A five-year revenue and visits chart with callouts.
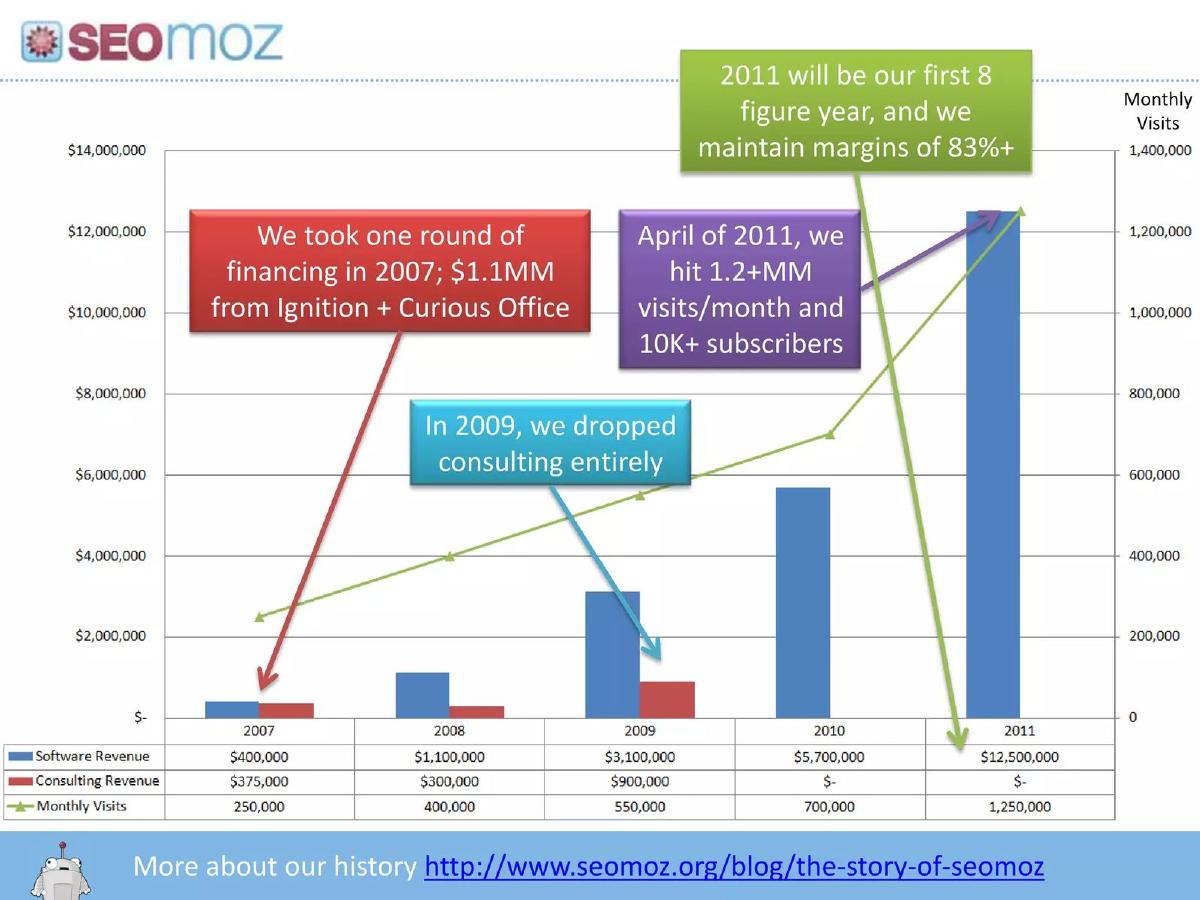
Moz deck, slide 3. Exact stored slide matched to this analysis.
Our analysis: A clear revenue split, with an unnamed margin tied to a partly forecast year.
Evidence and limitation: The callout's "will be" and the April 2011 reference suggest the 2011 revenue is at least partly a forecast. The margin type isn't named, and the slide doesn't say whether 83% is a past figure or expected for 2011. Separating software from consulting revenue is useful: consulting typically carries lower margins, and it disappears from 2010.
What a founder can adapt: "[Margin type] margin [X]%, [period, actual or forecast], [revenue scope]" (bracketed values are placeholders; the slide does not state the type or year), and mark 2011 as a forecast.
Supporting analysis
What the deck claims: Software revenue 2007 $400,000; 2008 $1,100,000; 2009 $3,100,000; 2010 $5,700,000; 2011 $12,500,000. Consulting revenue $375,000, $300,000, $900,000, then none. Callouts: "In 2009, we dropped consulting entirely"; "April of 2011, we hit 1.2+MM visits/month and 10K+ subscribers"; "2011 will be our first 8 figure year, and we maintain margins of 83%+."
Presentation choice: Showing consulting revenue fall to zero helps a reader understand why the margin can be high, but the margin itself needs a type and a period.
When it does not fit: Don't attach a margin to a forecast year without saying which.
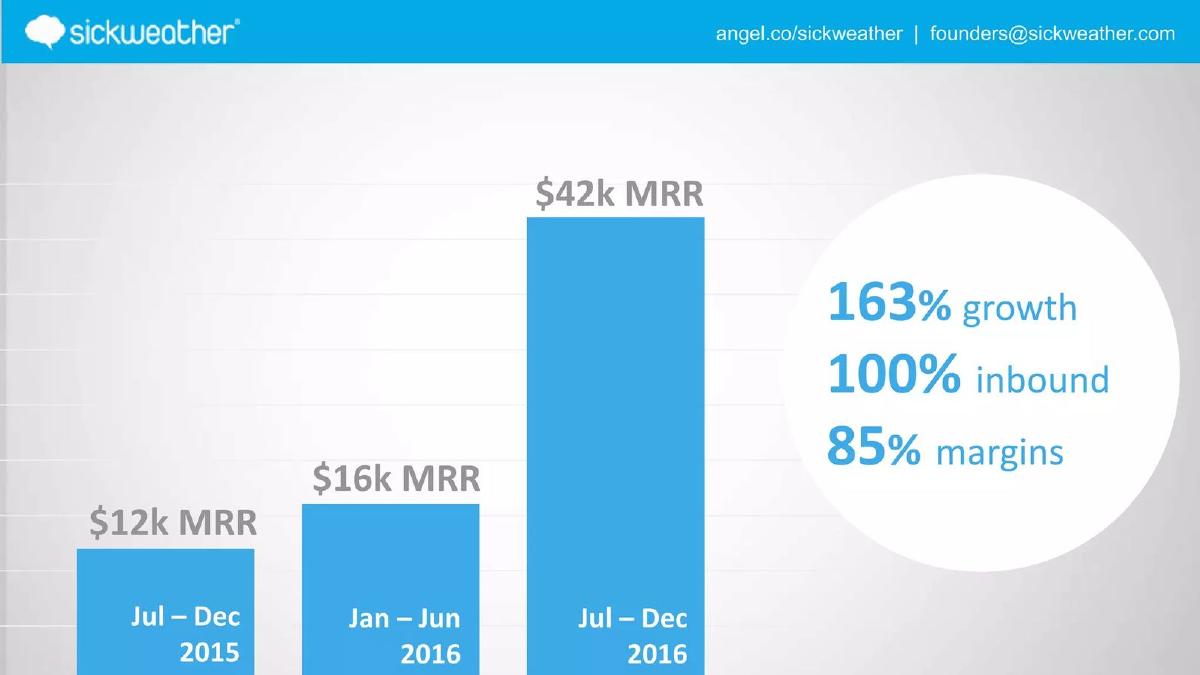
Illness-tracking data. MRR bars for three half-years with three figures in a circle.
Sickweather deck, slide 4. Exact stored slide matched to this analysis.
Our analysis: A checkable growth figure beside an unnamed margin.
Evidence and limitation: The growth figure matches the last two bars: $42k ÷ $16k − 1 ≈ 162.5%. The margin type and period aren't given. The slide also doesn't say whether each bar is the MRR at the end of the half-year or an average across it.
What a founder can adapt: "85% gross margin, Jul–Dec 2016."
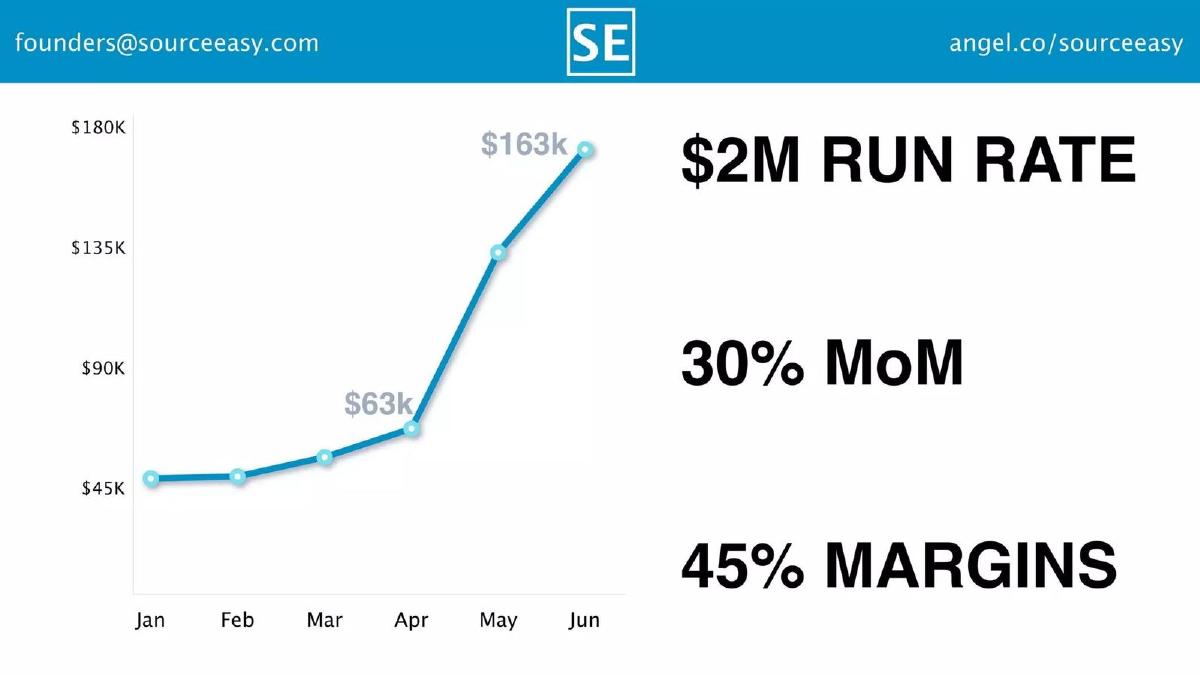
Apparel sourcing and manufacturing, seed. A monthly line chart with three figures.
Sourceeasy deck, slide 2. Exact stored slide matched to this analysis.
Our analysis: A margin whose revenue base matters a lot for this business model, and isn't stated.
Evidence and limitation: If the chart shows monthly revenue, $163k × 12 ≈ $1.96M, consistent with "$2M run rate"; the chart doesn't label its measure. For a sourcing business, margin could be on the full order value customers pay or on Sourceeasy's own net revenue; the slide says neither, nor the margin type.
What a founder can adapt: Say whether revenue is gross order value or net, and which margin: "45% gross margin on net revenue".
Supporting analysis
What the deck claims: Chart Jan to Jun, y-axis $45K–$180K, labelled points "$63k" (Apr) and "$163k" (Jun). "$2M run rate." "30% MoM." "45% margins."
Presentation choice: A 45% margin on full order value would be unusually high for manufacturing; 45% of a smaller net revenue figure is a different claim.
When it does not fit: Don't leave the revenue base unstated when you resell physical goods.
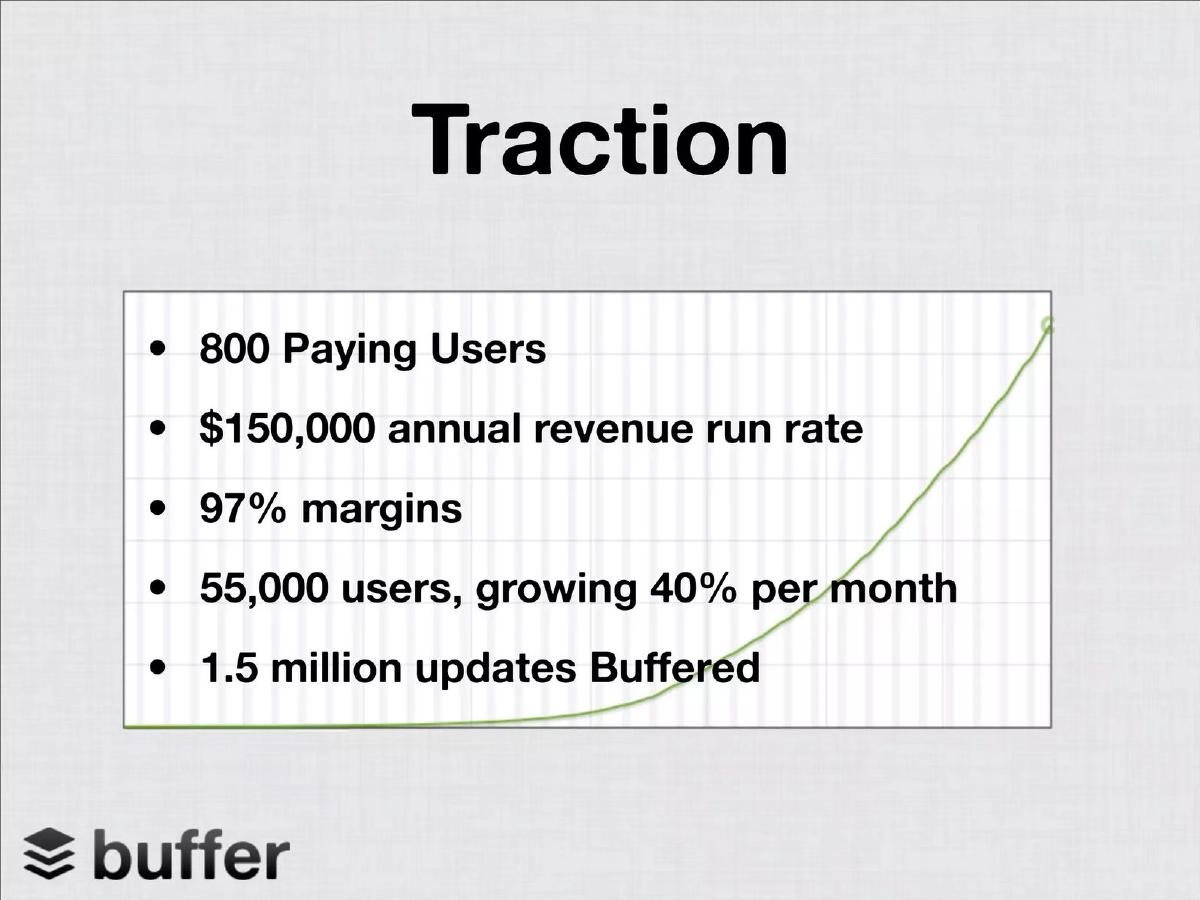
Social media scheduling software, seed. A "Traction" slide with five bullets over an upward line.
Buffer deck, slide 5. Exact stored slide matched to this analysis.
Our analysis: The best-known example of the unlabelled "margins" bullet.
Evidence and limitation: The margin type isn't stated. A 97% figure is plausible as a software gross margin at small scale, but would be unusual as an operating margin for a company paying salaries; the slide doesn't say which. The background line has no axis.
What a founder can adapt: State the margin type, costs and period. If the 97% is a gross margin: "97% gross margin, [period]; cost of revenue = [costs]". The slide does not say which margin it is.
Supporting analysis
What the deck claims: "800 Paying Users." "$150,000 annual revenue run rate." "97% margins." "55,000 users, growing 40% per month." "1.5 million updates Buffered."
Presentation choice: Everything else on the slide is concrete and countable, which makes the one undefined figure stand out.
When it does not fit: Don't let a reader guess whether 97% is gross or operating margin.
Whether each slide names the margin, its revenue base and its period.
Example
Claim
Margin type
Revenue base
Period
Main gap
Everphone
38.7%
Contribution
Portfolio (denominator not stated)
Not stated (slide dated June 2021)
Costs subtracted
Fuelfinance
22%
EBITDA
Not stated
2021
Earlier year than ARR
Glambot
60%
Gross
Not stated
Not stated
Period; returns/discounts
Cirrus Identity
86%
Gross
Not stated
Not stated
Services included?
CloudCoffer
68%
Gross
Not stated
Not stated
Period; 4 customers
100Plus
80%
Gross
Not stated
Not stated
Actual vs forecast table
Althea
45%+
"Product" (undefined)
Not stated
Not stated
Definition
Up All Night
20%+
Gross, blended
Subscriptions + sales
Not stated
Mix of two businesses
Moz
83%+
Not stated
Not stated (consulting dropped)
Not stated (beside partly forecast 2011)
Type; actual or forecast
Sickweather
85%
Not stated
Not stated
Not stated
Type and period
Sourceeasy
45%
Not stated
Not stated (GOV or net?)
Not stated
Revenue base
Buffer
97%
Not stated
Not stated
Not stated
Gross or operating?
Key Takeaways
Say which margin: gross (after direct costs), contribution (after variable costs), or EBITDA (after operating costs). Gross and contribution margin classify costs differently, so neither is automatically the lower figure.
Say which revenue: net revenue, not gross order value or bookings, unless you say so.
Give the period: a quarter, a year, or the latest month.
If you sell more than one thing, show the margin by revenue type or say it is blended.
"Margins" alone is ambiguous; a gross margin of 85% and an EBITDA margin of 85% describe very different companies.
A margin in a forecast year is a forecast; label it.
Write your margin line
Fill in each line before putting a margin on a slide.
Margin type. Gross, contribution or EBITDA. Use the standard name.
Costs included. Gross: hosting, support, third-party software, product cost. Contribution: costs that vary with volume (for example payment fees, shipping, commissions), excluding fixed costs. List yours.
Revenue base. Net revenue, or gross order value / GMV. If you resell goods or run a marketplace, say which.
Period. Quarter, year or latest month; and whether actual or forecast.
Mix. If you have more than one revenue type, give each margin or the revenue mix.
Check. Gross margin = (revenue − cost of goods sold) ÷ revenue. Recompute from your P&L for the stated period.
Copyable framework: [X]% [gross / contribution / EBITDA] margin on [net revenue / GMV], [period, actual or forecast]; [costs included].
Illustrative example 1 — written by us
Before: 97% margins
After: [X]% gross margin on net revenue, [period]; cost of revenue = [hosting, payment processing].
What improved: Our illustrative rewrite; not Buffer's wording. Bracketed values are placeholders. It names the margin, base, period and costs, so the figure can be compared.
What this guide adds
The unit economics guide covers CAC, payback and lifetime value, where gross margin is one input. The financials guide covers forecasts and the P&L. Neither explains how to label a single margin figure on a traction slide so a reader knows what it measures. This page covers that question.
Three margins that are often confused
Gross margin = (revenue − cost of goods sold) ÷ revenue. For software, cost of goods sold usually includes hosting, third-party software in the product and customer support; for physical goods, the product and manufacturing cost. Companies draw the line differently, so say what is included.
Contribution margin = (revenue − variable costs) ÷ revenue. It classifies costs by behaviour: it subtracts costs that vary with volume, which can include items outside cost of goods sold such as payment fees, shipping or sales commissions. Cost of goods sold, in turn, can include fixed production costs that contribution margin leaves out. Which figure is higher depends on the costs each includes and the definitions used, so state yours.
EBITDA margin = earnings before interest, tax, depreciation and amortisation ÷ revenue. It subtracts operating costs such as salaries and marketing, so it can be negative for a growing startup with a high gross margin.
The denominator matters as much as the costs. A marketplace or sourcing business can report margin on gross order value (the full amount customers pay) or on its own net revenue. A 20% margin on gross order value and a 20% margin on net revenue are very different figures. (Corporate Finance Institute, Corporate Finance Institute, Corporate Finance Institute)
How we read each slide
We quote figures as shown. Where a slide doesn't name the margin, the revenue base or the period, we say so. Arithmetic uses only visible numbers. An unlabelled margin isn't necessarily wrong; the reader just can't tell what it measures.
Common mistakes
"Margins" with no type. Gross, contribution and EBITDA margins can differ by tens of points.
Unstated revenue base. Margin on gross order value and on net revenue are different claims.
Blended margin across businesses. Show each revenue type or the mix.
Forecast shown as achieved. Label forecast years and forecast margins.
Custom margin names. "Product margin" needs a definition.
Mismatched periods. A margin from one year beside growth from another should be marked.
Diagnostic checklist
Margin type named (gross, contribution, EBITDA).
Costs included listed briefly.
Revenue base stated (net revenue or GMV).
Period stated; forecast labelled.
Margin by revenue type, or mix shown, if more than one.
Consistent with the P&L for the same period.
Frequently asked questions
How we chose these examples
Corpus: published pitch deck teardowns on StartupFundraising.com. Founder-uploaded private decks are excluded.
Selection (2026-09-25): we searched stored slide text on slides 2–8 for gross margin, contribution margin and margin(s) with a percentage, excluding market-size, industry-margin and disclaimer slides, kept only slides with a stored slide image, and inspected sixteen candidate images. We kept company margin claims that each show a different choice of margin type, revenue base or period. Considered but not used: GlamST p5 (same pattern as Glambot), Apollo p4 (a margin for a predecessor business), Higgins p6 (planned margins by product line, a business model question), and CeIR p5 (bullets closely matching Buffer's slide with different figures; not used because its provenance is unclear).
Figures are quoted as shown in the stored slide images. Calculations are ours and use only visible numbers. Where a chart doesn't label its measure, related arithmetic is conditional.
Periods are quoted from the slides. Deck years and stages from our library index are not used in the analysis.
Review: stored slide text and images were checked on 2026-09-25 and matched to company, deck and slide number (editorial model review). No person has yet completed an editorial review of this page. We make no claim that any slide caused a fundraising outcome.