How marketplaces explain the commission or take rate on their business model slide: who pays, on what, and what is kept. Seven real slides compared.
Marketplace Business Model Slide: Take Rate
Seven marketplace business model slides, shown in full, compare how companies state their commission: who pays it, what it is charged on, and whether the deck shows what the company keeps.
TL;DR
A marketplace business model slide should answer three questions: who pays the commission (buyer, seller or both), what it is a percentage of (the booking, the service cost, the delivery fee), and how much the company keeps after paying the supply side. In the examples below, every company states a rate, from Roxi's 2.5% to Drive's 25%, but only Borzo shows the step from gross revenue to net revenue, and only Borzo adds retention evidence. A single percentage with no base and no payer, like Medico's "% from online payment", leaves the investor to guess.
Marketplace business model slides from real pitch decks
Each example shows the exact stored slide above its analysis and links to the full teardown. Rates are the companies' own claims. Stage and year are given only where the slide states them.
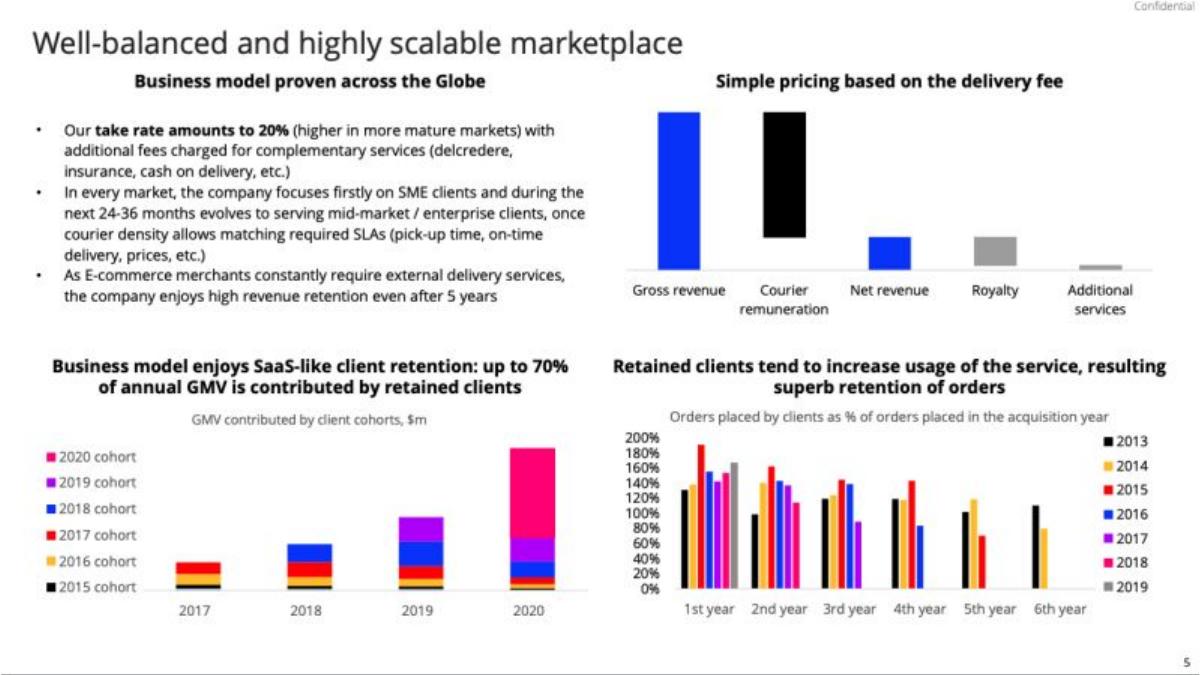
Borzo business model slide — slide 5
Same-day courier delivery marketplace. The slide's charts run to 2020.
Borzo deck, slide 5. Exact stored slide matched to this analysis.
Our analysis: It is the only example that shows what the company keeps after paying couriers, and the only one with evidence that clients keep ordering.
Evidence and limitation: The gross-to-net bars have no values. Label them, or an investor can't read the net margin.
What a founder can adapt: State your take rate, show gross to net in one small chart, and add one retention figure.
Supporting analysis
What the deck claims: "Well-balanced and highly scalable marketplace": a take rate of 20% (higher in more mature markets), with extra fees for services such as insurance and cash on delivery; a bar chart of gross revenue, courier pay, net revenue, royalty and additional services; a cohort chart claiming up to 70% of annual order value comes from retained clients; and a chart of orders by retained clients as a share of their first-year orders.
Presentation choice: It is the only example that shows what the company keeps after paying couriers, and the only one with evidence that clients keep ordering.
When it does not fit: The gross-to-net bars have no values. Label them, or an investor can't read the net margin.
Car and bike servicing marketplace. Stage and year are not stated on the slide.
Mechanic Baba deck, slide 6. Exact stored slide matched to this analysis.
Our analysis: One sentence answers all three questions: the rate (10%), the base (full service cost) and the payer (the service centres).
Evidence and limitation: The other streams have no rates or status. Say which are live.
What a founder can adapt: Write your commission as one sentence: rate, base, payer.
Supporting analysis
What the deck claims: "How are you going to make money": "Currently, we earn 10% of the full service cost as a commission from the partner car service centers." Other revenue streams: bike servicing, car accessories, insurance renewal, used car sales.
Presentation choice: One sentence answers all three questions: the rate (10%), the base (full service cost) and the payer (the service centres).
When it does not fit: The other streams have no rates or status. Say which are live.
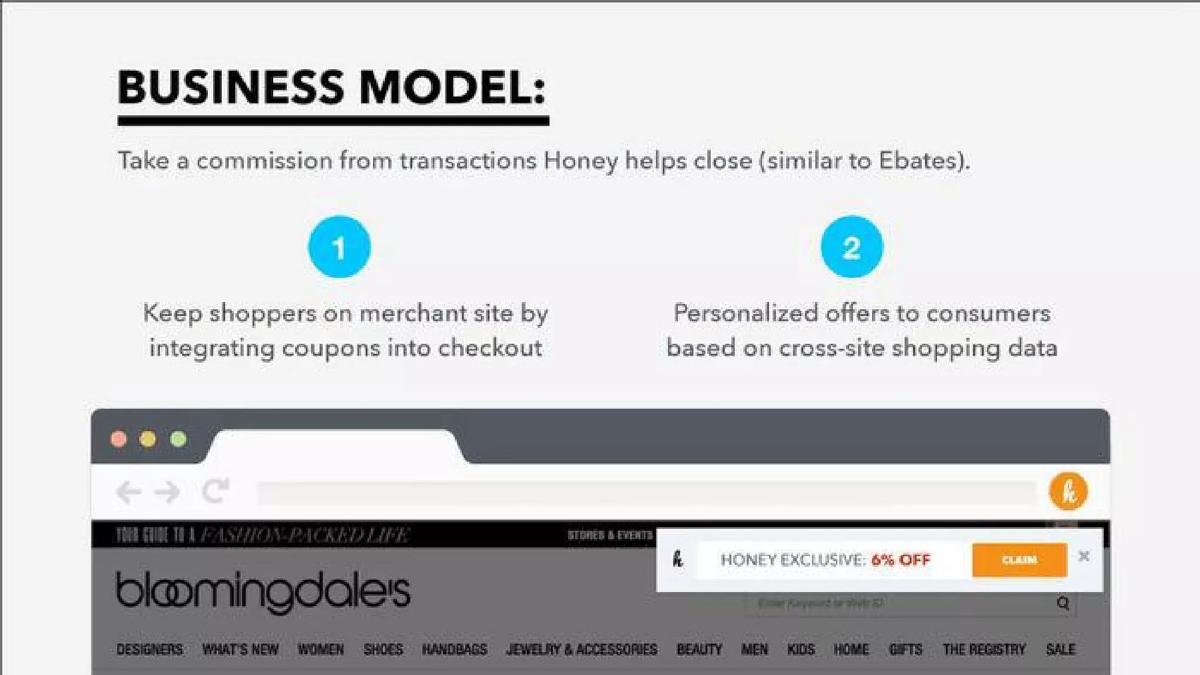
Browser extension that applies shopping coupons. Stage and year are not stated on the slide.
Honey deck, slide 6. Exact stored slide matched to this analysis.
Our analysis: Naming a known comparable (Ebates) explains the model instantly, and the screenshot shows where in checkout the commission is earned.
Evidence and limitation: No rate is given. Add your typical commission, even as a range.
What a founder can adapt: If a well-known company uses your model, name it in one phrase.
Supporting analysis
What the deck claims: "Take a commission from transactions Honey helps close (similar to Ebates)." Two points: keep shoppers on merchant sites by putting coupons into checkout; personalised offers based on cross-site shopping data. A screenshot shows a Honey offer on a retailer's site.
Presentation choice: Naming a known comparable (Ebates) explains the model instantly, and the screenshot shows where in checkout the commission is earned.
When it does not fit: No rate is given. Add your typical commission, even as a range.
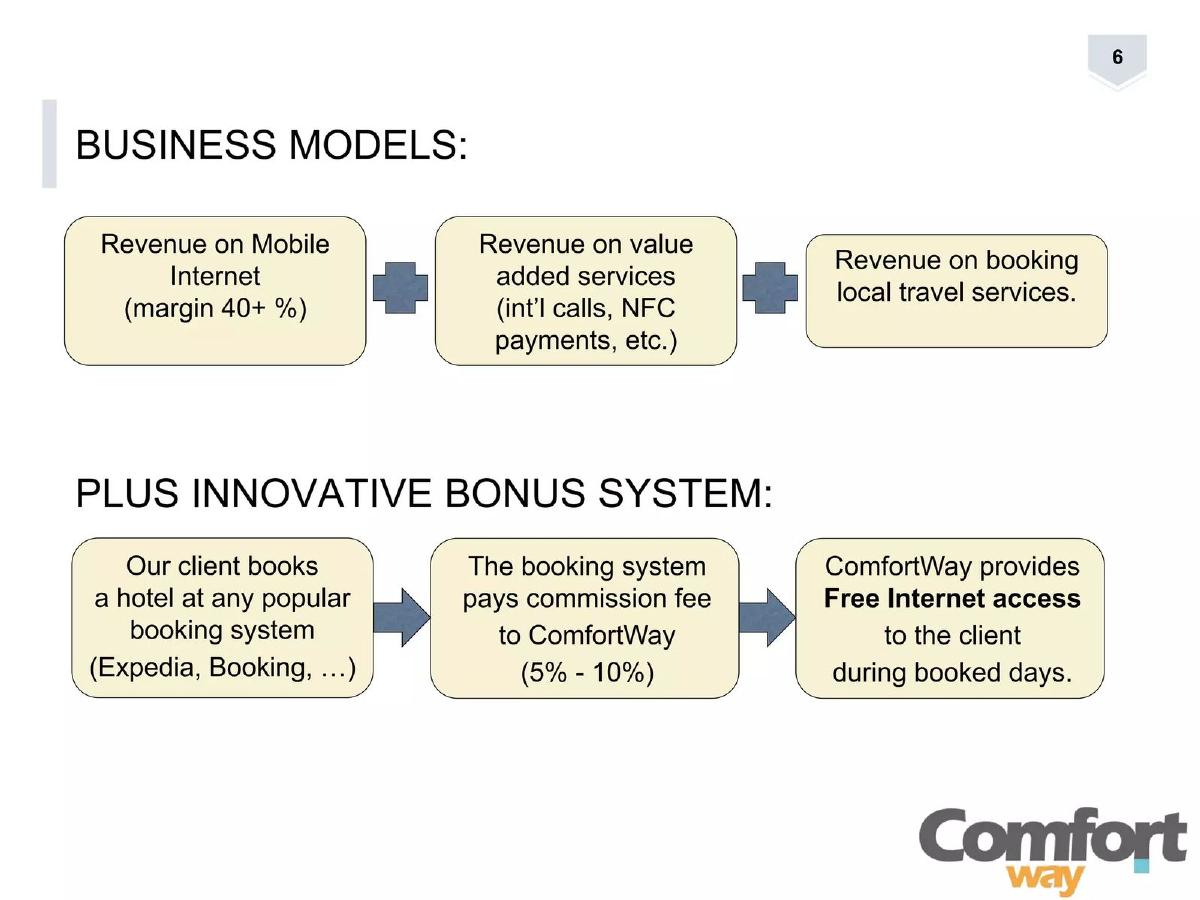
Mobile internet for travellers. Stage and year are not stated on the slide.
ComfortWay deck, slide 6. Exact stored slide matched to this analysis.
Our analysis: The three-step diagram shows exactly who pays whom, and why the traveller books through ComfortWay.
Evidence and limitation: Three models plus a bonus system is a lot for one slide. Say which one brings most of the revenue.
What a founder can adapt: Use a left-to-right diagram when money moves between three parties.
Supporting analysis
What the deck claims: "Business models": revenue on mobile internet (margin 40%+), on value-added services, and on local travel bookings. A "bonus system": a client books a hotel through a booking site; the booking site pays ComfortWay a 5–10% commission; ComfortWay gives the client free internet during the stay.
Presentation choice: The three-step diagram shows exactly who pays whom, and why the traveller books through ComfortWay.
When it does not fit: Three models plus a bonus system is a lot for one slide. Say which one brings most of the revenue.
Nightlife booking app. Stage and year are not stated on the slide.
Roxi deck, slide 6. Exact stored slide matched to this analysis.
Our analysis: The base is clear (bottle service and tickets), and the planned subscription is labelled as future.
Evidence and limitation: The diagram doesn't show whether the club or the guest pays the 2.5%.
What a founder can adapt: Treat this as a slide to improve on. Label future revenue as future, as Roxi does, and add who pays.
Supporting analysis
What the deck claims: "2.5% goes to Roxi" between "club goer" and "night club". "Roxi collects a 2.5% commission on all bottle service bookings and admission tickets sold. A $250 monthly subscription fee will also be implemented once we've hit our short term market share targets."
Presentation choice: The base is clear (bottle service and tickets), and the planned subscription is labelled as future.
When it does not fit: The diagram doesn't show whether the club or the guest pays the 2.5%.
Online medical marketplace. Stage and year are not stated on the slide.
Medico deck, slide 6. Exact stored slide matched to this analysis.
Our analysis: It lists the usual marketplace streams in one view.
Evidence and limitation: No rate, base, payer or priority is given for any stream.
What a founder can adapt: Treat this as a slide to improve on. Replace each "%" with the actual rate and who pays it.
Supporting analysis
What the deck claims: "Business Model" in three columns: commissions and sales (% from online payment, % from successful selling operations, agency); online store (monthly subscriptions for premium accounts); ads (sellers pay to appear on ads pages and in the first three search results).
Presentation choice: It lists the usual marketplace streams in one view.
When it does not fit: No rate, base, payer or priority is given for any stream.
A complete commission statement has a rate, a base and a payer.
Example
Rate
Charged on
Who pays
Keeps after supply
Borzo
20%
Delivery fee
Implied: merchants
Charted, no values
Mechanic Baba
10%
Full service cost
Service centres
Not shown
Drive
25%
Every booking
Not stated
Not shown
Honey
Not stated
Transactions closed
Implied: merchants
Not shown
ComfortWay
5–10%
Hotel bookings
Booking sites
Not shown
Roxi
2.5%
Bottle service, tickets
Not stated
Not shown
Medico
Not stated
Online payments
Not stated
Not shown
Key Takeaways
Say who pays. Mechanic Baba's commission comes "from the partner car service centers"; Roxi's slide shows the 2.5% sitting between club goer and night club but doesn't say which side is charged.
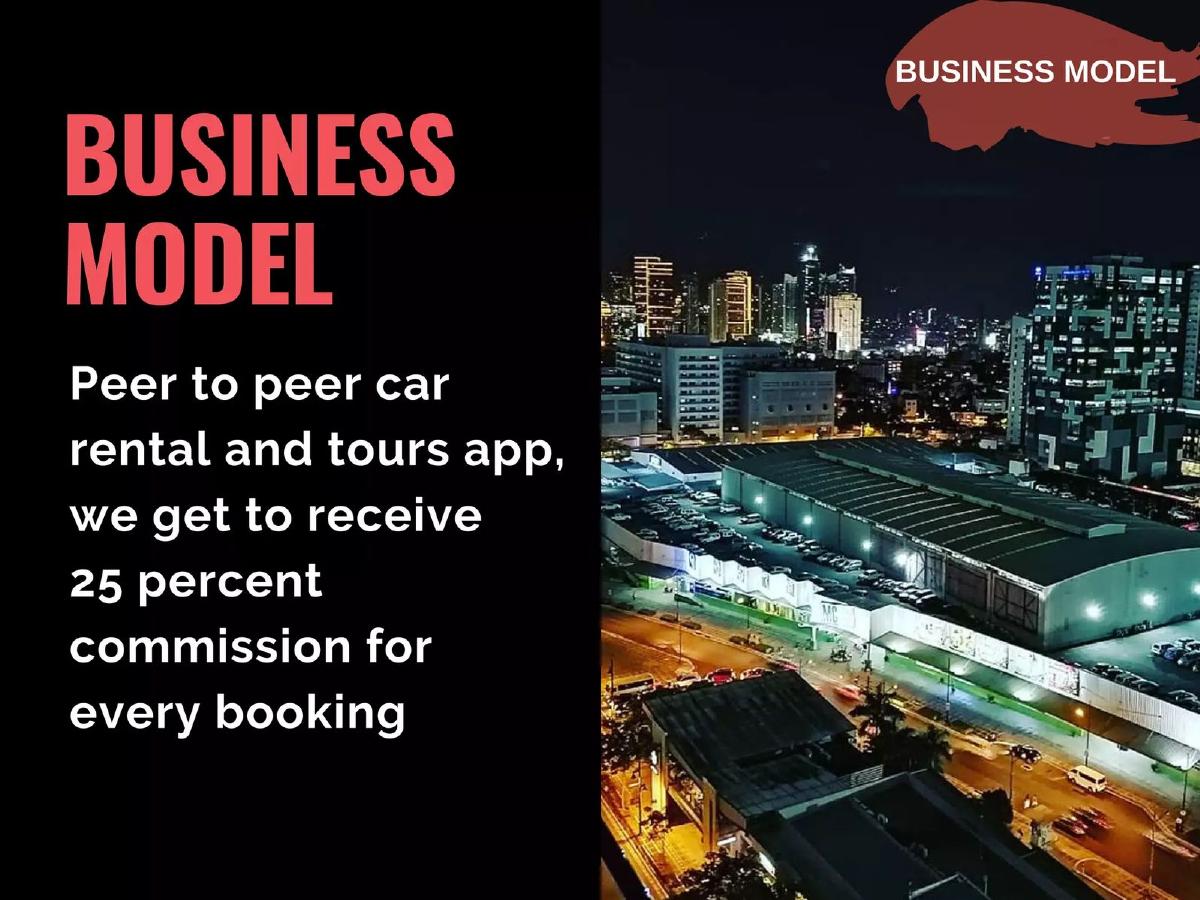
Say what the rate is charged on. Mechanic Baba charges 10% "of the full service cost"; Drive's 25% is "for every booking". Without a base, a rate can't be turned into revenue.
Show gross versus net. Borzo states a 20% take rate and charts gross revenue, courier pay and net revenue, so an investor can see what stays with the company.
Add evidence the commission repeats. Borzo shows up to 70% of annual order value coming from retained clients; none of the other examples shows repeat use.
List other revenue streams after the main one, and label the ones not yet live. Roxi says its $250 monthly subscription starts only after it reaches market-share targets.
Write your commission line
Fill in each part. If you can't, that's the question an investor will ask.
Rate. What percentage, or range?
Base. A percentage of what: booking value, service cost, fee?
Payer. Buyer, seller, or both?
Kept. After paying the supply side, what share stays with you?
Repeat. What shows customers transact again?
Copyable framework: We take [rate] of [base], paid by [payer]; net revenue is [x]% of order value.
Illustrative example 1 — written by us
Before: Commissions & sales: % from online payment.
After: We take [8]% of each order, paid by the seller; [x]% of orders come from repeat buyers.
What improved: Our illustrative rewrite, not any company's text. Bracketed values are placeholders.
How this differs from the main business model guide
The business model slide guide covers all pricing approaches: subscriptions, unit sales, licences and more. This guide covers one decision specific to marketplaces and platforms: how to explain a commission on transactions between two other parties. For how marketplaces show growth, see the marketplace traction guide.
Common mistakes
A rate with no base. "25%" of what?
No payer. Say which side is charged.
Gross revenue presented as revenue. Show what you keep after paying supply.
Future streams mixed with live ones. Label planned revenue as planned.
Too many streams. Lead with the one that brings most revenue.
Diagnostic checklist
Rate stated.
Base stated.
Payer stated.
Net revenue or margin after supply shown.
One repeat-use figure.
Planned streams labelled as planned.
Frequently asked questions
How we chose these examples
Corpus: published pitch deck teardowns on StartupFundraising.com. Founder-uploaded private decks are excluded.
Selection (2026-09-24): we searched extracted text of slides 2–6 for business or revenue model slides mentioning a commission, take rate or transaction fee (about 20 slides) and inspected eight. Seven were selected for variety of marketplace type. InfiniteUp was left out because its slide is mostly market size.
Overlap check: the main business model guide covers all pricing models and uses none of these companies; the marketplace traction guide covers growth metrics, not commission. Pages link to each other.
Review: all seven stored slide images were inspected on 2026-09-24 and matched to company, deck and slide number (editorial model review). No person has yet completed an editorial review of this page.
Rates are the companies' own claims and have not been verified. Where the payer is marked "implied", that is our reading, not a statement on the slide. We make no claim that any slide caused a fundraising outcome.