How startups show a flywheel or network effect in a pitch deck: which loop to draw, what evidence makes it believable.
Flywheel Slide: Real Pitch Deck Examples
Twelve slides, shown in full, compare how startups draw a self-reinforcing loop: more users, data or customers making the product better, which brings more users, data or customers. Five of them, added on 2026-09-30, test a narrower question: is the thing a deck calls a network effect really one, or is it referrals, virality or a sales channel?
TL;DR
A flywheel slide should show one loop in which each step causes the next, with at least one number proving the loop already turns. The strongest examples below attach evidence: Deepgram shows its accuracy against two competitors on a customer's audio; Doxa shows over 80% supplier onboarding success; Crunchbase names its million community members and 4,000 data partners. The weakest are circles of activities that don't cause each other (CommerceIQ) or loops about a market rather than the company (Flowcarbon). If you can't point to one measured turn of your loop, describe the loop in a sentence instead of drawing it.
Many slides labelled "network effects" describe something else. A network effect means the product becomes more valuable to each user as others join. Referrals and invitations are a way of acquiring users; they can exist without any network effect. Careerist's referral table and Examedi's doctor referrals are acquisition channels; Lunch Club's 19% of users invited from another city is a measured sign of cross-city spread; OpenFin draws a genuine interoperability network but gives no counts; Splitwise states the mechanism in one sentence and claims the cohort evidence without showing it.
Flywheel slides from real pitch decks
Each example shows the exact stored slide above its analysis and links to the full teardown. Figures are the companies' own claims unless marked as our calculation. Stage and year are given only where the slide states them. The last five examples test network-effect labels.
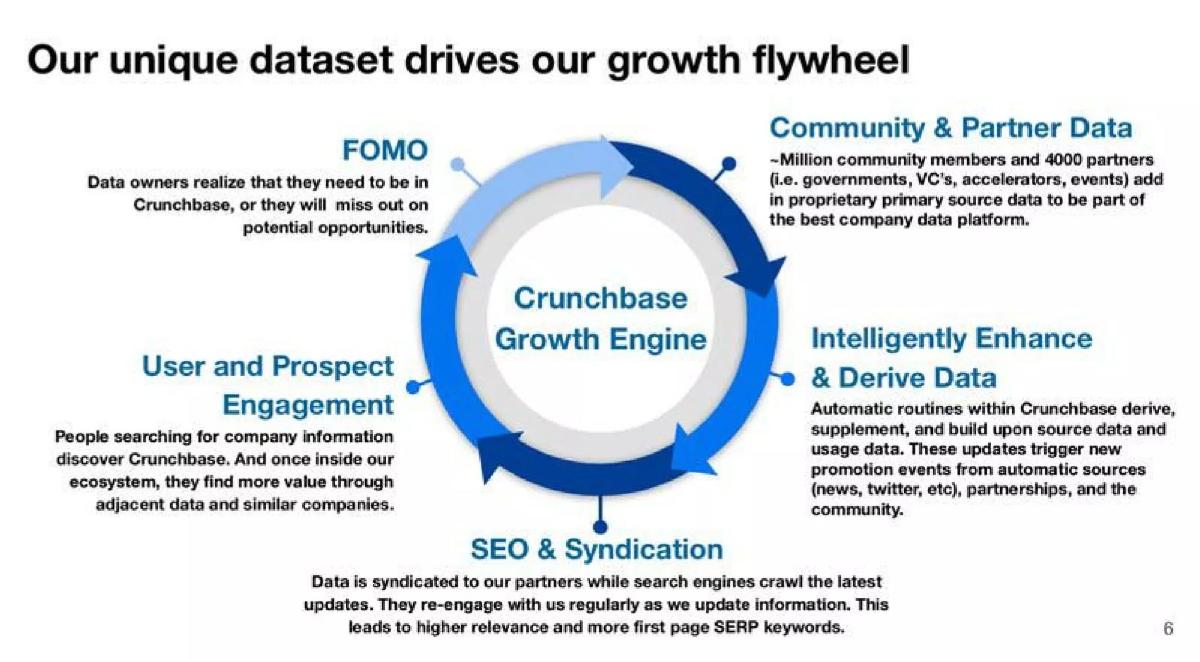
Crunchbase flywheel slide — slide 6
Company data platform. Stage and year are not stated on the slide.
Crunchbase deck, slide 6. Exact stored slide matched to this analysis.
Our analysis: Each step causes the next, and the loop ends where it started: more data brings more visitors, who contribute more data. The community and partner counts show the first step is already running.
Evidence and limitation: Only the first step has a number. Add one for the search step (monthly visitors from search) so an investor can see the loop turning, not only the intake.
What a founder can adapt: Write each step as "X, which brings Y", and give a number for the step where the loop starts.
Supporting analysis
What the deck claims: "Our unique dataset drives our growth flywheel". A circular "Crunchbase Growth Engine" with four steps: community and partner data (about a million community members and 4,000 partners such as governments, VCs, accelerators and events add proprietary data); intelligently enhance and derive data (automated routines add to it); SEO and syndication (data is syndicated to partners and crawled by search engines, which brings people back); and user and prospect engagement (people who find a company discover adjacent companies). A "FOMO" note says data owners realise they need to be in Crunchbase.
Presentation choice: Each step causes the next, and the loop ends where it started: more data brings more visitors, who contribute more data. The community and partner counts show the first step is already running.
When it does not fit: Only the first step has a number. Add one for the search step (monthly visitors from search) so an investor can see the loop turning, not only the intake.
Speech recognition API. Stage and year are not stated on the slide.
Deepgram deck, slide 6. Exact stored slide matched to this analysis.
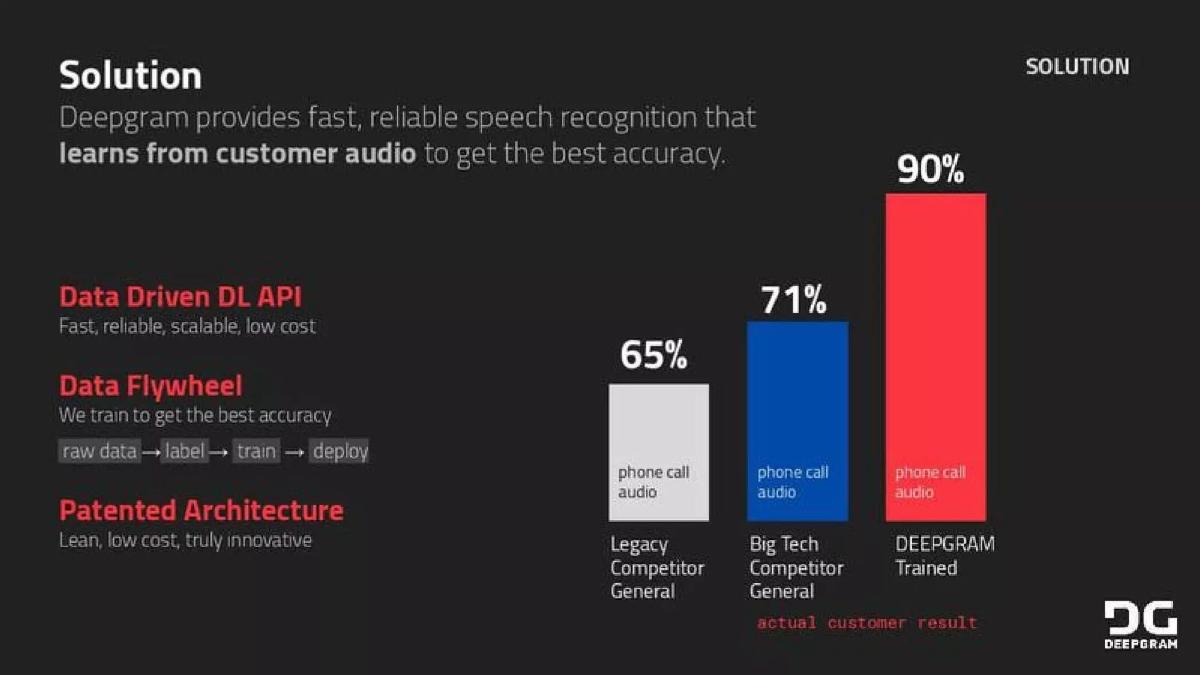
Our analysis: The flywheel is one line, but it is backed by the result it produces: training on a customer's audio lifts accuracy well above two competitors on that same audio.
Evidence and limitation: It is one customer, and the competitors aren't named. Say how many customers show a similar gain and how accuracy is measured (for example, word error rate).
What a founder can adapt: Put the flywheel next to the measurable improvement it creates, on real customer data.
Supporting analysis
What the deck claims: "Solution": Deepgram provides speech recognition "that learns from customer audio to get the best accuracy". Three points: data-driven deep-learning API; "data flywheel" ("we train to get the best accuracy": raw data, label, train, deploy); patented architecture. A bar chart labelled "actual customer result" shows phone-call audio accuracy of 65% for a legacy competitor, 71% for a big-tech competitor and 90% for Deepgram trained on the customer's data.
Presentation choice: The flywheel is one line, but it is backed by the result it produces: training on a customer's audio lifts accuracy well above two competitors on that same audio.
When it does not fit: It is one customer, and the competitors aren't named. Say how many customers show a similar gain and how accuracy is measured (for example, word error rate).
Equity management software. Stage and year are not stated on the slide.
Ledgy deck, slide 3. Exact stored slide matched to this analysis.
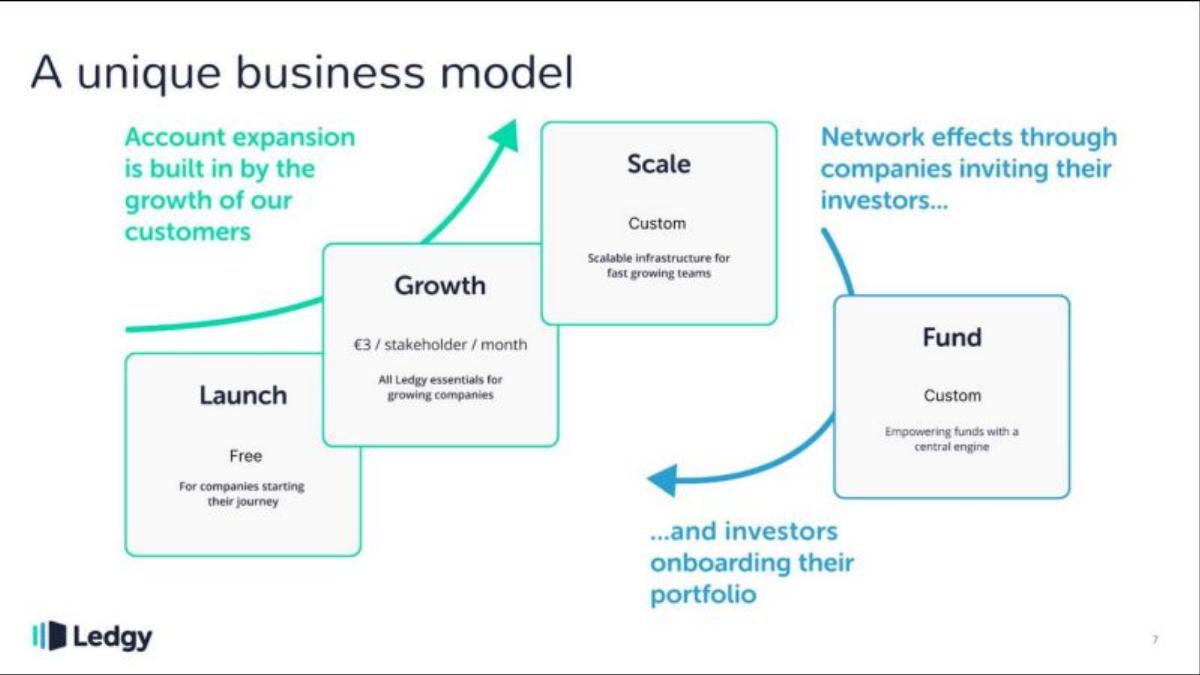
Our analysis: Two loops in one slide, both tied to pricing: revenue grows as a customer adds stakeholders, and each customer brings investors who can bring their other companies. The network effect doubles as the sales channel.
Evidence and limitation: There is no evidence the loop works yet: no share of customers that came from investors, and no count of funds onboarded. Add one.
What a founder can adapt: If your users invite other potential customers, draw that path next to your pricing.
Supporting analysis
What the deck claims: "A unique business model": plans rise from Launch (free) to Growth (€3 per stakeholder per month) to Scale (custom), labelled "account expansion is built in by the growth of our customers". A Fund plan (custom) sits beside them, with arrows: "network effects through companies inviting their investors… and investors onboarding their portfolio".
Presentation choice: Two loops in one slide, both tied to pricing: revenue grows as a customer adds stakeholders, and each customer brings investors who can bring their other companies. The network effect doubles as the sales channel.
When it does not fit: There is no evidence the loop works yet: no share of customers that came from investors, and no count of funds onboarded. Add one.
Procurement platform for buyers and suppliers (Doxa Connex). Stage and year are not stated on the slide.
Doxa deck, slide 6. Exact stored slide matched to this analysis.
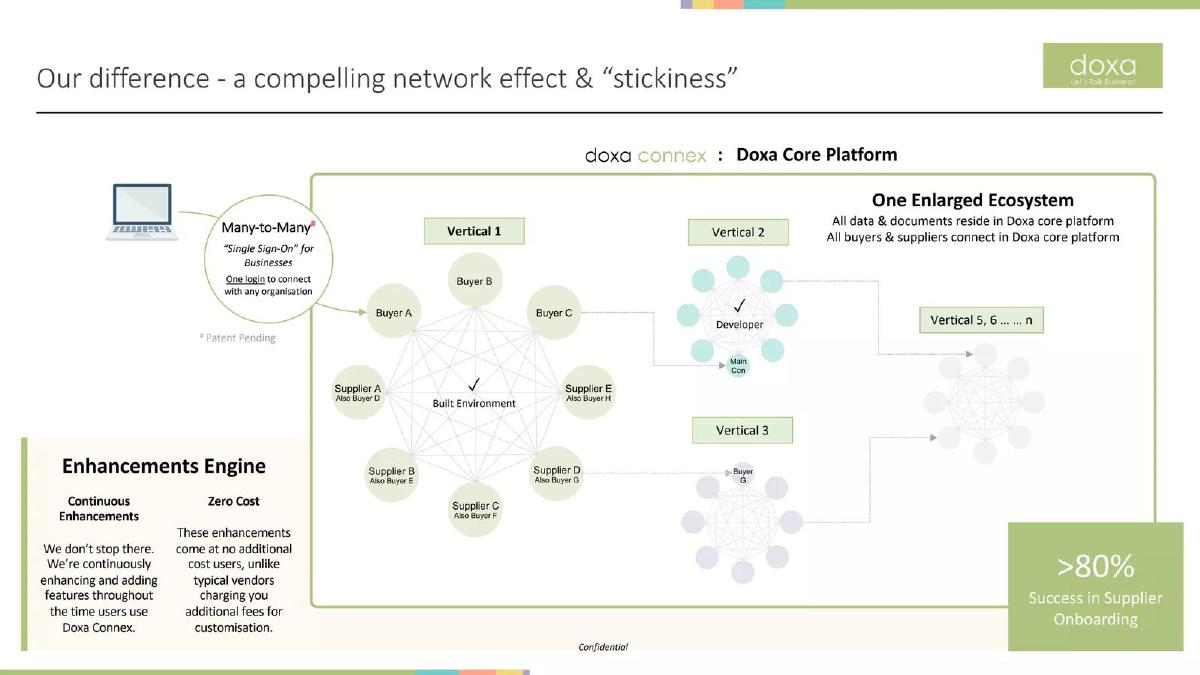
Our analysis: It shows why each new buyer makes the network more valuable to suppliers and the other way round, and backs it with an onboarding rate.
Evidence and limitation: The diagram is dense and the onboarding figure has no base (of how many suppliers invited?). Simplify to one vertical and give counts of buyers and suppliers.
What a founder can adapt: For a two-sided network, show a participant who is on both sides; it makes the network effect easy to see.
Supporting analysis
What the deck claims: "Our difference - a compelling network effect & stickiness". A diagram of one enlarged ecosystem: buyers and suppliers connected on the Doxa core platform within verticals, with suppliers that are also buyers, and more verticals added over time. A "many-to-many" single sign-on note (marked patent pending), an "enhancements engine" box (continuous improvements at zero extra cost to users), and a callout: "more than 80% success in supplier onboarding".
Presentation choice: It shows why each new buyer makes the network more valuable to suppliers and the other way round, and backs it with an onboarding rate.
When it does not fit: The diagram is dense and the onboarding figure has no base (of how many suppliers invited?). Simplify to one vertical and give counts of buyers and suppliers.
Islamic-finance point-of-sale, instalment and investing platform. Stage and year are not stated on the slide.
IMAN deck, slide 6. Exact stored slide matched to this analysis.
Our analysis: The three-sided loop is clear: merchants bring shoppers, shoppers create instalments, investors fund them, which lets more merchants offer instalments. The certificates address the trust question specific to this market.
Evidence and limitation: "First in the market" and "network effects" are claims without counts. Add merchants, shoppers and funded volume.
What a founder can adapt: For a multi-sided model, number the sides in the order money or value flows.
Supporting analysis
What the deck claims: "IMAN is a halal fintech solution for merchants, shoppers, and investors": (1) point-of-sale for merchants at zero upfront cost; (2) shoppers buy on halal instalments; (3) investors fund the instalments. A three-part circle and two Shariah certificate images. The footer: "We are the first Islamic product in the market, allowing us to capitalize on the network effects early on and benefit from massive scalability at very low incremental cost."
Presentation choice: The three-sided loop is clear: merchants bring shoppers, shoppers create instalments, investors fund them, which lets more merchants offer instalments. The certificates address the trust question specific to this market.
When it does not fit: "First in the market" and "network effects" are claims without counts. Add merchants, shoppers and funded volume.
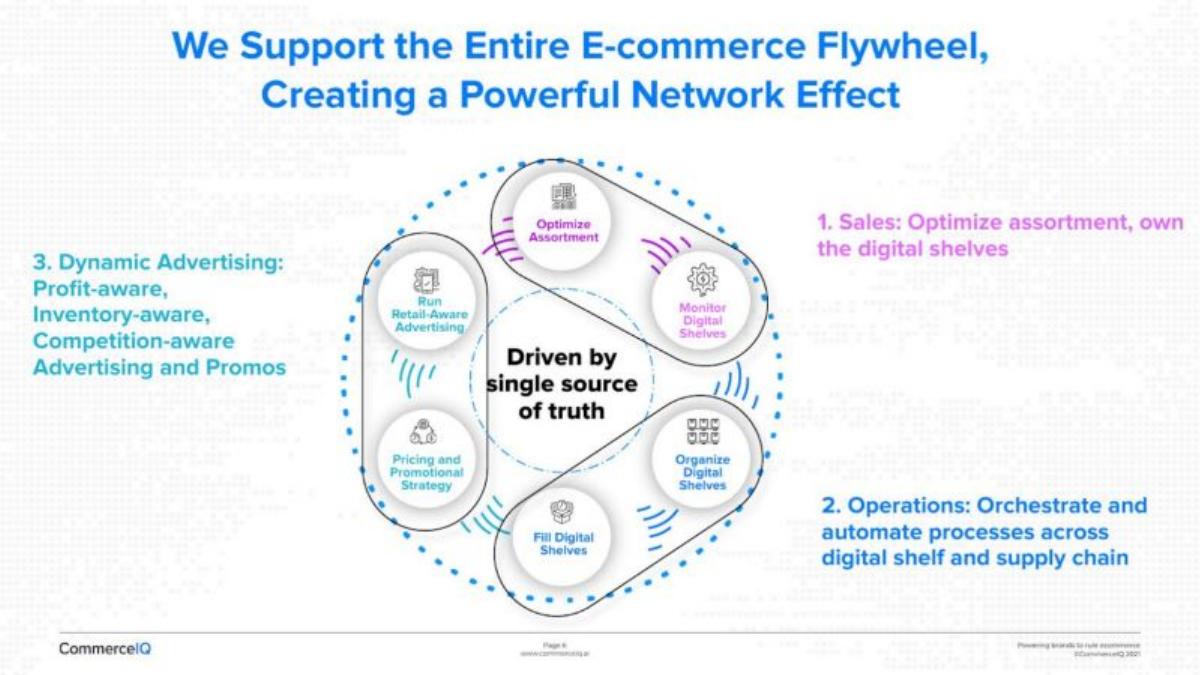
E-commerce management software for brands. Stage and year are not stated on the slide.
CommerceIQ deck, slide 6. Exact stored slide matched to this analysis.
Our analysis: It shows the product covers the whole job, which supports a platform story.
Evidence and limitation: The six steps are product features, and none causes the next. Calling it a network effect doesn't make it one; nothing gets better for one customer when another joins.
What a founder can adapt: Treat this as a slide to improve on. If you want a flywheel, state what grows with each turn (for example, more brands giving better pricing data).
Supporting analysis
What the deck claims: "We Support the Entire E-commerce Flywheel, Creating a Powerful Network Effect". A circle of six activities around "driven by single source of truth" (optimize assortment, monitor digital shelves, organize digital shelves, fill digital shelves, pricing and promotional strategy, run retail-aware advertising), grouped into sales, operations and dynamic advertising.
Presentation choice: It shows the product covers the whole job, which supports a platform story.
When it does not fit: The six steps are product features, and none causes the next. Calling it a network effect doesn't make it one; nothing gets better for one customer when another joins.
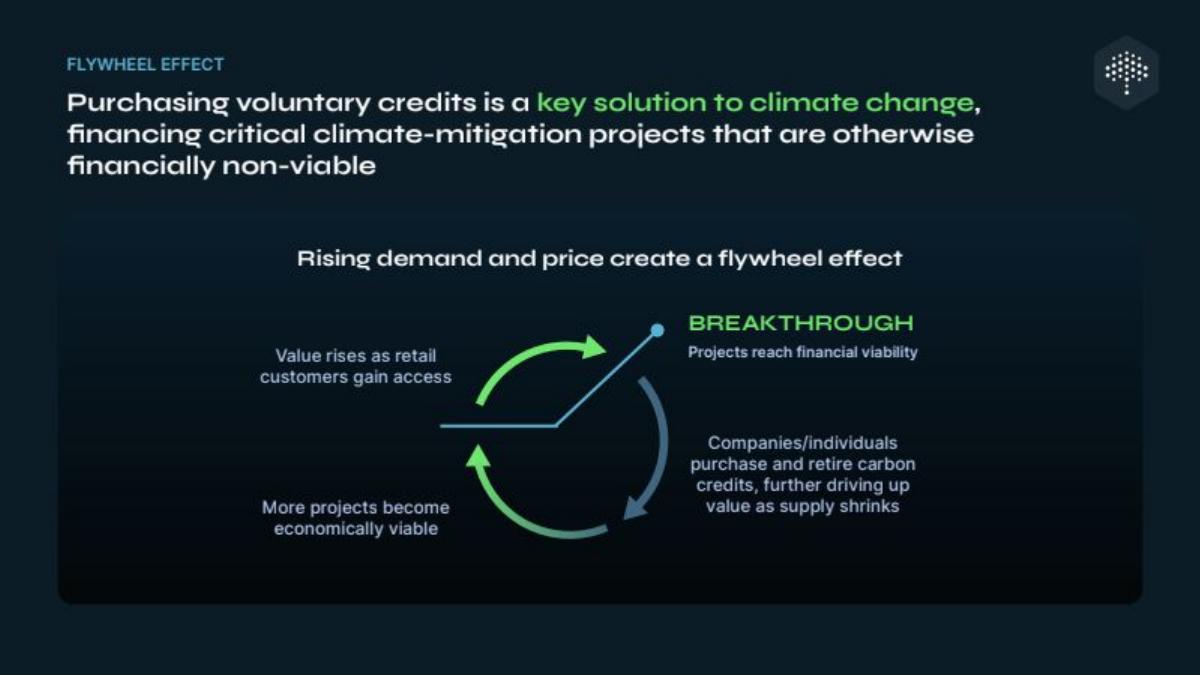
Carbon-credit marketplace. Stage and year are not stated on the slide.
Flowcarbon deck, slide 4. Exact stored slide matched to this analysis.
Our analysis: The loop is clearly drawn and each step does lead to the next.
Evidence and limitation: This is a flywheel for the carbon market, not for Flowcarbon. The slide doesn't say what the company does in the loop or how it benefits as it turns.
What a founder can adapt: Treat this as a slide to improve on. Start with the loop in your market, then show which step your company speeds up.
Supporting analysis
What the deck claims: "Flywheel effect": buying voluntary carbon credits funds climate projects that are otherwise not financially viable. "Rising demand and price create a flywheel effect": value rises as retail customers gain access; projects reach financial viability ("breakthrough"); companies and individuals buy and retire credits, raising value as supply shrinks; more projects become viable.
Presentation choice: The loop is clearly drawn and each step does lead to the next.
When it does not fit: This is a flywheel for the carbon market, not for Flowcarbon. The slide doesn't say what the company does in the loop or how it benefits as it turns.
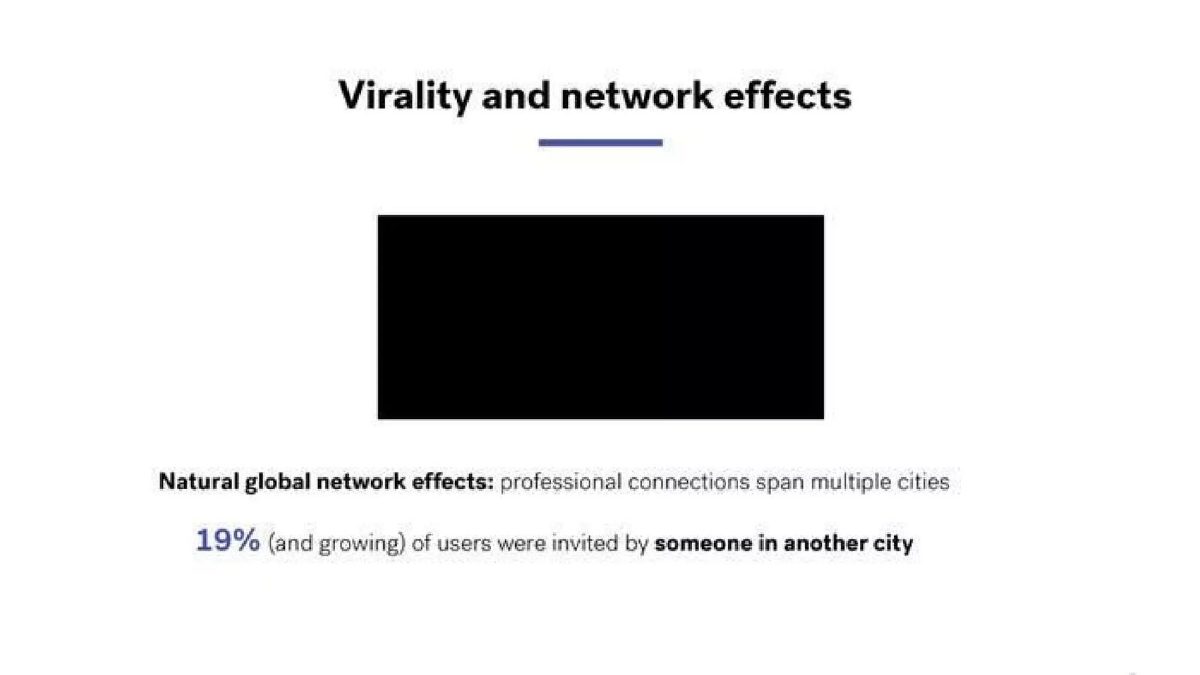
Professional networking app that arranges one-to-one meetings. Stage and year are not stated on the slide.
Lunch Club deck, slide 8. Exact stored slide matched to this analysis.
Our analysis: Cross-city invitations are evidence of virality that crosses markets, which matters for a city-by-city service: a new city can start with users already invited from elsewhere. It supports, but does not prove, a network effect.
Evidence and limitation: One measured figure, 19%, with no base, period or earlier value; the chart that presumably showed the trend is redacted.
What a founder can adapt: Give the base (19% of how many users, over what period) and the value a year earlier, so "and growing" is visible.
Supporting analysis
What the deck claims: "Virality and network effects". A redacted chart (a black box in the published deck), then: "Natural global network effects: professional connections span multiple cities" and "19% (and growing) of users were invited by someone in another city".
Presentation choice: It measures the mechanism the title claims rather than repeating the label, and it names the specific advantage: professional networks are not local.
When it does not fit: Don't let a share of invited users stand in for a network effect; add a measure of value per user, such as meetings per user by city size.
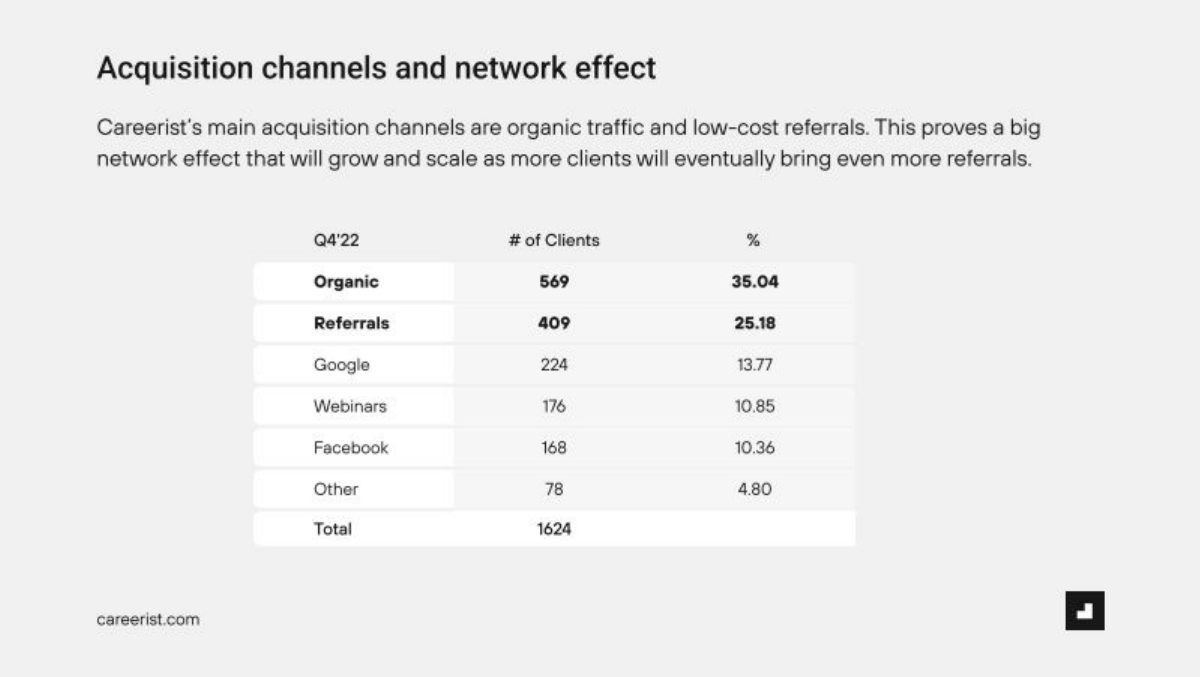
Career training service (careerist.com). Clients by acquisition channel for Q4 2022.
Careerist deck, slide 8. Exact stored slide matched to this analysis.
Our analysis: The table is good evidence of cheap acquisition. It is not evidence of a network effect: a training course does not become more valuable to one student because another enrols. The claim that referrals "prove" a network effect is the error.
Evidence and limitation: Our checks: the six channels add to 1,624; 569 ÷ 1,624 is 35.04% and 409 ÷ 1,624 is 25.18%, so the table reconciles. Organic plus referrals is 978 clients, 60.2% of the quarter (our calculation).
What a founder can adapt: Retitle it as acquisition, add the referral share for earlier quarters, and put cost per client by channel beside it.
Supporting analysis
What the deck claims: "Acquisition channels and network effect": "Careerist's main acquisition channels are organic traffic and low-cost referrals. This proves a big network effect that will grow and scale as more clients will eventually bring even more referrals." Table for Q4'22: organic 569 clients (35.04%), referrals 409 (25.18%), Google 224 (13.77%), webinars 176 (10.85%), Facebook 168 (10.36%), other 78 (4.80%), total 1,624.
Presentation choice: A single quarter's channel mix with counts and shares that add up is exactly what a channels slide should show.
When it does not fit: Don't describe word-of-mouth as a network effect; call it a referral channel and let the numbers carry it.
At-home lab testing service. Stage and year are not stated on the slide.
Examedi deck, slide 7. Exact stored slide matched to this analysis.
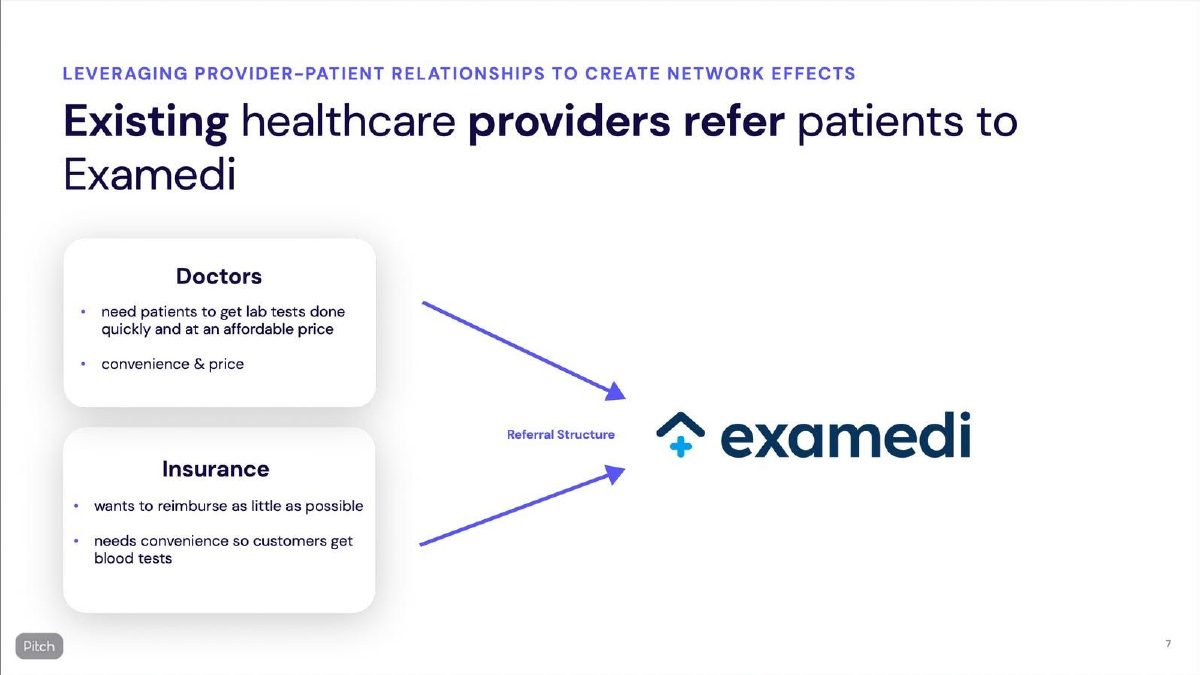
Our analysis: This is a distribution strategy through intermediaries, and a sensible one for a lab service. Nothing in it makes Examedi more valuable to one patient or doctor as others join, so the eyebrow overstates it.
Evidence and limitation: No counts: no number of referring doctors or insurers, and no number of patients referred.
What a founder can adapt: Label it as a referral channel and add the number of referring providers and the share of tests they generate.
Supporting analysis
What the deck claims: Eyebrow: "Leveraging provider-patient relationships to create network effects". Headline: "Existing healthcare providers refer patients to Examedi". Doctors "need patients to get lab tests done quickly and at an affordable price" (convenience and price); insurance "wants to reimburse as little as possible" and "needs convenience so customers get blood tests". Arrows labelled "Referral Structure" point to Examedi.
Presentation choice: It explains clearly why each referrer has a reason to send patients, which is the core of a partner channel.
When it does not fit: Don't use "network effects" for a referral structure between a service and its referrers.
Desktop application platform for financial firms. Marked confidential; stage and year are not stated on the slide.
OpenFin deck, slide 8. Exact stored slide matched to this analysis.
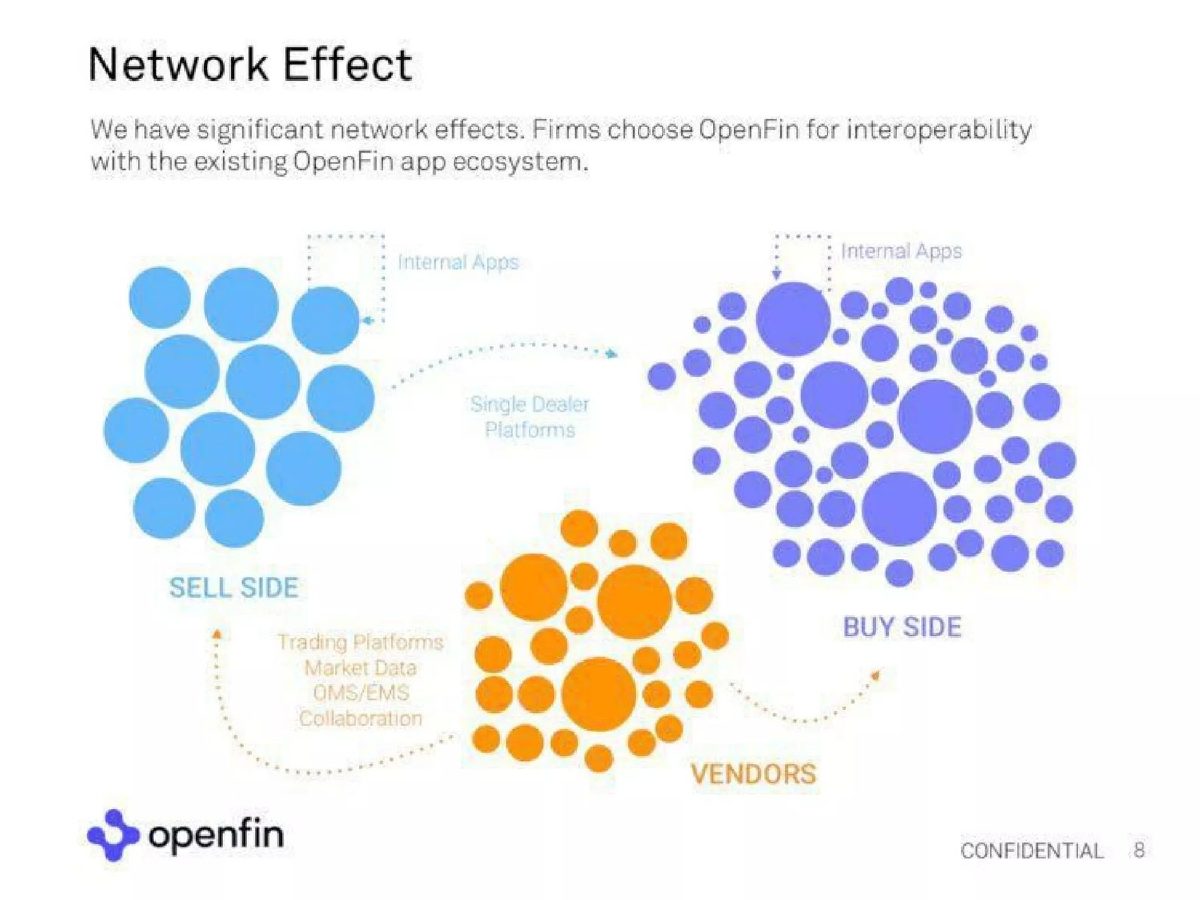
Our analysis: This fits the definition of a network effect: the reason to adopt is interoperability with firms and apps already on the platform, so each new participant raises the value for the others. What is missing is its size.
Evidence and limitation: The bubbles are illustrative; the slide gives no number of firms, apps or connections.
What a founder can adapt: Put one count per cluster on the diagram and the share of new customers who cited existing integrations.
Supporting analysis
What the deck claims: "Network Effect": "We have significant network effects. Firms choose OpenFin for interoperability with the existing OpenFin app ecosystem." A diagram of three clusters (sell side, buy side, vendors) with internal apps, single-dealer platforms between sell side and buy side, and vendors' trading platforms, market data, OMS/EMS and collaboration tools connecting to both.
Presentation choice: It states the mechanism in one sentence (firms choose it to interoperate with the existing ecosystem) and shows the three sides that benefit.
When it does not fit: Don't let decorative bubbles imply scale; unnumbered circles tell the reader nothing about the network's size.
Bill-splitting app. Stage and year are not stated on the slide.
Splitwise deck, slide 10. Exact stored slide matched to this analysis.
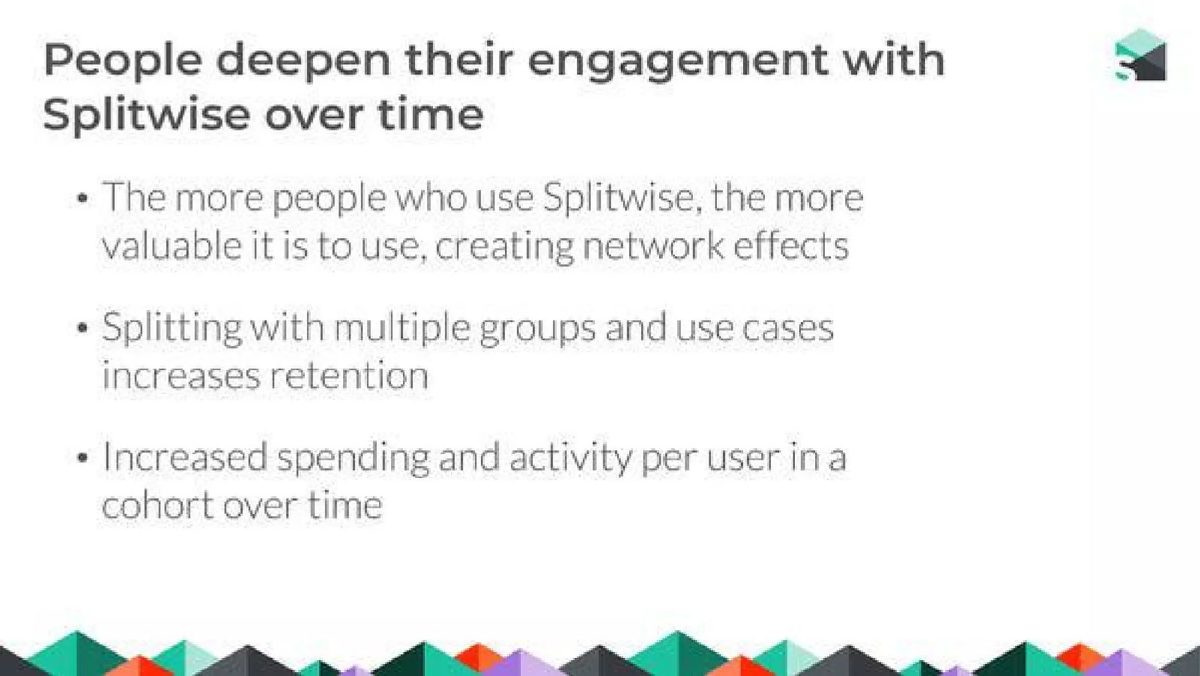
Our analysis: The mechanism is real for a bill-splitting app (a user can only split with people who also use it), and the second bullet names the right test: retention by number of groups. The slide asserts the result instead of showing it.
Evidence and limitation: Three claims, no figures: no retention by number of groups and no cohort chart on this slide.
What a founder can adapt: Replace the second bullet with the retention of users in one group versus several, and the third with a cohort chart.
Supporting analysis
What the deck claims: "People deepen their engagement with Splitwise over time": "The more people who use Splitwise, the more valuable it is to use, creating network effects"; "Splitting with multiple groups and use cases increases retention"; "Increased spending and activity per user in a cohort over time".
Presentation choice: It connects the network effect to the metric that would prove it, retention rising with the number of groups a user splits with.
When it does not fit: Don't claim cohort improvement in words; show the chart.
Check each loop for cause, ownership and evidence.
Example
Type of loop
Each step causes the next
The company's own loop
Evidence
Crunchbase
Data and community
Yes
Yes
1M members, 4,000 partners
Deepgram
Data (training)
Yes
Yes
90% vs 71% and 65% on customer audio
Ledgy
Invitations and account growth
Yes
Yes
Pricing only
Doxa
Two-sided network
Yes
Yes
More than 80% supplier onboarding
IMAN
Three-sided network
Yes
Yes
Certificates, no counts
CommerceIQ
Product features
No
Yes
None
Flowcarbon
Market dynamics
Yes
No
None
Lunch Club
Cross-city invitations
Partly
Yes
19% invited from another city
Careerist
Referral channel
No network effect
Yes
409 of 1,624 clients referred
Examedi
Referral channel
No network effect
Yes
None
OpenFin
Interoperability network
Yes
Yes
Diagram, no counts
Splitwise
Direct network effect
Yes
Yes
Claimed, not shown
Key Takeaways
Each arrow must mean "causes". Crunchbase's loop works because every step feeds the next: community data brings users, users bring engagement, engagement brings more data.
Prove one turn of the wheel. Deepgram's "data flywheel" is backed by a customer result: 90% accuracy against 71% and 65% for two competitors.
Show the network effect in the business model. Ledgy's customers invite their investors, and those investors bring their portfolios, so the growth path is also the sales channel.
A list of product modules in a circle is not a flywheel. CommerceIQ's six activities describe what the software does, not why growth speeds up.
Referrals are not a network effect by themselves. Careerist's 409 referred clients (25.18% of 1,624) show a cheap channel, not that each client makes the service better for the next.
Measure the mechanism you claim. Lunch Club's 19% of users invited by someone in another city is a number about the network itself.
Make it your loop, not the market's. Flowcarbon's flywheel is about the carbon-credit market in general; the slide doesn't say what part the company plays.
Build your flywheel slide
If a step doesn't cause the next, remove it.
Loop. Write your loop as three or four steps, each ending with "which brings…"
Type. Is it a network effect (users help users), a data loop (usage improves the product) or a cost loop (scale lowers cost)?
Test. What gets better for an existing user when a new one joins? If nothing, it's an acquisition channel.
Proof. What number shows one step already happening?
Speed-up. What gets cheaper or better for you with each new user or customer?
Copyable framework: More [users/customers] bring more [data/participants], which makes [product] [better/cheaper] ([metric]: [before] → [after]), which brings more [users/customers].
Illustrative example 1 — written by us
Before: Our platform creates a powerful flywheel and strong network effects.
After: Each new [buyer] brings [n] [suppliers]; [x]% of new [buyers] in [period] came from supplier invitations, up from [y]%.
What improved: Our illustrative rewrite, not any company's text. It turns a claim into a loop with one measured turn; bracketed values are placeholders.
Flywheel, network effect and competition slides
A competition slide compares you with rivals. A flywheel slide explains why your lead should grow over time: each new user, data point or customer makes the next one cheaper to win or more valuable. It is an argument about defensibility and growth, which is why investors look for evidence rather than arrows.
Network effects are one kind of flywheel, where more users make the product better for other users (Doxa's buyers and suppliers, IMAN's merchants and shoppers). Data flywheels, where usage improves the product (Deepgram, Crunchbase), are another.
Network effect, virality or referral channel?
Three things are often shown under the same heading. A network effect exists when each additional user makes the product more valuable to existing users: a bill-splitting app with more of your friends on it, an interoperability standard that more of your counterparties use. Virality is a growth mechanism: users bring in other users, usually through invitations or sharing. A referral channel is a source of customers, such as clients recommending the service or professionals sending patients. Virality and referrals can exist without a network effect, and a network effect can exist without much virality.
The distinction matters because investors treat them differently. A network effect is a defensibility argument: it says a later competitor with the same product would be worth less to users. Referrals and virality are a cost-of-acquisition argument: they say customers are cheap to win. Both are valuable, but labelling a referral share as a network effect claims the stronger property without evidence for it.
The practical test is one question: what gets better for an existing user when a new one joins? If the honest answer is nothing, the slide is about acquisition and belongs next to channels and acquisition cost. If the answer is concrete (more people to split a bill with, more apps that talk to yours, more useful meetings in your city), state it and give a number that measures it, such as the share of activity that involves more than one user, or retention by the size of a user's network.
What evidence supports a network-effect claim
The strongest evidence shows the value to a user rising with the size of the network around them. Examples: retention or activity by number of connected users; match or fill rates by market size; the share of transactions involving participants from both sides; or, for interoperability products, the number of integrations a new customer can use on day one. None of the five slides added in this update shows such a measure directly; Lunch Club comes closest with a share of users invited across cities.
Weaker, but still useful, evidence is growth through the network: the share of new users invited by existing ones, or the share of customers referred by other customers. These show the network spreading, which is consistent with a network effect but does not prove one. Careerist's referral share and Lunch Club's invitation share are in this category, and the slides should say so rather than claim more.
Diagrams without counts, such as OpenFin's three clusters of sell side, buy side and vendors, can explain the mechanism clearly but leave the size of the network unknown. One number per side (firms on each side, apps in the ecosystem) turns a picture into evidence.
Common mistakes
Features in a circle. A cycle of activities is not a flywheel unless each causes the next.
The market's loop. Show where your company sits in it and how you benefit.
No evidence. Give one number that shows the loop turning.
"Network effect" as a label. Say who gets more value when another user joins.
Referrals called a network effect. Referral share is an acquisition measure; label it so.
Uncounted diagrams. Put a number on each side of the network.
Too many steps. Three or four steps are easier to believe than eight.
Diagnostic checklist
Every arrow means "causes".
The loop is the company's own.
At least one step has a measured number.
The slide says what improves with scale.
The type of loop (network, data, cost) is clear.
A non-specialist can repeat the loop in one sentence.
The slide says what improves for an existing user when a new one joins.
Referral and invitation shares are labelled as acquisition, with base and period.
Frequently asked questions
Is a high referral rate a network effect?
No. Referrals show customers are cheap to acquire. A network effect means each user gets more value as others join. Careerist's 25.18% referral share is a strong channel figure, not proof of a network effect.
How do I prove a network effect on a pitch deck?
Show value per user rising with network size: retention by number of connected users, match rates by market size, or integrations available to a new customer. Splitwise names the right test (retention by number of groups) but doesn't show the figures.
Can a diagram show a network effect?
It can explain the mechanism, as OpenFin's sell side, buy side and vendors diagram does, but it needs counts on each side to count as evidence.
How we chose these examples
Corpus: published pitch deck teardowns on StartupFundraising.com. Founder-uploaded private decks are excluded.
Selection (2026-09-24): we searched extracted text of slides 2–6 for flywheel, network effect, virtuous cycle and data loop, where a stored slide image exists, and inspected eight candidates. Seven were selected. Harvest slide 6 was excluded because its "virtuous cycle" describes a customer's debt repayment, not the company's growth loop. Nextdoor, Real Matters and Turtle Wise mention network effects only as a line in a list.
Update (2026-09-30): we searched the durable corpus index (70,729 unique pages) for "network effect" (42 public pages), excluded listed-company, SPAC and IR decks, and rendered eight candidates from the original deck files: Lunch Club 8, Splitwise 10, StuDocu 9, Pathrise 10, OpenFin 8, Careerist (arkive deck) 8, Examedi 7 and Chptr 10. Five were added. Left out: StuDocu 9 (a content, traffic and monetisation circle of the kind already covered by CommerceIQ; the deck is used in two other guides); Pathrise 10 (a list of benefits with no figures, repeating Splitwise's lesson); Chptr 10 (not read; the deck is already used in two guides).
Overlap check: the competition slide guide compares rivals; the business model guide covers how revenue is earned; the organic growth guide covers referral share as an acquisition metric. None covers whether a network-effect claim holds.
How we built this: drafted and checked with AI assistance (editorial model review against the original slide images, 2026-09-24 for the first seven examples and 2026-09-30 for the five added); no human editor has reviewed this guide.
Figures are the companies' own claims and have not been verified. We make no claim that any slide caused a fundraising outcome.