What a technology slide should prove that the product slide doesn't: performance against a baseline, what is proprietary, and why it's hard to copy.
Technology Slide: Real Pitch Deck Examples
Eight technology slides, shown in full, compare how companies explain what they have built underneath the product, and whether an investor could tell from the slide why it would be hard to copy.
TL;DR
A technology slide should show what the product slide can't: what you built that others can't easily copy, with evidence. That means performance against a named baseline, what is proprietary (patents, data, models, integrations), and what it lets the business do. The examples below split into two groups. Deep-tech slides (EnergyX, Envirogold) make measurable claims but often leave out the baseline or the test conditions. Software and tech-enabled-service slides (Azowo, Divvy Homes, Empowerly) describe capabilities but rarely say which parts are proprietary. Whichever group you are in, add the part that is missing.
Technology slides from real pitch decks
Each example shows the exact stored slide above its analysis and links to the full teardown. Performance and IP claims are the companies' own and have not been verified. Stage and year are given only where the slide states them.
EnergyX technology slide — slide 6
Lithium extraction and battery technology. Stage and year are not stated on the slide.
EnergyX deck, slide 6. Exact stored slide matched to this analysis.
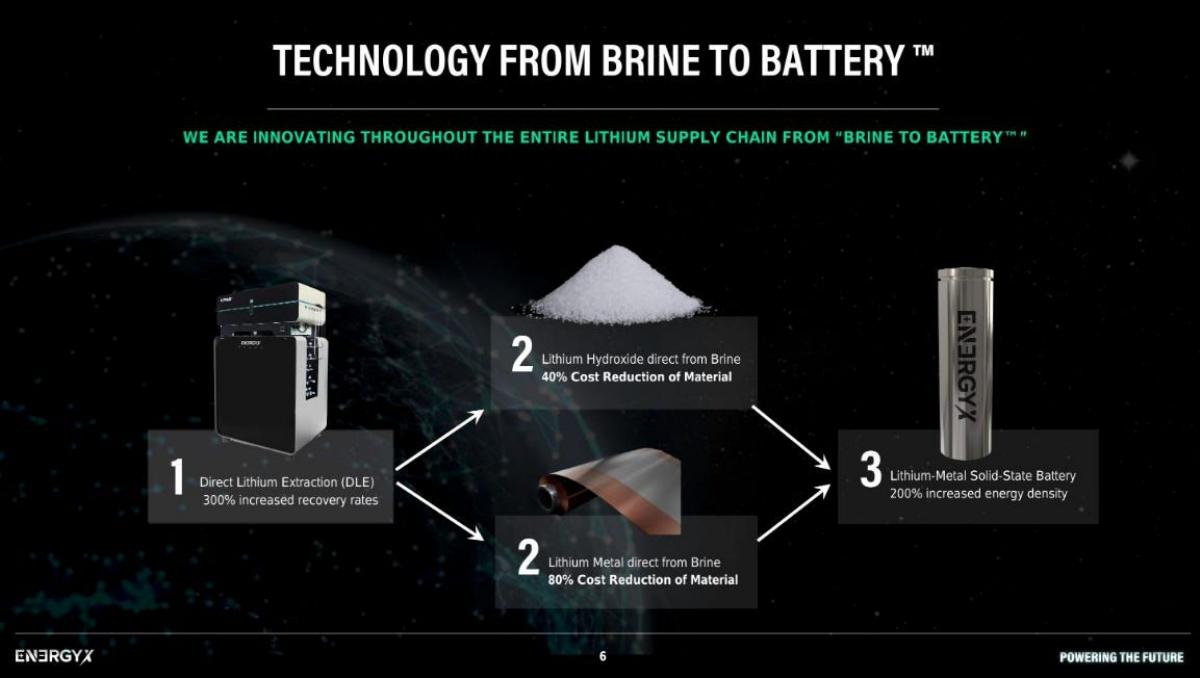
Our analysis: The flow shows how each technology feeds the next, so an investor sees a platform across the supply chain rather than a single process. Every step carries a number.
Evidence and limitation: None of the figures names a baseline (conventional evaporation ponds? today's lithium-ion cells?) or says whether it comes from lab, pilot or commercial results. "300% increased" could mean three or four times the baseline. State the comparison and the test stage.
What a founder can adapt: If you have several technologies, draw how they connect and give each one a single performance figure.
Supporting analysis
What the deck claims: "Technology from Brine to Battery™" in three numbered steps with images: (1) Direct Lithium Extraction, "300% increased recovery rates"; (2) lithium hydroxide direct from brine, "40% cost reduction of material", and lithium metal direct from brine, "80% cost reduction of material"; (3) a lithium-metal solid-state battery, "200% increased energy density".
Presentation choice: The flow shows how each technology feeds the next, so an investor sees a platform across the supply chain rather than a single process. Every step carries a number.
When it does not fit: None of the figures names a baseline (conventional evaporation ponds? today's lithium-ion cells?) or says whether it comes from lab, pilot or commercial results. "300% increased" could mean three or four times the baseline. State the comparison and the test stage.
Metal recovery from mine tailings and waste. Stage and year are not stated on the slide.
Envirogold Global deck, slide 4. Exact stored slide matched to this analysis.
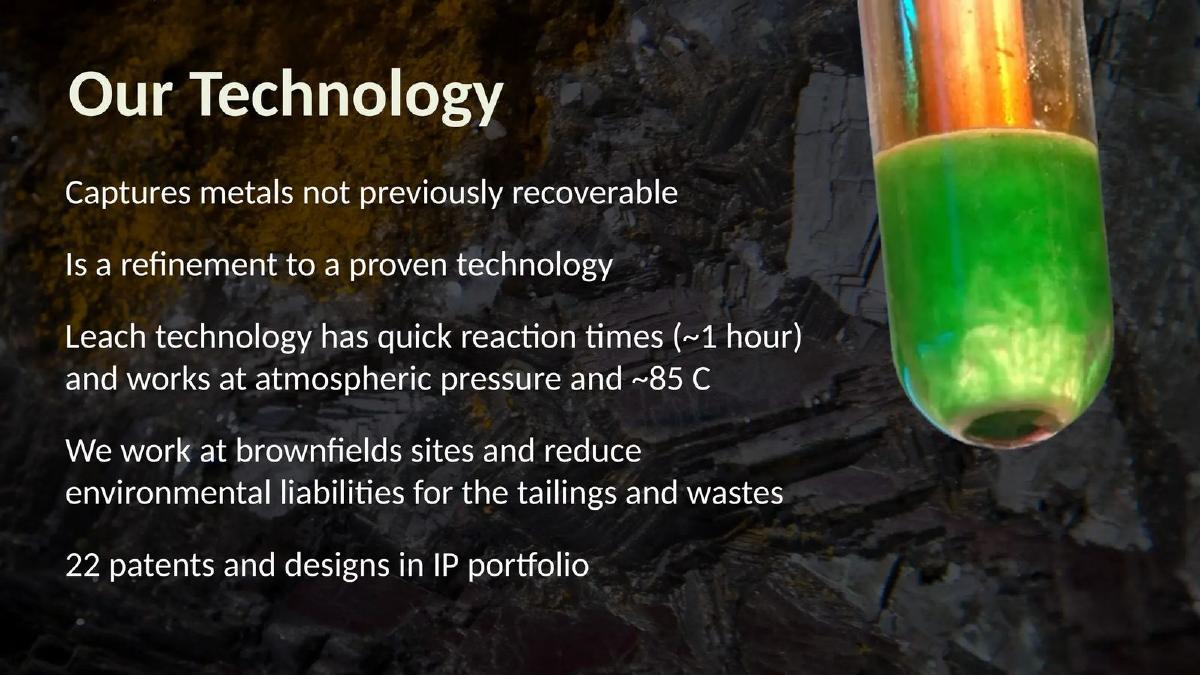
Our analysis: Operating conditions are concrete and useful to a technical investor: low pressure and moderate temperature suggest lower capital cost. Calling it a refinement of proven technology lowers perceived technical risk, and the IP count gives a measure of protection.
Evidence and limitation: "Patents and designs" mixes granted patents, applications and design rights. Say how many are granted and in which countries. "Not previously recoverable" needs a recovery rate.
What a founder can adapt: State how your process runs in plain physical terms, say what it builds on, and count your patents.
Supporting analysis
What the deck claims: "Our Technology" in five lines: captures metals not previously recoverable; "is a refinement to a proven technology"; leach technology with quick reaction times (about 1 hour) at atmospheric pressure and about 85 °C; works at brownfield sites and reduces environmental liabilities for tailings and waste; "22 patents and designs in IP portfolio".
Presentation choice: Operating conditions are concrete and useful to a technical investor: low pressure and moderate temperature suggest lower capital cost. Calling it a refinement of proven technology lowers perceived technical risk, and the IP count gives a measure of protection.
When it does not fit: "Patents and designs" mixes granted patents, applications and design rights. Say how many are granted and in which countries. "Not previously recoverable" needs a recovery rate.
Software platform for vehicle services. Stage and year are not stated on the slide.
Azowo deck, slide 5. Exact stored slide matched to this analysis.
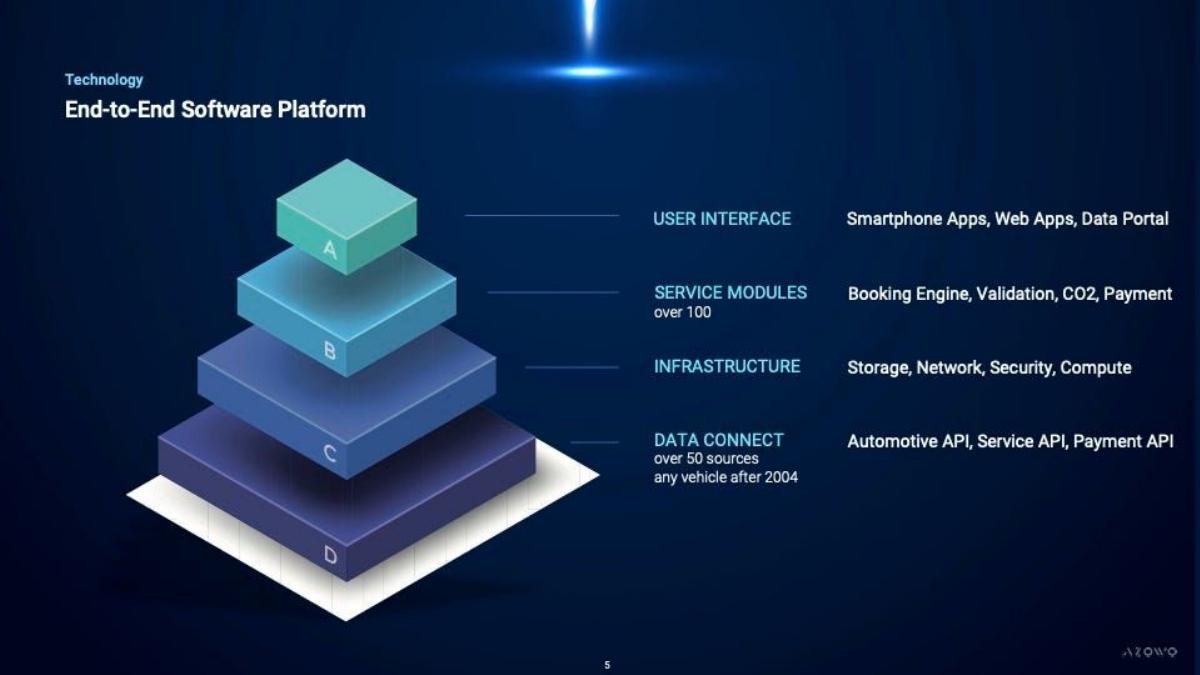
Our analysis: The layered drawing is easy to read, and the data-connect layer is the interesting one. Connecting to any vehicle built after 2004 through more than 50 sources is the kind of integration work that takes time to copy.
Evidence and limitation: Most layers (storage, security, compute) are standard for any software company. Highlight the layer that is proprietary and shrink the rest.
What a founder can adapt: If your advantage is integration depth, put the count and coverage on the slide, like the 50 sources and the vehicle years here.
Supporting analysis
What the deck claims: "Technology: End-to-End Software Platform" as a four-layer stack: user interface (smartphone apps, web apps, data portal); service modules, "over 100" (booking engine, validation, CO2, payment); infrastructure (storage, network, security, compute); and data connect, "over 50 sources, any vehicle after 2004" (automotive, service and payment APIs).
Presentation choice: The layered drawing is easy to read, and the data-connect layer is the interesting one. Connecting to any vehicle built after 2004 through more than 50 sources is the kind of integration work that takes time to copy.
When it does not fit: Most layers (storage, security, compute) are standard for any software company. Highlight the layer that is proprietary and shrink the rest.
Rent-to-own home purchasing. Stage and year are not stated on the slide.
Divvy Homes deck, slide 5. Exact stored slide matched to this analysis.
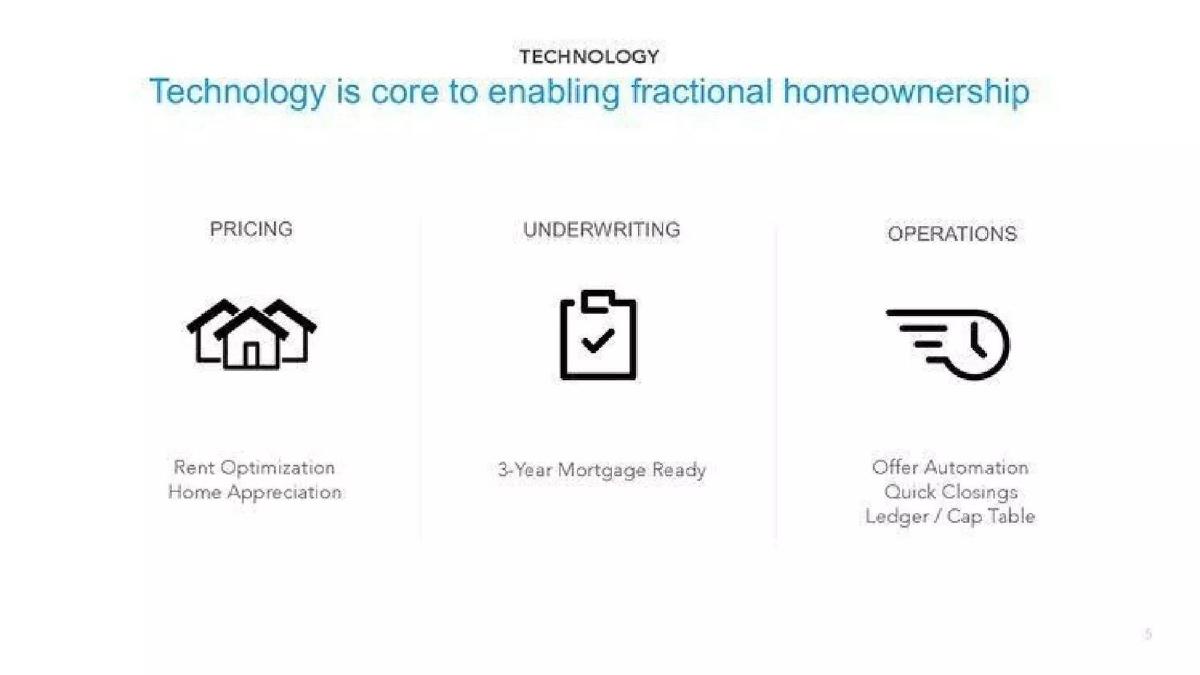
Our analysis: It tells investors this is a technology company, not only a property company, and names the three places where software does the work.
Evidence and limitation: There is no figure: how fast is a quick closing, how accurate is the pricing, how many customers become mortgage ready? Without numbers, a traditional operator could claim the same three columns.
What a founder can adapt: For a tech-enabled service, name the decisions your software makes, then give one result per decision.
Supporting analysis
What the deck claims: "Technology is core to enabling fractional homeownership" with three columns: pricing (rent optimization, home appreciation), underwriting ("3-year mortgage ready") and operations (offer automation, quick closings, ledger/cap table).
Presentation choice: It tells investors this is a technology company, not only a property company, and names the three places where software does the work.
When it does not fit: There is no figure: how fast is a quick closing, how accurate is the pricing, how many customers become mortgage ready? Without numbers, a traditional operator could claim the same three columns.
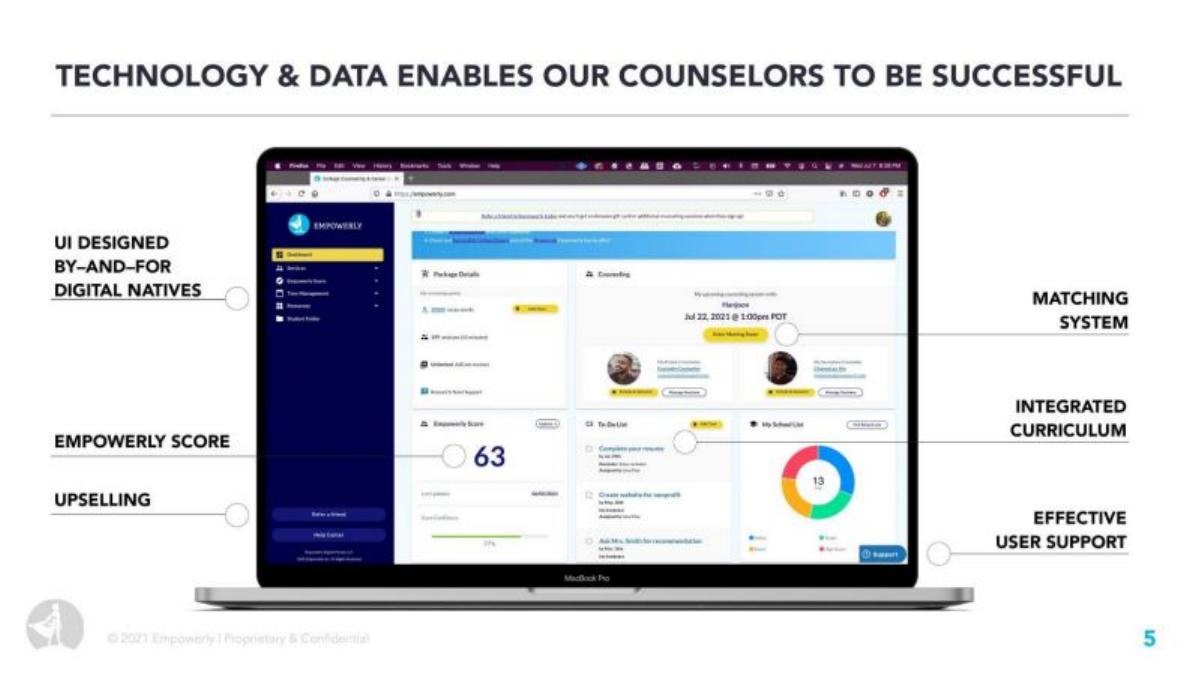
College-admissions counselling platform. The slide footer is dated 2021; stage is not stated.
Empowerly deck, slide 5. Exact stored slide matched to this analysis.
Our analysis: A real screenshot with callouts shows the system is built and used. Framing technology as support for human counsellors is honest for a service business.
Evidence and limitation: This is closer to a product slide than a technology slide. Nothing says what the matching system or score is based on, or how much more a counsellor can handle with it. Add one productivity figure.
What a founder can adapt: If people deliver your service, show the tool they use and label the parts that make each person more productive.
Supporting analysis
What the deck claims: "Technology & data enables our counselors to be successful" with a screenshot of the student dashboard, labelled: UI designed by and for digital natives, Empowerly Score, upselling, matching system, integrated curriculum and effective user support.
Presentation choice: A real screenshot with callouts shows the system is built and used. Framing technology as support for human counsellors is honest for a service business.
When it does not fit: This is closer to a product slide than a technology slide. Nothing says what the matching system or score is based on, or how much more a counsellor can handle with it. Add one productivity figure.
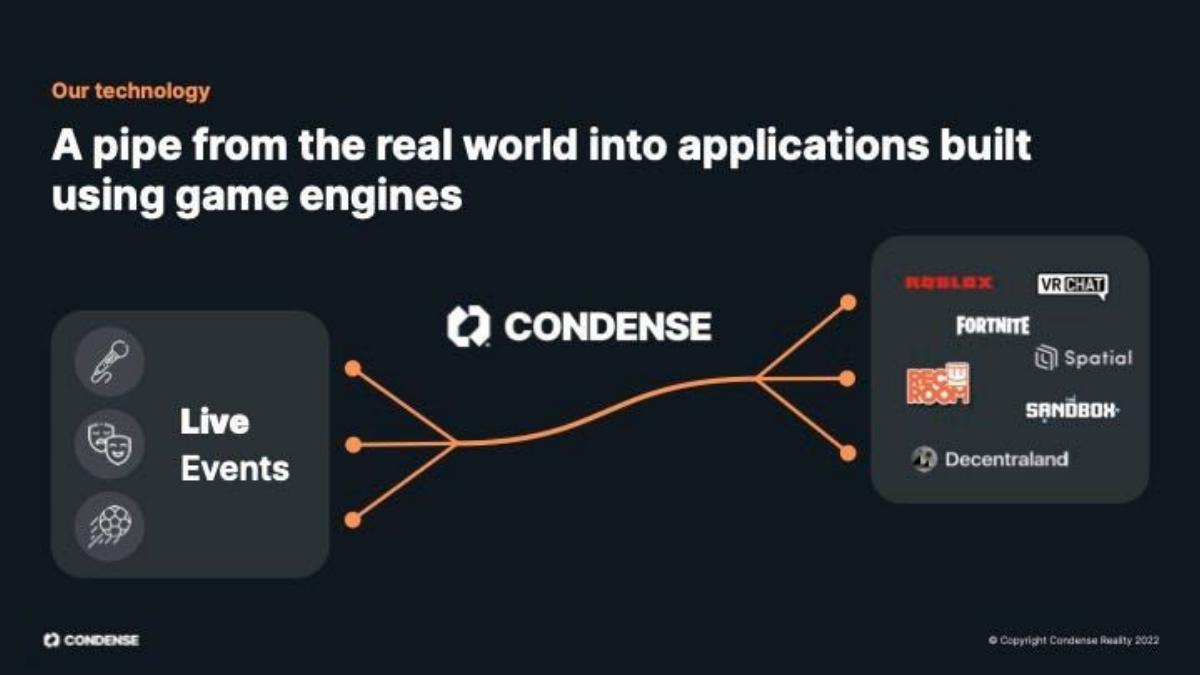
Live-event streaming into game engines. The slide footer is dated 2022; stage is not stated.
Condense deck, slide 5. Exact stored slide matched to this analysis.
Our analysis: One sentence and one diagram explain a complex technology to a non-specialist. The metaphor of a pipe makes the position in the value chain clear.
Evidence and limitation: The logos could be read as partners or live integrations. The slide doesn't say which are live, or what is hard about the pipe (capture, compression, latency). Label the status of each logo.
What a founder can adapt: Explain an unfamiliar technology with one plain metaphor and a simple input-to-output diagram.
Supporting analysis
What the deck claims: "Our technology: A pipe from the real world into applications built using game engines". Live events (music, theatre, sport) flow through Condense to platform logos: Roblox, VRChat, Fortnite, Spatial, Rec Room, Sandbox and Decentraland.
Presentation choice: One sentence and one diagram explain a complex technology to a non-specialist. The metaphor of a pipe makes the position in the value chain clear.
When it does not fit: The logos could be read as partners or live integrations. The slide doesn't say which are live, or what is hard about the pipe (capture, compression, latency). Label the status of each logo.
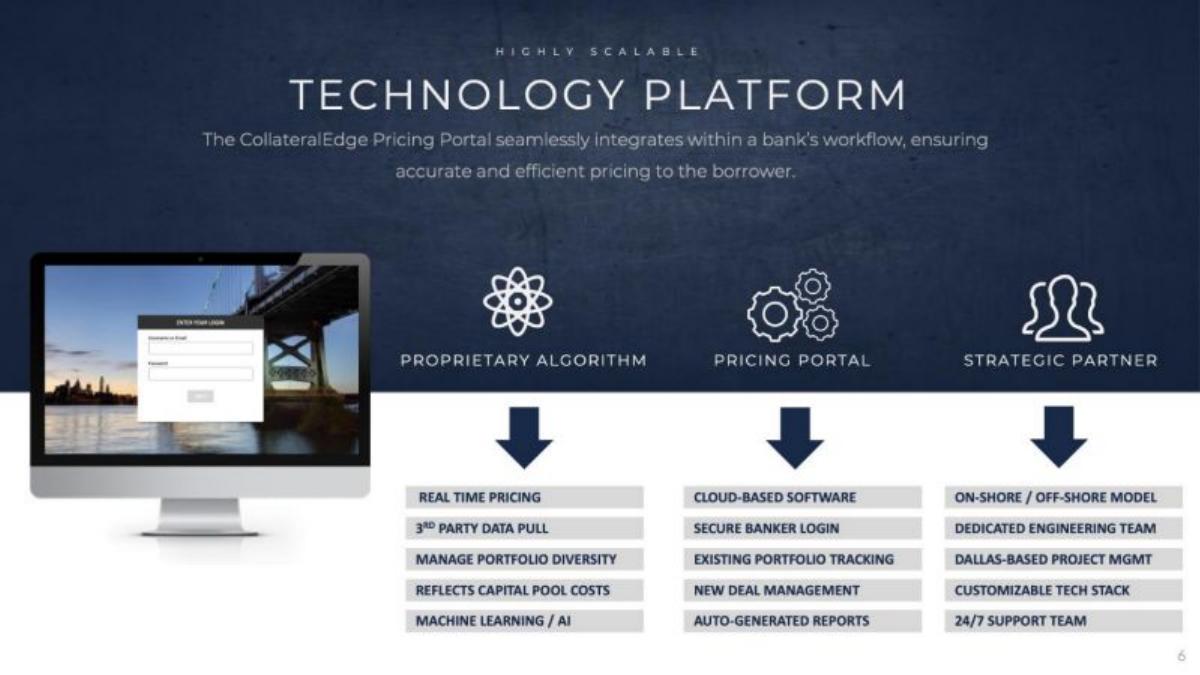
Loan-pricing software for banks. Stage and year are not stated on the slide.
CollateralEdge deck, slide 6. Exact stored slide matched to this analysis.
Our analysis: It covers algorithm, interface and delivery team in one slide, so investors see who builds and runs the system.
Evidence and limitation: Fifteen feature labels and a login screen give no evidence that the algorithm prices better than a bank's current method. "Machine learning / AI" as a bullet adds nothing. A pricing-accuracy or time-saved figure would.
What a founder can adapt: Treat this as a slide to improve on. Keep the three-column split, but replace feature lists with one figure per column.
Supporting analysis
What the deck claims: "Highly scalable technology platform": the pricing portal integrates with a bank's workflow. Three columns list features: proprietary algorithm (real-time pricing, third-party data pull, machine learning/AI and others), pricing portal (cloud-based software, secure login, reports) and strategic partner (onshore/offshore model, dedicated engineering team, 24/7 support). A login-screen mock-up sits on the left.
Presentation choice: It covers algorithm, interface and delivery team in one slide, so investors see who builds and runs the system.
When it does not fit: Fifteen feature labels and a login screen give no evidence that the algorithm prices better than a bank's current method. "Machine learning / AI" as a bullet adds nothing. A pricing-accuracy or time-saved figure would.
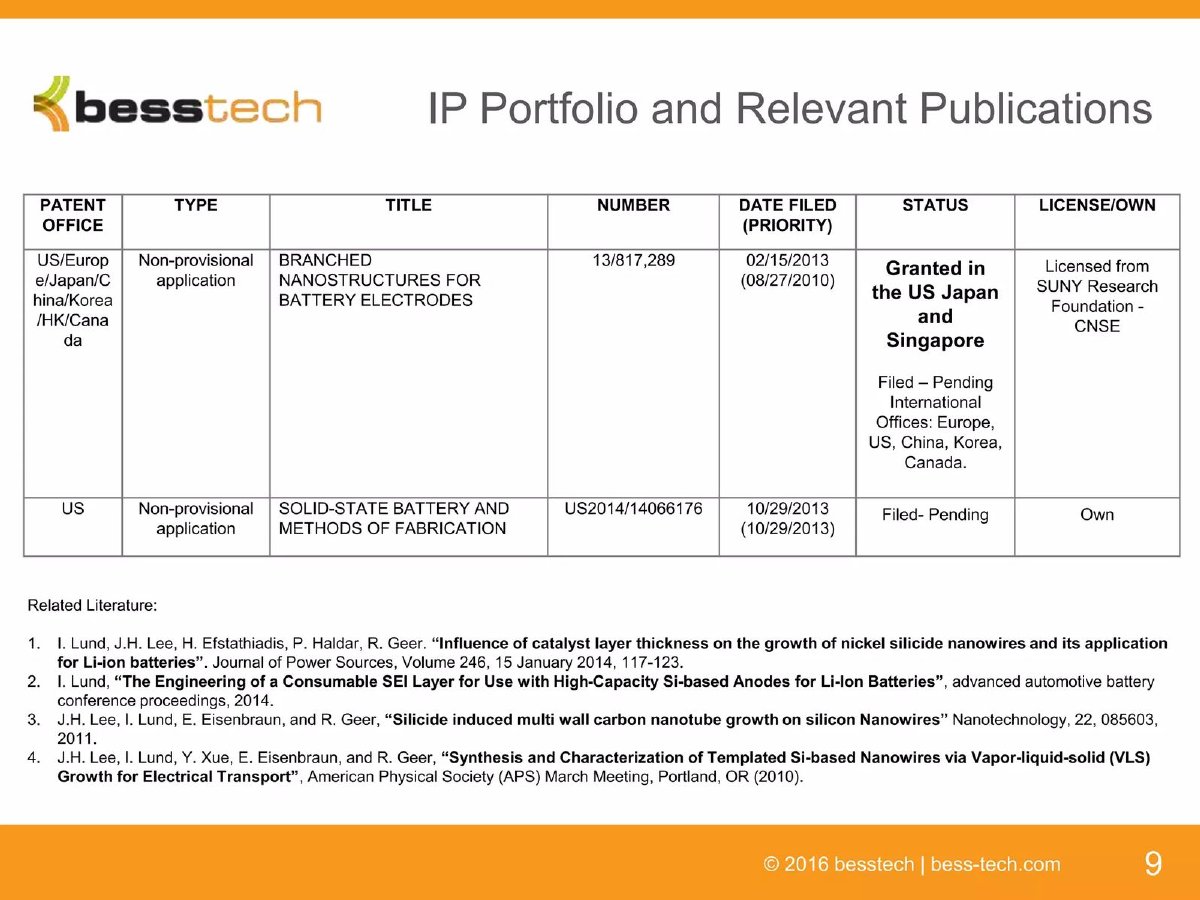
Besstech deck, slide 9. Exact stored slide matched to this analysis.
Our analysis: A patent table that states owned vs licensed and granted vs pending; licence terms are missing.
Evidence and limitation: The table keeps ownership and legal status in separate columns, which is uncommon. Read together: the granted rights are licensed, and the one company-owned item is a pending US application. The slide doesn't say whether the licence is exclusive, its field or territory, or its term. "Granted" and "Pending" for different offices sit under one application number, so which number was granted where isn't stated. Publications by team members show expertise, not company-owned rights. Status is as of the deck's date (2016) and may have changed.
What a founder can adapt: Add a column for licence terms ("exclusive, field: battery anodes, to [year]") and list each granted patent number with its country.
Supporting analysis
What the deck claims: Row 1: "Branched nanostructures for battery electrodes", 13/817,289, filed 02/15/2013 (priority 08/27/2010), type "Non-provisional application", status "Granted in the US Japan and Singapore" and "Filed – Pending" in "International Offices: Europe, US, China, Korea, Canada", "Licensed from SUNY Research Foundation - CNSE". Row 2: "Solid-state battery and methods of fabrication", US2014/14066176, filed 10/29/2013, "Filed- Pending", "Own". Below: four related publications with co-author names.
Presentation choice: An investor can see exactly which protection the company controls and which it depends on a licensor for.
When it does not fit: Don't call a portfolio "our patents" when the granted ones are licensed, and don't count pending applications as granted.
What each technology slide proves, and what it leaves out
Choose the approach that matches where your advantage comes from, then fill the gap.
Approach
Example
Proves
Fits when
Add
Process flow with performance figures
EnergyX
A connected platform with measurable gains
Deep tech across several steps
Baseline and test stage for each figure
Operating conditions plus IP count
Envirogold
Feasibility and protection
Industrial process technology
Granted vs pending patents, recovery rate
Layered architecture with counts
Azowo
Integration depth
Advantage comes from connections or data coverage
Highlight the proprietary layer only
Decisions software makes
Divvy Homes
Tech drives the service
Tech-enabled service
One result per decision
Labelled screenshot
Empowerly
The system exists and is used
People deliver the service with your tool
A productivity figure
Metaphor and simple diagram
Condense
Where you sit in the value chain
Unfamiliar technology
Status of each integration
Key Takeaways
Give every performance claim a baseline. EnergyX claims "300% increased recovery rates" and "200% increased energy density", but not compared with what, or measured how.
Count your proprietary assets and say what they protect. Envirogold lists "22 patents and designs in IP portfolio" beside concrete operating conditions (about 1 hour, atmospheric pressure, about 85 °C).
Architecture diagrams need numbers to matter. Azowo's stack becomes more credible with "over 100" service modules and "over 50 sources" of vehicle data.
For tech-enabled services, tie each system to a business result. Divvy Homes names pricing, underwriting and operations, but gives no speed, accuracy or cost figure for any of them.
Show integrations as facts, not possibilities. Condense shows platform logos (Roblox, Fortnite, VRChat and others) without saying which are live integrations.
Build your technology slide
If you can't answer the second and third prompts, you may not need a technology slide.
What. In one sentence, what have you built that sits under the product?
Proof. What is your best performance figure, compared with what, and measured at what stage (lab, pilot, customers)?
Protection. What is proprietary: granted patents, unique data, trained models, integrations? Give counts.
So what. What does it let the business do: lower cost, higher margin, faster delivery?
Copyable framework: [Technology] does [function]. [Metric] vs [baseline], measured in [lab/pilot/production]. Protected by [n granted patents / n data sources / n integrations]. This lets us [business outcome].
After: Our model prices [loans] in [x] seconds vs [y] days today, tested on [n] of [customer]'s loans in [year]. Trained on [n] records no competitor holds. Cuts pricing cost per loan by [z]%.
What improved: Our illustrative rewrite, not any company's text. It replaces generic labels with a baseline comparison, a test stage and a data advantage; bracketed values are placeholders.
Technology slide vs product slide
The product slide shows what a user sees and does. The technology slide shows what sits underneath and why a competitor with money and engineers couldn't reproduce it quickly. If your technology slide could be swapped with your product slide without anyone noticing, one of them isn't doing its job.
Not every deck needs one. If the advantage is distribution, brand or operations, a technology slide full of generic terms (cloud-based, AI, scalable) weakens the deck. Include it when the technology is the reason you will win.
How customer data is stored and protected is a different question from what is proprietary. If your buyers or partners ask about it, our guide to data privacy and security in a pitch deck compares seven real slides that state a standard, its status and how data is handled. Which standards apply, if any, depends on your customers, the data you hold and where you sell.
Owned, licensed, granted, pending: four separate facts
A patent line on a slide mixes two independent questions. Who holds the rights: the company, or a university or other owner that licenses them to you? And what is the legal status: an application that is pending, or a patent granted in named countries? A granted patent you license and a pending application you own are very different assets. Give both attributes for every item, plus the jurisdictions.
A patent or licence on its own does not show that the patent is valid, that the licence is exclusive, or that you are free to sell without infringing someone else's rights (freedom to operate). If you have a freedom-to-operate opinion or an exclusive licence, say so; if not, don't imply it.
Common mistakes
Figures without baselines. "300% better" needs "than what" and "measured how".
Generic stack layers. Storage and security are not your advantage; shrink them.
"AI" as a feature. Say what the model decides and how well.
Logos implying integrations. Label which are live, in pilot or planned.
Mixing patents and applications. Separate granted, pending and design rights.
Diagnostic checklist
The slide shows something the product slide doesn't.
Every performance figure names a baseline and test stage.
Proprietary assets are counted and described.
Standard infrastructure is minimised.
The link from technology to a business result is stated.
A non-specialist can understand the headline in one reading.
Frequently asked questions
How we chose these examples
Corpus: published pitch deck teardowns on StartupFundraising.com. Founder-uploaded private decks are excluded.
Selection (2026-09-24): we searched extracted text of slides 2–6 for slides titled technology, our technology or similar, where a stored slide image exists, and inspected eight candidates. Seven were selected. 7 Bridges slide 6 was excluded because it is a why-now slide (its own heading), despite a "Tech" column. Divvy Homes' team slide appears in the team guide; this page uses a different slide from the same deck.
Overlap check: the product slide guide already covers how-it-works and user-journey slides, so a separate how-it-works page was rejected. This page covers what sits underneath the product.
Review: all seven stored slide images were inspected on 2026-09-24 and matched to company, deck and slide number (editorial model review). No person has yet completed an editorial review of this page.
Performance, patent and integration claims are the companies' own and have not been independently verified. We make no claim that any slide caused a fundraising outcome.