Divvy Homes presents a compelling case for fractional homeownership, targeting the 6 million credit-worthy households currently locked out of the market (Slide 3). The deck is notable for its early emphasis on the founding team's pedigree in capital markets and technology (Slide 2) and a clear, albeit redacted, breakdown of annual unit economics that separates rent from equity (Slide 6). While the deck successfully communicates a complex financial product through simple visuals, it notably omits a specific 'Ask' slide and detailed competitor analysis. Instead, it focuses on the scalability of…
Key takeaways
- The problem is quantified as 6 million credit-worthy households that are not yet homeowners (Slide 3).
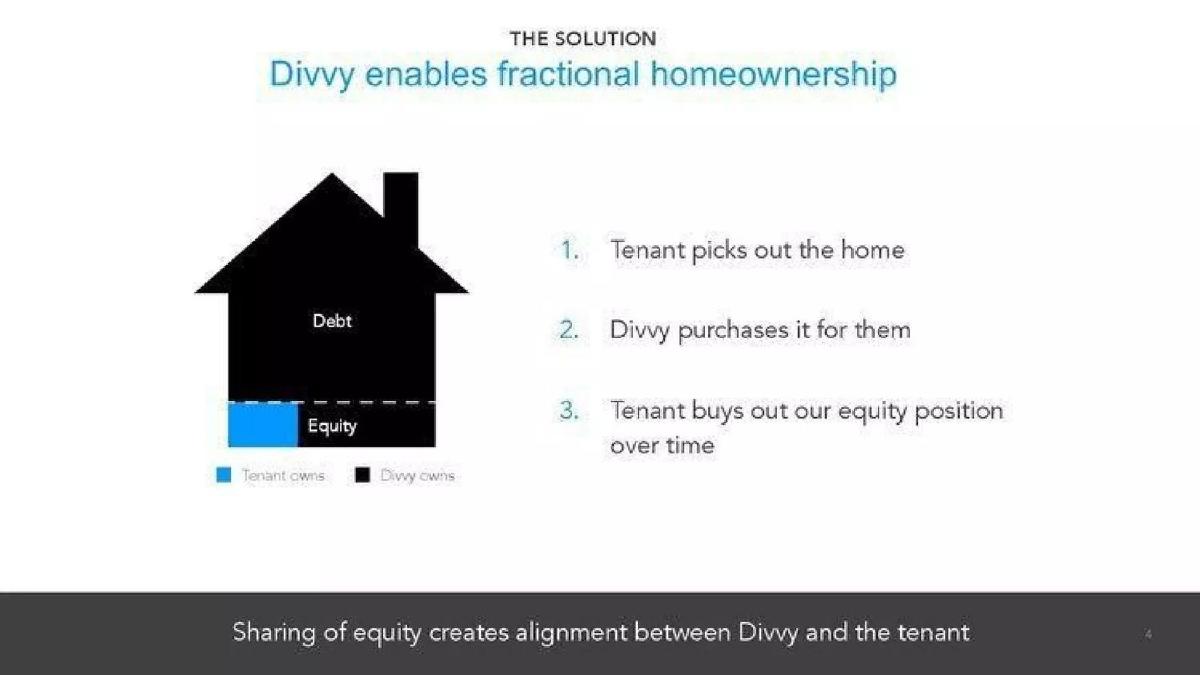
- The business model relies on a three-step process: tenant picks the home, Divvy buys it, and the tenant buys out equity over time (Slide 4).
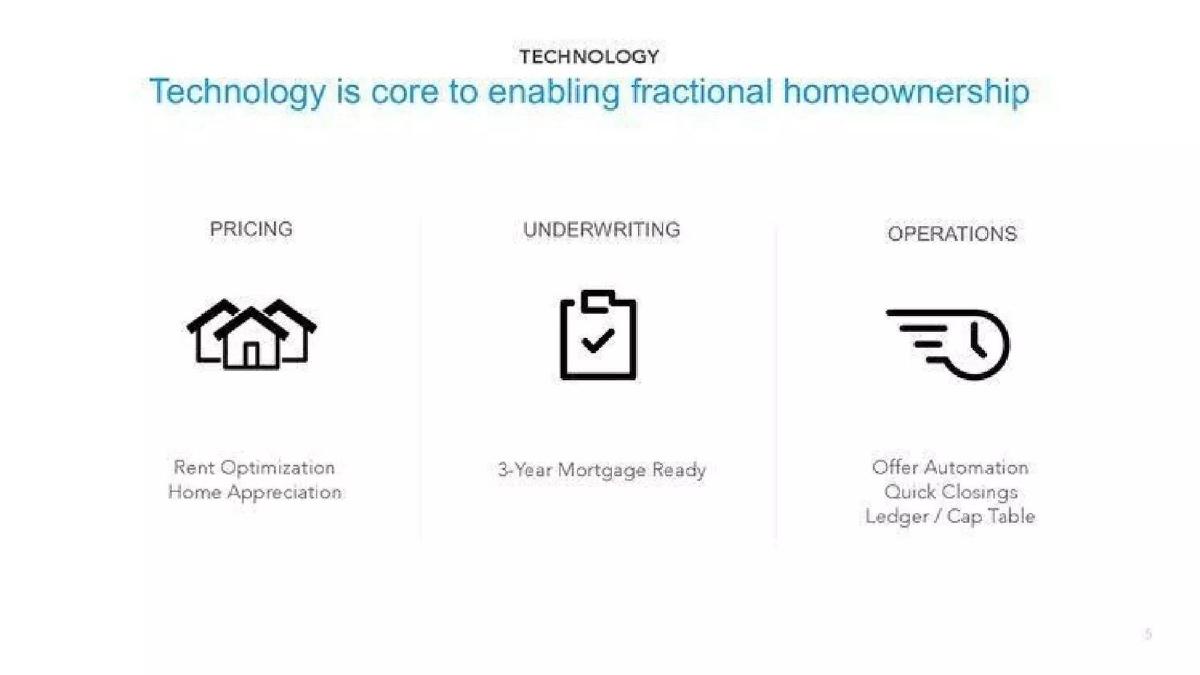
- Technology is applied to three specific areas: pricing optimization, underwriting for mortgage readiness, and operational automation (Slide 5).
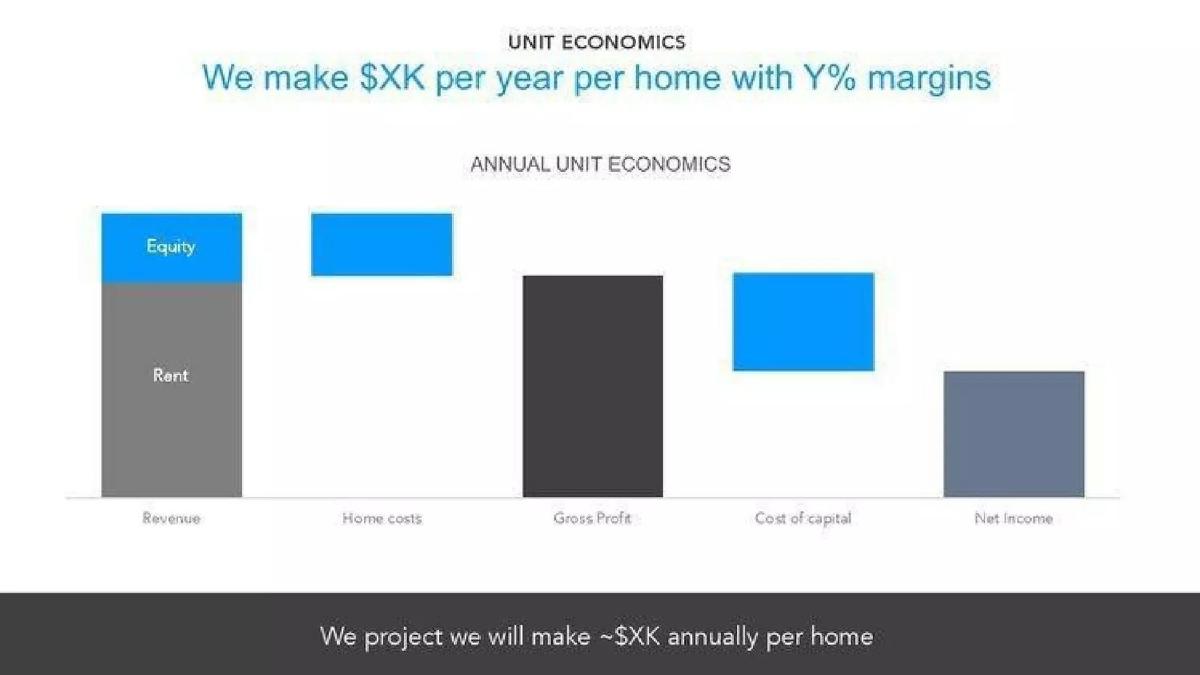
- Unit economics are visualized as a waterfall chart showing the path from revenue to net income, though specific dollar amounts are redacted (Slide 6).
- Distribution is driven by a referral loop where 180 agents refer an average of 7 clients each (Slide 8).
- Traction is shown via a 'Monthly Homes Closed' bar chart, indicating consistent growth from November 2017 to April 2018 (Slide 9).
- The expansion strategy targets high-yield markets like Chicago, IL (7,500 homes annually) and Pittsburgh, PA (6,000 homes annually) (Slide 10).
- The capital strategy involves transitioning from high-net-worth individuals to bank partners and eventually off-balance-sheet financing (Slide 11).
The Divvy Homes Series A Teardown
Divvy Homes occupies a unique space in the proptech sector, blending fintech, real estate, and capital markets. This 14-slide deck, used for their $30 million Series A in 2018, is a study in how to present a capital-heavy business model as a scalable technology platform. The deck avoids dense text in favor of clear diagrams and high-level thematic headers.
The Foundation: Vision and Team
Slide 1: Title The deck opens with a simple, dark-themed slide featuring the Divvy logo and the tagline: "Access to home ownership. For everyone." It includes the date, April 2018, which anchors the deck in the company's early growth phase.
Slide 2: Team Unusually, the team slide appears second. This is a strategic choice for a company requiring significant trust and capital. It highlights a "Combination of real estate, capital markets and technology." Brian Ma (CPO) is noted as a repeat founder with experience at Zillow; Adena Hefets (CEO) brings a background from Square Capital, TPG, and BAML; Nicholas Clark (CTO) is listed as a former CTO at DoubleDutch and a senior engineer at Microsoft. The pedigree here is designed to signal to Series A investors that the founders understand both the software and the complex financial structures required to buy thousands of homes.
Defining the Market and Solution
Slide 3: The Problem The problem is stated with extreme brevity: "6 million credit-worthy households should be homeowners, but aren't." By using a specific number, Divvy establishes the scale of the addressable market without needing a traditional TAM/SAM/SOM slide at this stage.
Slide 4: The Solution This slide introduces the concept of "fractional homeownership." A simple house icon shows a breakdown of Debt and Equity. The process is three steps: 1. Tenant picks the home, 2. Divvy purchases it for them, 3. Tenant buys out the equity position over time. The footer emphasizes that this "Sharing of equity creates alignment between Divvy and the tenant."
Slide 5: Technology To justify its venture valuation, Divvy must prove it is more than a real estate holding company. This slide breaks technology into Pricing (Rent Optimization), Underwriting (3-Year Mortgage Ready), and Operations (Offer Automation). It positions software as the engine that allows them to scale these traditionally manual real estate tasks.
Economics and Growth Strategy
Slide 6: Unit Economics The deck uses a waterfall chart to explain how they "make $XK per year per home with Y% margins." While the specific figures are redacted for the public version of the deck, the structure is clear: Revenue (Rent + Equity) minus Home Costs equals Gross Profit. Net Income is then derived after the Cost of Capital. This transparency regarding the cost of capital is essential for this business model.
Slide 7: Value Proposition This slide compares the benefits for Divvy versus the Tenant. For Divvy, the claim is "2.5x Higher income than REITs" and a status as "Landlords, not lenders." For the tenant, it offers "Gradual exposure to homeownership" and a "Delightful buying experience."
Slide 8: Distribution Divvy illustrates a referral flywheel. It claims "20 net new agents and teams join every week" and "180 agents refer on average 7 clients." This indicates that Divvy isn't just spending on direct-to-consumer ads; they are leveraging the existing real estate agent ecosystem to acquire customers.
Traction and Scalability
Slide 9: Traction A bar chart titled "Monthly Homes Closed" shows growth from November 2017 through a "Run-Rate Apr '18." The footer notes that "X Homes closed in 3 months, with a backlog of Y customers," proving that demand outstrips their current capacity to purchase.
Slide 10: Market Expansion A map of the US highlights "stable, high-yield markets." It lists 10 cities with their annual home potential and median prices. For example, Chicago is listed at 7,500 homes annually with a $225K median price, while Memphis is at 3,000 homes with a $120K median price. This demonstrates a clear, data-driven expansion roadmap.
Slide 11: Credit Facility This is perhaps the most important slide for a Series A proptech company. It outlines the path to scaling capital: Step 1 (Validate) using high-net-worth individuals; Step 2 (Growth) using bank partners; and Step 3 (Scale) moving to an "Off Balance Sheet" model. This shows investors that the founders have a plan to move away from expensive equity capital to cheaper debt capital as the business matures.
The Close
Slide 12: Product Demo A placeholder slide for a product demonstration, likely where the founders showed the interface tenants use to select homes and track their equity.
Slide 13: The Future Divvy positions itself as a "new asset class of fractional home ownership." It compares "Divvy-Occupied" properties to traditional renter-occupied and owner-occupied homes, claiming their model leads to fewer defaults, lower operating costs, and higher yields.
Slide 14: Mission The deck concludes with a mission statement: "Helping 100,000 families purchase their first Divvy home." It’s a standard closing that returns to the human impact of the business.
What Works in the Divvy Homes Deck
The deck excels at simplifying a complex financial product . The use of the house icon on Slide 4 to explain equity sharing is much more effective than a paragraph of text. Additionally, the Team Slide placement (Slide 2) is a strong move. In a business where you are asking for millions to buy physical assets, the credibility of the people managing that money is the primary concern for an investor.
The Distribution Flywheel (Slide 8) is another highlight. It shows that the company has found a way to acquire customers through B2B partnerships (real estate agents) rather than just expensive B2C marketing. This suggests a more sustainable path to growth.
What is Missing from the Divvy Homes Deck
The most glaring omission is a Competitor Slide . In 2018, other companies were exploring rent-to-own or alternative financing models. Divvy does not address how they differ from traditional mortgage lenders or other proptech startups. There is also no explicit 'Ask' slide . While we know from the catalogue that they raised $30M, the deck itself does not state the amount being raised or the specific milestones that capital will achieve.
Furthermore, while the Unit Economics (Slide 6) are structured well, the deck lacks a deep dive into the risks associated with a housing market downturn. For a company that owns the underlying assets, a drop in home prices is a significant risk that isn't addressed in these 14 slides.
What a Founder Should Copy
Founders in capital-intensive industries should copy the Credit Facility roadmap (Slide 11). It is not enough to say you will buy assets; you must show how the cost of those assets will decrease as you scale. This slide speaks the language of institutional investors.
Also, the Market Expansion slide (Slide 10) is a great template for any company moving into physical territories. By listing the median home price and the annual volume per city, Divvy proves they have done the granular research necessary to succeed in local markets, rather than just assuming a national average.
Frequently asked questions
- How does Divvy Homes make money according to the deck?
- Slide 6 illustrates that revenue is generated through a combination of rent and equity payments. The company calculates gross profit by subtracting home costs from this revenue, and net income is determined after accounting for the cost of capital. Slide 7 further notes that Divvy generates 2.5x higher income than traditional Real Estate Investment Trusts (REITs) by acting as a landlord rather than a lender.
- What is the core technology behind the platform?
- According to Slide 5, technology is integrated into three pillars: Pricing (rent optimization and home appreciation), Underwriting (ensuring tenants are 3-year mortgage ready), and Operations (offer automation, quick closings, and managing the ledger/cap table for each property). This suggests the 'tech' in this proptech play is primarily focused on financial modeling and transaction speed.
- What is the significance of the 'Credit Facility' slide?
- Slide 11 is critical for a capital-intensive business like Divvy. it outlines a three-step evolution of their capital markets practice. They start by validating with high-net-worth individuals, move to growth via bank partners, and aim for 'Scale' by moving assets off-balance-sheet. This roadmap shows investors how the company intends to lower its cost of capital over time to improve margins.
- Who is the target customer for Divvy?
- The deck identifies the target as 'credit-worthy households' who are currently not homeowners (Slide 3). The value proposition for these tenants is gradual exposure to homeownership and a 'delightful buying experience' (Slide 7). By allowing tenants to buy out Divvy's equity position over time (Slide 4), they cater to those who can afford monthly payments but may lack a traditional down payment.
- What markets does Divvy prioritize for expansion?
- Slide 10 shows a focus on 'stable, high-yield markets' primarily in the Midwest and South. Key targets include Chicago (7,500 homes), Pittsburgh (6,000 homes), and Baltimore (5,000 homes). The slide lists specific median home prices for these areas, ranging from $120K in Memphis to $270K in Baltimore, suggesting a focus on affordable, middle-market housing.