This October 2014 deck captures WeWork at a pivotal moment, transitioning from a New York-centric co-working startup into a global 'Space as a Service' platform. With 15,000 members and $74.6 million in projected 2014 revenue, the company pitched a vision of high-margin (41% EBITDA) physical spaces powered by a 'proprietary tech' stack. The deck is notable for introducing 'WeLive' as a massive residential expansion and detailing an 'Asset Light' strategy where landlords fund the majority of build-out costs. It uses aggressive run-rate projections and community-driven 'flywheels' to justify it…
Key takeaways
- WeWork positioned itself as a 'Space as a Service' (SaaS) platform to earn tech-industry valuation multiples.
- The business model relied on 'Clustering' to fit 4x as many workers into the same space as traditional offices.
- By 2014, the company was shifting toward 'Asset Light' deals where landlords paid up to 75% of the capital expenditure.
- Services (healthcare, HR, payments) were projected to grow from $28/member to $75/member to boost non-real estate revenue.
- WeLive was introduced as a major residential expansion with a $110 billion projected TAM in the US.
- The deck claimed a 'Network Effect' where more members led to better landlord deals and improved marketplace services.
- At the time of the deck, WeWork had 15,000 members and 20 open locations, with NYC representing over 60% of the membership.
What this deck actually is
The October 2014 WeWork pitch deck is a masterclass in "narrative-driven financial engineering." At its core, this is a Series D / late-stage growth deck designed to reclassify a capital-intensive real estate business as a high-margin, asset-light technology platform. The single most important finding in this deck is the aggressive use of projected "run-rate" economics and mature location margins to mask the heavy capital requirements of a rapidly expanding physical footprint.
The deck attempts to sell a "Space as a Service" (SaaS) model, borrowing the valuation multiples of the software industry while operating in the physical world of long-term leases and tenant improvements. It establishes a "flywheel" effect where community density leads to service monetization, eventually pitching an expansion into residential living (WeLive) to capture an even larger share of a member's wallet. Quantitatively, the deck relies on a "mature location" unit EBITDA of 41% to project a path to a $1 billion revenue run-rate by 2016, despite only having $74.6 million in projected revenue for 2014.
Slide-by-slide walkthrough
Slide 1: Title Slide
The deck opens with the mantra "Do What You Love" set against a black and white photograph of a business card on wood grain. This sets a lifestyle-brand tone rather than a corporate real estate one. The date is clearly marked as October 2014.
An investor sees this and immediately understands the target demographic: the "creative class" and entrepreneurs who value aesthetics and "soul" in their workspace. The branding is minimalist and suggests a premium, curated experience. It signals that WeWork does not view itself as a landlord, but as a community builder.
The strongest version of a title slide for a late-stage company would include a sub-headline summarizing the current scale (e.g., "Powering 15,000 members across 7 cities"). While the emotional hook is strong, the "October 2014" text is the only hard data point here.
Slide 2: Company Overview & Key Facts
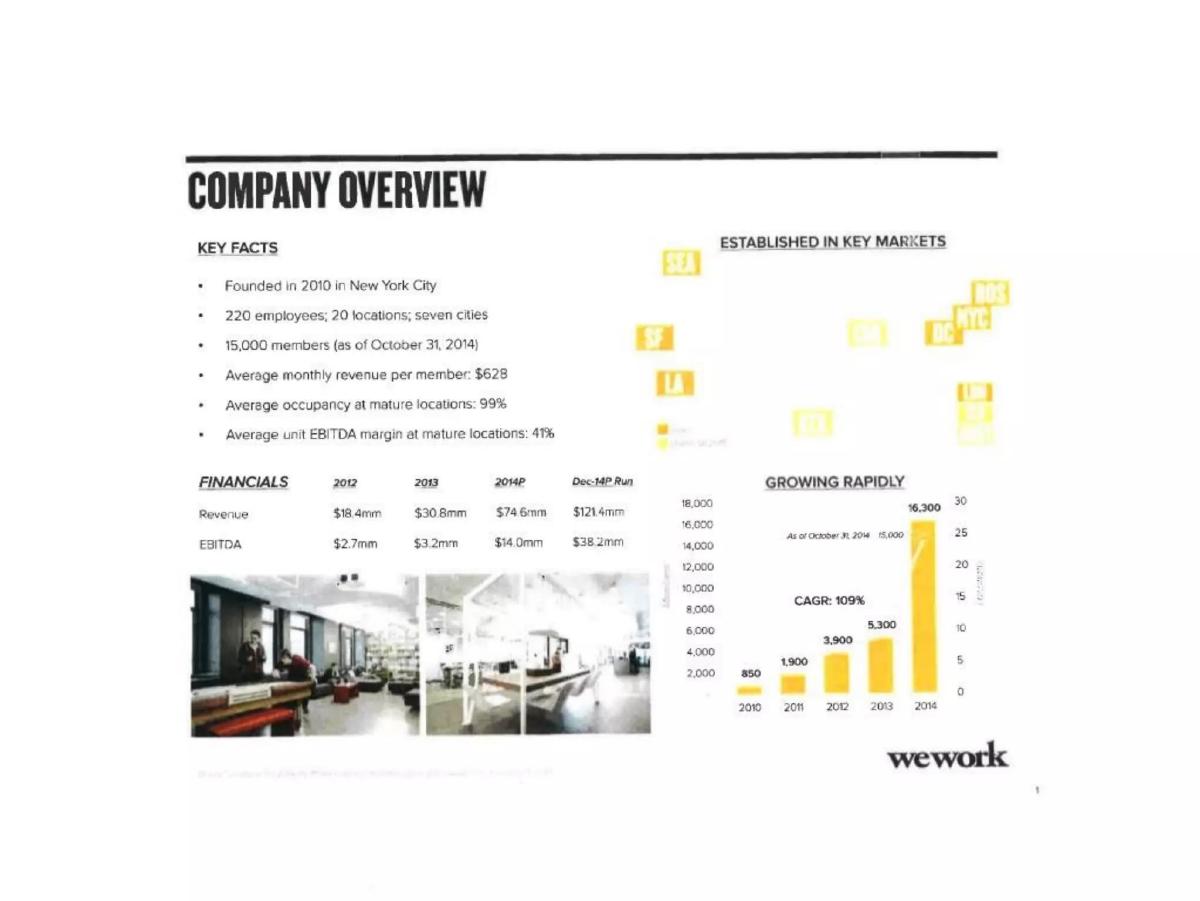
This is a "traction" slide that combines historical growth with current unit economics. It lists 20 locations, 15,000 members, and a 99% occupancy rate at "mature locations." The financial table shows revenue growing from $18.4mm in 2012 to a projected $74.6mm in 2014, with a "Dec-14P Run" revenue of $121.4mm.
Investors look at the 109% CAGR and the "Average unit EBITDA margin at mature locations: 41%." This 41% figure is critical—it suggests that once a building is filled, it becomes a high-margin cash cow. However, the distinction between "mature" and "new" locations is a way to hide the losses from the 14 signed locations currently under development mentioned later in the deck.
The strongest version of this slide would define "mature." Does maturity happen at 6 months, 12 months, or 24 months? Without that definition, the 41% margin is a cherry-picked figure that may not reflect the actual consolidated profitability of the company.
Slide 3: Space as a Service
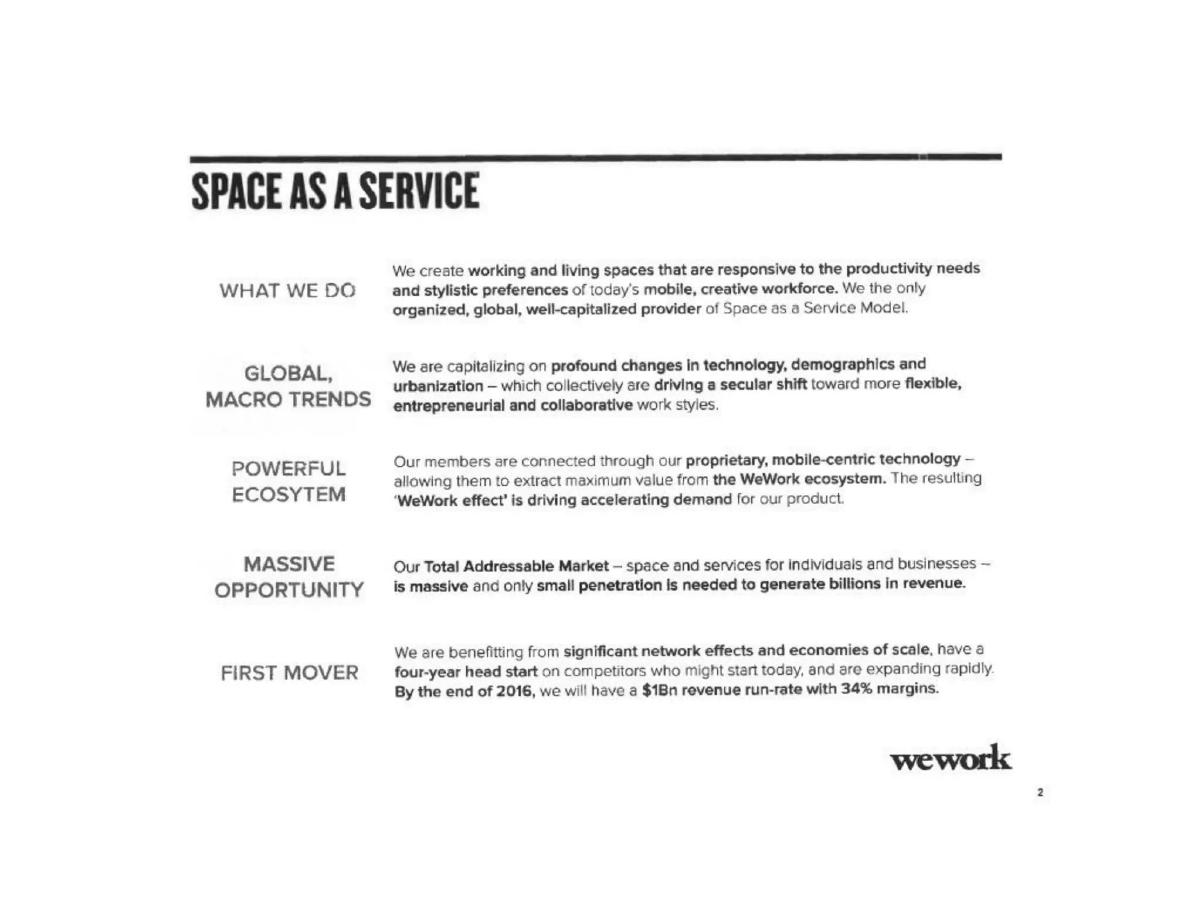
This slide introduces the "Space as a Service" (SaaS) terminology. It outlines five pillars: Macro Trends, Powerful Ecosystem, Massive Opportunity, First Mover, and Global/Well-Capitalized provider status. It concludes with a bold projection: a $1Bn revenue run-rate by 2016 with 34% margins.
The language is designed to trigger "tech-speak" reflexes in venture capitalists. By using terms like "network effects," "proprietary technology," and "secular shift," WeWork is positioning itself as a platform rather than a sub-leaser. The promise of 34% margins at a $1Bn scale is an attempt to justify a software-style valuation multiple.
A stronger version would provide evidence for the "proprietary, mobile-centric technology" mentioned. At this stage in the deck, the technology claim is an assertion without proof, making it feel like "tech-washing" for a real estate play.
Slide 4: Millennials are Redefining the Workforce
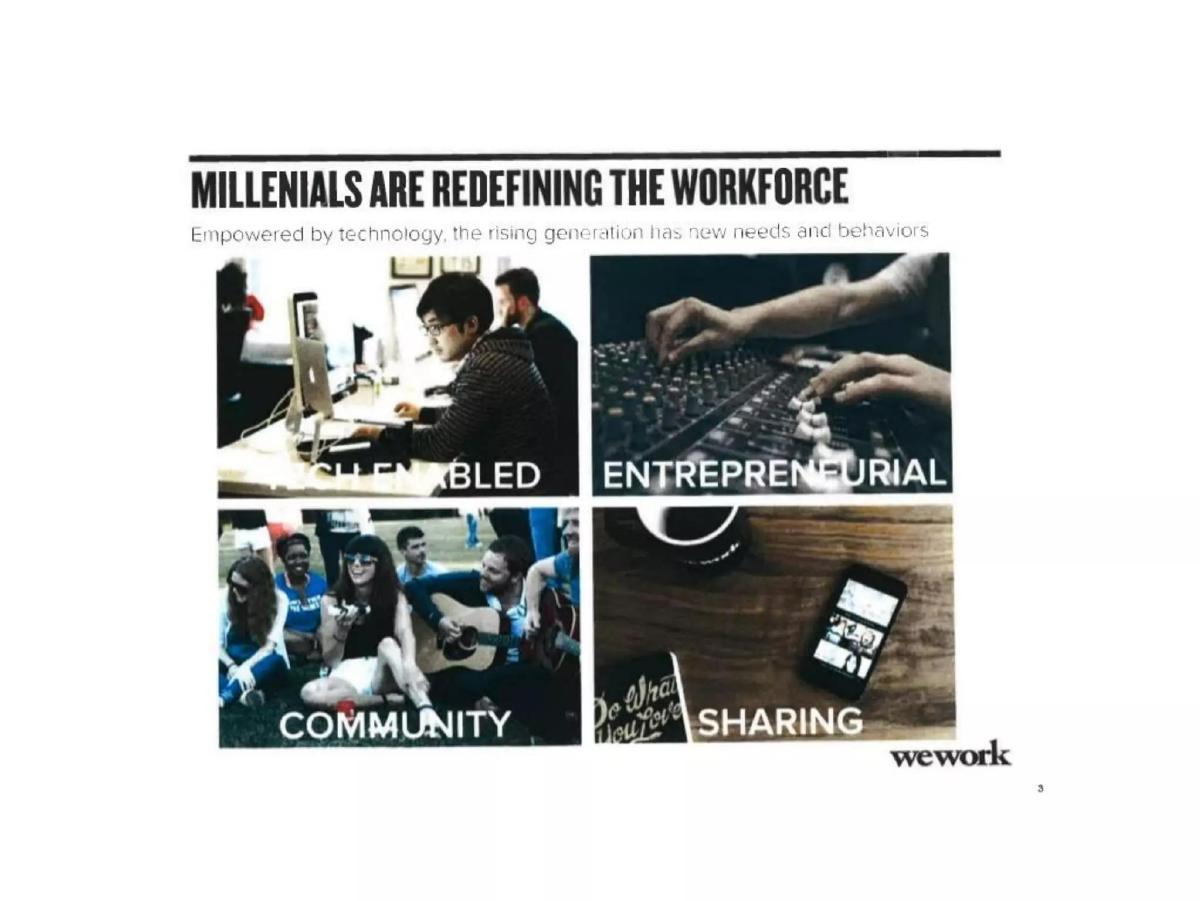
This is a classic "Problem/Opportunity" slide focused on demographics. It uses four photos to represent tech-enabled, entrepreneurial, community, and sharing behaviors of the rising generation.
Investors interpret this as an argument for why the traditional office is dead. It suggests that the workforce is no longer interested in cubicles and corporate hierarchy, but in flexibility and "vibe." This slide serves to validate the "Massive Opportunity" mentioned on the previous slide by showing the cultural tailwinds.
This slide is purely atmospheric. The strongest version would include data points—for example, the percentage of the workforce that will be millennials by 2020—to move from "feeling" to "fact."
Slide 5: Creating Fundamental Shifts
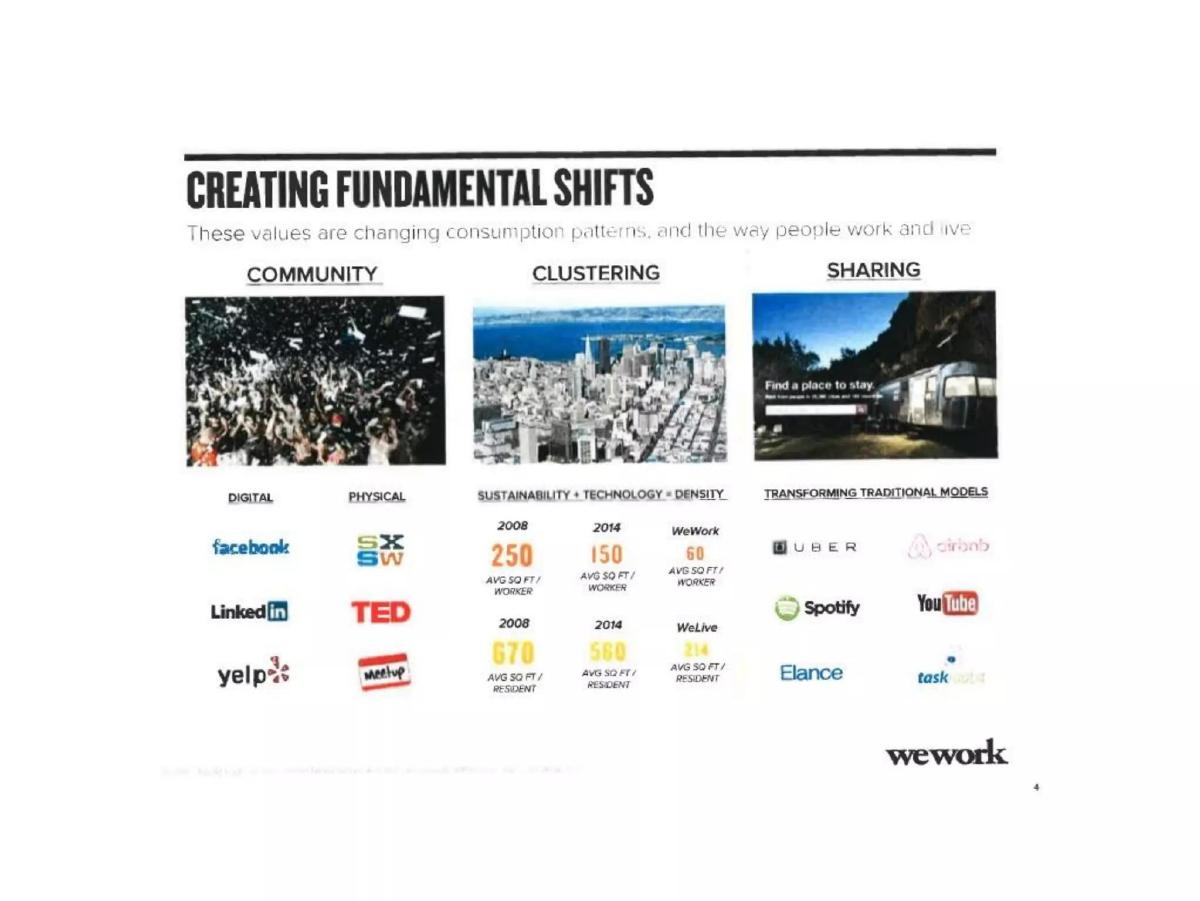
This slide attempts to quantify the shift in consumption patterns. It compares "Community" (Facebook/LinkedIn) to "Physical" (SXSW/Meetup). Crucially, it introduces the "Clustering" metric: WeWork averages 60 sq ft per worker compared to the 2008 average of 250 sq ft.
The math here is the "secret sauce" of the business model: Density equals Profit. By fitting four times as many people into the same square footage as a traditional office, WeWork can charge less per person while generating more revenue per square foot. The introduction of "WeLive" with 214 sq ft per resident (vs. 560 avg) signals the company's intent to apply this density model to housing.
The slide is cluttered. A stronger version would focus exclusively on the "Efficiency Gap"—showing exactly how much more revenue WeWork extracts from a 10,000 sq ft floor compared to a traditional commercial tenant.
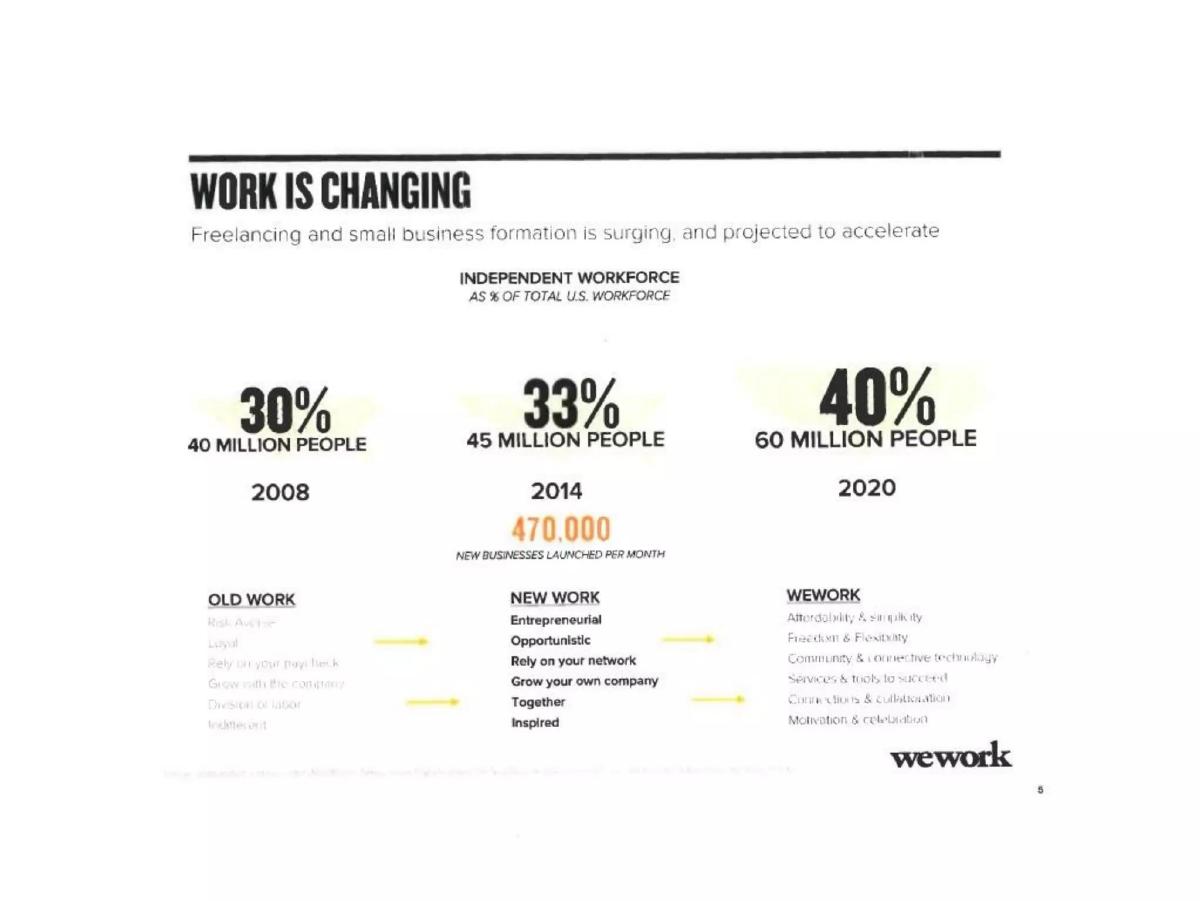
Slide 6: Work is Changing
This slide provides the statistical backing for the "New Work" movement. It cites that the independent workforce was 30% of the US total in 2008 and is projected to be 40% (60 million people) by 2020. It also contrasts "Old Work" (risk-averse, loyal) with "New Work" (entrepreneurial, opportunistic).
For an investor, this slide addresses the "Why Now?" question. If the workforce is becoming increasingly freelance and small-business-heavy, the traditional 10-year lease becomes an obsolete product. WeWork positions its "Affordability & Simplicity" as the direct solution to this structural shift.
The table comparing "Old Work" vs "New Work" vs "WeWork" is somewhat redundant. The strongest version would focus on the "470,000 new businesses launched per month" and show what percentage of those businesses currently use flexible office space.
Slide 7: Creating a New Ecosystem for Work
This slide breaks the product down into three categories: Space, Community, and Services. It lists the "basics" (wifi, coffee) and includes logos of partners like Amazon Web Services, Chase, and Momofuku.
This is the first hint of the "Services" revenue stream. Investors see that WeWork is trying to become an "operating system" for small businesses. If a member gets their health insurance (TriNet), their coffee (Momofuku), and their cloud credits (AWS) through WeWork, the "stickiness" of the membership increases significantly.
The strongest version of this slide would quantify the value of these services. Simply listing logos doesn't prove that members are actually using them or that WeWork is making a margin on them. It needs a "Services Revenue per Member" callout here (which does appear later, but belongs here too).
Slide 8: The WeWork Effect
A flywheel diagram showing how community activity creates a "supply and demand" network effect. More members lead to better deals with landlords, which leads to more locations, which leads to a better member experience, which attracts more members.
This is a standard "virtuous cycle" pitch. Investors are looking for evidence that the cost of customer acquisition (CAC) goes down as the brand grows, or that the bargaining power with landlords increases with scale. The claim that "community value increases" with growth is an attempt to prove a network effect exists in a physical space.
Network effects in physical real estate are notoriously difficult to prove. The strongest version of this slide would show data on "internal referrals" or the percentage of members who do business with each other, proving that "More Community Activity" actually yields "Better Member Experience."
Slide 9: Powered by Technology at Every Layer
This slide claims that proprietary software makes design, development, and management "efficient and scalable." It lists pipeline management, architectural design, and space management as key software-driven areas.
This slide is meant to justify a tech valuation. If WeWork can design a space 20% faster or manage a building with 50% fewer staff than a traditional property manager because of software, that is a massive competitive advantage. However, the screenshots are small and the "faint descriptive text" makes it hard to verify what the software actually does.
The strongest version would provide a specific KPI for the tech. For example: "Our architectural software reduces the time from lease-sign to move-in by 30%." Without a metric, this slide feels like marketing fluff.
Slide 10: First Mover with Critical Mass
A map showing member counts across major cities: NYC (9,500), London (600), Boston (1,400), etc. It claims a total of 15,000 members and shows a grid of building facades.
Investors see geographical concentration. Having 9,500 out of 15,000 members in New York City (63%) means the business is highly dependent on a single real estate market. However, it also proves "critical mass" in that market, which supports the flywheel theory from Slide 8.
A stronger version would show the "Market Share" in a city like NYC. If WeWork is the largest private tenant in Manhattan, that is a much more powerful statement than just showing member counts.
Slide 11: Proven, Profitable Business Model
This is a data-heavy table showing 19 locations. It lists occupancy (mostly 96-100%), desk counts, license fees per member (~$600), and Unit EBITDA margins (averaging 41%).
This is arguably the most important slide in the deck for a financial analyst. It provides the proof for the unit economics. The average revenue per member is listed at $628 (License Fee + Services). The consistency of the margins (mostly 36% to 48%) across different cities like DC, Boston, and SF suggests the model is highly replicable.
The "Rent & OpEx" line is consolidated. A stronger version would break out Rent from OpEx. Because WeWork signs long-term leases, investors need to know the "lease coverage ratio" and how much of that 41% margin is vulnerable to rent hikes or occupancy dips.
Slide 12: Growing Rapidly
A bar chart showing annualized monthly revenue growth. It projects jumping from ~$121mm in Dec 2014 to ~$395mm by Dec 2015, driven by a "fully-developed" pipeline.
The chart shows "Annualized Monthly Revenue," which is a common startup tactic to make current revenue look larger than it is. However, the 225% projected growth for 2015 is ambitious. The visual overlap of "Members" and "Revenue" suggests that revenue per member is expected to stay stable or rise.
The strongest version of this slide would show "Actual vs Projected" for 2013 and 2014 to build credibility for the 2015 projection. Without historical accuracy data, the $395mm figure is just a goal.
Slide 13: Broadening Member Base
A logo grid categorized by company size. It ranges from 1-49 employees (Handybook, Hired) to 5,000+ employees (Coca-Cola, Microsoft, Merck).
This slide is intended to de-risk the "customer profile." By showing that huge corporations like Merck and Microsoft are members, WeWork is proving that its product is not just for "guys in hoodies" but has enterprise utility. This is crucial for long-term stability, as enterprise tenants are usually more "sticky" than freelancers.
The strongest version would include the percentage of revenue coming from each segment. If the 5,000+ employee segment only accounts for 1% of revenue, the logos are "vanity metrics."
Slide 14: And a Compelling Value Proposition
A bar chart comparing WeWork's $7,800 annual cost per employee to a standard lease's $10,350 cost. It claims a 25% savings by eliminating up-front costs and administrative expenses.
This is the "Sales 101" slide. It explains why a company would choose WeWork. By bundling cleaning, utilities, internet, and office management, WeWork provides a cheaper and simpler alternative. The 25% savings is a powerful hook for CFOs of the companies shown on the previous slide.
A stronger version would clarify what "Standard Office Lease" refers to. Real estate costs vary wildly between NYC and Austin. If the $10,350 figure is a national average, it might understate the savings in Tier 1 cities.
Slide 15: WeWork's Value-Added Tenancy
This slide uses a table to show how WeWork increases the value of the buildings it occupies. It compares "Investment" to "Today's Value" for five properties, showing an average multiple of 1.6x and an unlevered IRR of 25%.
This is a pitch to the real estate industry and potential REIT investors. It claims that WeWork "activates and rebrands" assets, making the building itself worth more. The comparison to Whole Foods suggests that WeWork is an "anchor tenant" that draws other high-value businesses to a neighborhood.
The "Today's Value" column is likely an appraisal or an "implied value" based on cap rates. A stronger version would explicitly state if these buildings were actually sold or if this is a paper gain. Real estate investors are wary of "marked-to-market" valuations.
Slide 16: And Partnerships with Leading Global Landlords
A grid of logos including Blackstone, Tishman Speyer, Brookfield (not listed but implied by similar decks, actually lists Vornado, Beacon, Boston Properties), and Kushner Companies.
This slide is about institutional credibility. If the biggest names in real estate are partnering with WeWork, it suggests the business model has survived the due diligence of the most sophisticated landlords in the world. It also implies a "moat"—if WeWork has these relationships, it’s harder for a competitor to move into the best buildings.
This slide is effective as-is, but adding the "total square footage managed under these partners" would provide a sense of the scale of these alliances.
Slide 17: And a Fully Predictable Pipeline
A Gantt-style chart showing 80 total locations in various stages: Open (20), Signed (14), Under Negotiation (26), and Term Sheet (20). It lists 16 key markets.
Investors love the word "predictable." This slide shows that the growth projected on Slide 12 isn't just a guess; it's backed by 60 buildings that are already in the works. It moves the conversation from "Can you grow?" to "Can you execute on this specific list?"
The strongest version would include "expected open dates" for the signed locations. "Under negotiation" is not a guarantee of a location, so the 26 and 20 figures should be taken with a grain of salt.
Slide 18: Driving Capital Efficient Deal Flow
This slide introduces two deal structures: "Market Terms" (Landlord pays 50% CapEx) and "Asset Light" (Landlord pays 75% CapEx + profit share). It shows Net CapEx per member dropping from $7,100 in 2013 to a projected $3,000 in 2015.
This is a massive shift in the business model. By getting landlords to pay for the build-out, WeWork reduces its own capital risk. The tradeoff is a "Profit Share" (25-50%), which lowers the Unit EBITDA margin from 40% to 32%. However, the "payback period" drops from 22 months to 7 months, which is a trade any growth investor would take.
This slide is quantitatively strong. The 50% reduction in Net CapEx per member is the most compelling efficiency metric in the deck.
Slide 19: The WeWork Opportunity / U.S. Only
An enormous table projecting total addressable market (TAM) across 25 cities. It estimates that even with small penetration (1%, 3%, or 5%), WeWork can generate billions in revenue and EBITDA.
The TAM math: 11.8 million potential members in the US. At 5% penetration and a $7,600 annual fee, that’s $4.6 billion in revenue and $1.8 billion in EBITDA. This slide is meant to show that the company has only scratched the surface (0.1% current penetration).
The 40% margin assumption across all cities is aggressive. A stronger version would adjust margins for lower-tier cities where the "efficiency gap" (Slide 5) might be narrower due to lower baseline rents.
Slide 20: A Creative Membership Industry Mix
Four charts showing industry mix (Tech 27%, Creative 21%), age distribution (mostly 25-44), "Before WeWork" status (41% worked from home), and company size (23% are 1-2 people).
This slide helps investors visualize the user. The fact that 41% were working from home before joining suggests WeWork is "expanding the market" for office space rather than just stealing tenants from Regus. The 1-2 person company size (23%) highlights the importance of the community aspect—these people aren't just buying a desk; they're buying social interaction.
The strongest version would show "Churn" or "Retention" by industry. If tech startups churn at 10% but creative agencies churn at 2%, that is vital info for long-term modeling.
Slide 21: Connected by a Seamless Mobile Experience
Screenshots of the WeWork app showing features like "Check-in Guests," "Guest Registration," and "Message Fellow Members."
This is the "proof" for the "proprietary technology" claim on Slide 3. It shows that WeWork is trying to digitize the physical experience. Features like "Scan this code to pay" (for food/services) turn the office into a frictionless environment.
The strongest version would show the app's "Daily Active Users" (DAU) or a specific engagement metric. A screenshot only proves the UI exists, not that it's useful.
Slide 22: Growth in Mobile Usage
A chart showing that Monthly Active Users (MAUs) have grown 650% and "Repeat MAUs" have grown 850% year-to-date, significantly outpacing membership growth (+122%).
This is a "golden" slide for tech investors. If app usage is growing faster than membership, it means the members are becoming more engaged with the "digital community." This supports the idea that WeWork is a social network, not just a landlord. The "90% repeat users" figure is an indicator of high "stickiness."
A stronger version would define what a "use" is. Is opening the app to get a door code a "use"? Or is it meaningful engagement like messaging a fellow member? The quality of the usage matters.
Slide 23: Upcoming Social Initiatives
Descriptions of planned features: "Super-fast routing" for help requests, "Tinder-like" connections, and public profiles for SEO.
This reinforces the social network narrative. By facilitating "Help, Refer or Pass" (the Tinder-like feature), WeWork is trying to increase the "surface area for serendipity." This is meant to further differentiate them from traditional co-working spaces.
The "Tinder-like" comparison feels a bit dated and potentially unprofessional for a B2B platform. A stronger version would focus on the "Service Marketplace" aspect—how these connections lead to revenue for the members.
Slide 24: Leveraging Scale to Provide Valuable Services
A grid of services categorized into three phases. Phase I (active) includes TriNet, Chase, and Amazon Web Services. Phase II (exploration) includes Shopify, LandingClub, and Square.
This slide explains how WeWork plans to grow "Average Revenue Per Member" (ARPU). Currently, they make $28/mo on services (4% of revenue). The goal is to move up the value chain into higher-margin areas like healthcare, payments, and legal services.
The strongest version would show the "Take Rate" or "Revenue Share" WeWork gets from these partners. Simply listing Shopify doesn't explain how WeWork monetizes that relationship.
Slide 25: Strong Interest in Services Offerings
A bar chart showing a "5x increase" in qualified leads for TriNet (healthcare) after app integration.
This is a proof point for the "Services" strategy. It shows that members actually want the things WeWork is offering. Because healthcare is a major pain point for small businesses and freelancers, this is a high-value lead gen engine.
The chart shows "leads," not "conversions." A stronger version would show how many members actually signed up for TriNet and what the resulting revenue to WeWork was.
Slide 26: And Monetizing a Growing Member Base
A projection chart showing services revenue growing from $28/member ($5m total) in 2014 to $75/member ($82m total) in 2016.
This is where the "SaaS" valuation really comes in. Services revenue is generally higher margin than real estate revenue because it doesn't require extra square footage. If WeWork can triple its services revenue per member in two years, its overall profitability will skyrocket.
The leap from $28 to $75 in two years is a massive assumption. The strongest version would provide a "Bridge Chart" showing exactly which new services (e.g., "$10 from healthcare, $5 from payments") will make up that $47 increase.
Slide 27: Extending the Offering Beyond Physical Members
Introduces "WeWork Everywhere"—a digital-first membership for people who don't need a full-time desk but want the community and services.
This is an "asset-light" growth play. WeWork can sell a $50/mo digital membership with nearly 100% margins because it uses the existing software and service partnerships. This effectively turns WeWork into a "Global Professional Association."
A stronger version would include the pricing for this tier and a "pilot" data point. If they've already sold 1,000 of these, the slide is much more credible.
Slide 28: WeLive Transition Slide
This marks the transition from the core business to the "next big thing." It signals a move from "Work" to "Life."
The slide is minimalist but could have included a "Vision Statement" to set the stage for the residential pitch.
Slide 29: WeLive / Reinventing Residential
Applies the WeWork framework (Space, Community, Services) to residential living. Shows photos of modern, flexible apartments.
The logic is: if people love the WeWork office, they’ll love the WeWork apartment. It’s an "expansion of the ecosystem" play. By capturing both where someone works and where they live, WeWork becomes the central platform for their entire lifestyle.
A stronger version would address the different regulatory and lease-term environments of residential vs. commercial real estate. Residential tenants have different legal protections and churn behaviors.
Slide 30: Making City Life Accessible
A cost comparison chart for WeLive vs. a standard apartment lease. It claims 36% savings ($21,600 vs. $33,800) by bundling furniture, utilities, and broker fees.
Like Slide 14, this is a "financial benefit" slide. It highlights that WeLive requires a $56k income vs. $76k for a standard lease. This significantly expands the pool of potential tenants in high-cost cities like NYC or SF.
The "Savings" include a "Broker Fee" and "Furniture," which are often one-time costs. Amortizing these over a single year makes the savings look larger than they are over a 3-year stay. A stronger version would show the 3-year TCO (Total Cost of Ownership).
Slide 31: Next Generation Communities
Shows two "Urban Campuses" (Crystal City in DC and 110 Wall St in NYC) that combine WeWork and WeLive. It notes $92.2mm in total funding from landlords (Vornado and Rudin).
This proves that the "WeLive" concept isn't just a theory; landlords are already putting tens of millions of dollars into it. The "mixed-use" nature of these buildings allows WeWork to "own the neighborhood."
The strongest version would explain the "Economics" for WeWork in these joint ventures. Are they getting a management fee? A profit share? Or is it a standard lease?
Slide 32: Urban Campuses (Brooklyn Navy Yard)
Details on a 530,000 sq ft project at the Brooklyn Navy Yard. Landlords (Boston Properties/Rudin) are funding the $250m development and paying WeWork $13.8m up-front.
This is the ultimate "Asset Light" example. WeWork is being paid $13.8 million just to show up and manage the space. This is a massive shift from "tenant" to "operator." It mirrors the hotel industry model (e.g., Marriott doesn't own the buildings, they just manage them).
This is a very strong slide. The quantitative details on the landlord contribution ($16.2m) and up-front payment ($13.8m) provide clear evidence of WeWork's market power.
Slide 33: The WeLive Opportunity / U.S.
A TAM table for WeLive, similar to Slide 19. It estimates a $110 billion potential market in the US.
The math assumes an $1,800 monthly membership fee. At just a few percentage points of penetration, the revenue potential is billions. This is meant to "top up" the valuation by showing that WeWork's total TAM isn't just offices, but the entire urban living experience.
Like the earlier TAM slide, the 40% EBITDA margin is an assumption. Residential margins are typically lower than commercial margins due to higher maintenance and turnover costs.
Slide 34: Five-Year Forecast
A bar chart projecting revenue to grow from $75m (2014) to $2.86bn (2018). It includes a breakdown of WeWork, WeLive, and Services revenue.
This is the "Hockey Stick" graph. It shows WeLive and Services becoming significant contributors by 2017-2018. The income statement shows "Ending Cash" staying relatively low, which implies that all profits are being aggressively reinvested into growth.
The leap from $715m in 2016 to $1.55bn in 2017 (a doubling of revenue in one year) is incredibly steep. A stronger version would include a "Location Count" or "Square Footage" projection to show the physical reality required to generate that $2.8bn.
Slide 35: Leadership & Vision
Photos and bios of the founders (Neumann, McKelvey) and key executives (Michael Gross, Kakul Srivastava, etc.), plus the Board (Benchmark Capital, Rhone Group).
The board includes Bruce Dunlevie from Benchmark, which gives the company instant Silicon Valley "blue chip" status. The executive team includes people with backgrounds from Coach, Google, and Flickr (implied by the names, though not detailed in the text).
A stronger version would highlight the "Real Estate" expertise on the executive team. While the "Product" and "People" roles are filled, an investor wants to see heavy-hitters from the commercial real estate world in the C-suite.
Slide 36: Closing Slide
A photograph of two employees laughing in a well-decorated space with the text "GRIT DRIVEN SCRAPPY CREATIVE AWESOME" and "CANT believe THIS IS my JOB."
This ends the deck on a high-energy, culture-focused note. It reinforces the idea that WeWork is a movement, not just a company.
This slide is purely for "vibe." A stronger closing slide would reiterate the "October 2014" contact information or provide a final "Key Takeaway" summary for the investor to remember.
Concrete fixes in priority order
Define "Mature Locations": The 41% unit EBITDA margin is the foundation of the financial pitch. The deck must define exactly what makes a location "mature" (e.g., "12+ months since opening and 90%+ occupancy") to ensure the data isn't cherry-picked. · Bridge the Services Revenue Gap: Moving from $28 to $75 per member in services revenue is a massive 167% increase. The deck needs a specific roadmap showing which products (Healthcare, Payments, Insurance) will contribute exactly how much to that $47 increase. · Break Down the $2.86Bn Revenue Projection: The 5-year forecast is a "black box." It needs a supporting slide showing the required square footage, building count, and capital expenditure needed to achieve $2.8 billion in revenue by 2018. · Quantify "Proprietary Technology": The deck claims tech is at "every layer" but only shows UI screenshots. It needs a metric-driven slide (e.g., "Our design tech reduces construction costs by $X per sq ft") to justify a tech-company valuation multiple. · Clarify Real Estate "Values": Slide 15 claims significant value creation for landlords. It should specify if these are realized gains from sales or unrealized appraisals to give investors a clearer picture of the actual market impact.
Frequently asked questions
- What were WeWork's unit margins in 2014?
- WeWork reported a 41% average unit EBITDA margin at its mature locations as of October 2014.
- What was WeWork's revenue projection for 2016?
- WeWork projected a $1 billion revenue run-rate by the end of 2016, a massive jump from its 2014 projection of $74.6 million.
- How does the deck define "Space as a Service"?
- The deck defines it as a "global, well-capitalized provider" model that treats physical space like a software subscription (SaaS), leveraging technology and community to drive density and higher margins.
- What was the original pitch for WeLive?
- WeLive was pitched as a "natural extension" of the WeWork brand into residential real estate, claiming to offer 36% savings for residents compared to standard apartment leases.
- How much square footage did WeWork allocate per worker?
- WeWork claimed to fit workers into 60 sq ft per person, compared to the 2008 industry average of 250 sq ft, creating significant revenue efficiency.