The 2014 WeWork pitch deck is a masterclass in narrative-driven fundraising, successfully positioning a capital-intensive real estate business as a scalable technology ecosystem. By utilizing metrics like 'average square feet per worker' (Slide 4) to demonstrate efficiency gains and showcasing a 'fully predictable pipeline' of 80 locations (Slide 17), WeWork signaled to investors that it had cracked the code on urban density. The deck is particularly notable for its introduction of 'WeLive,' a residential extension aimed at a $6.4 billion annual revenue opportunity (Slide 32). While the busin…
Key takeaways
- WeWork positioned itself within a 'fundamental shift' in consumption, comparing its physical clustering to digital giants like Facebook and LinkedIn (Slide 4).
- The company claimed to increase density significantly, reducing average square feet per worker from 250 in 2008 to 60 for WeWork in 2014 (Slide 4).
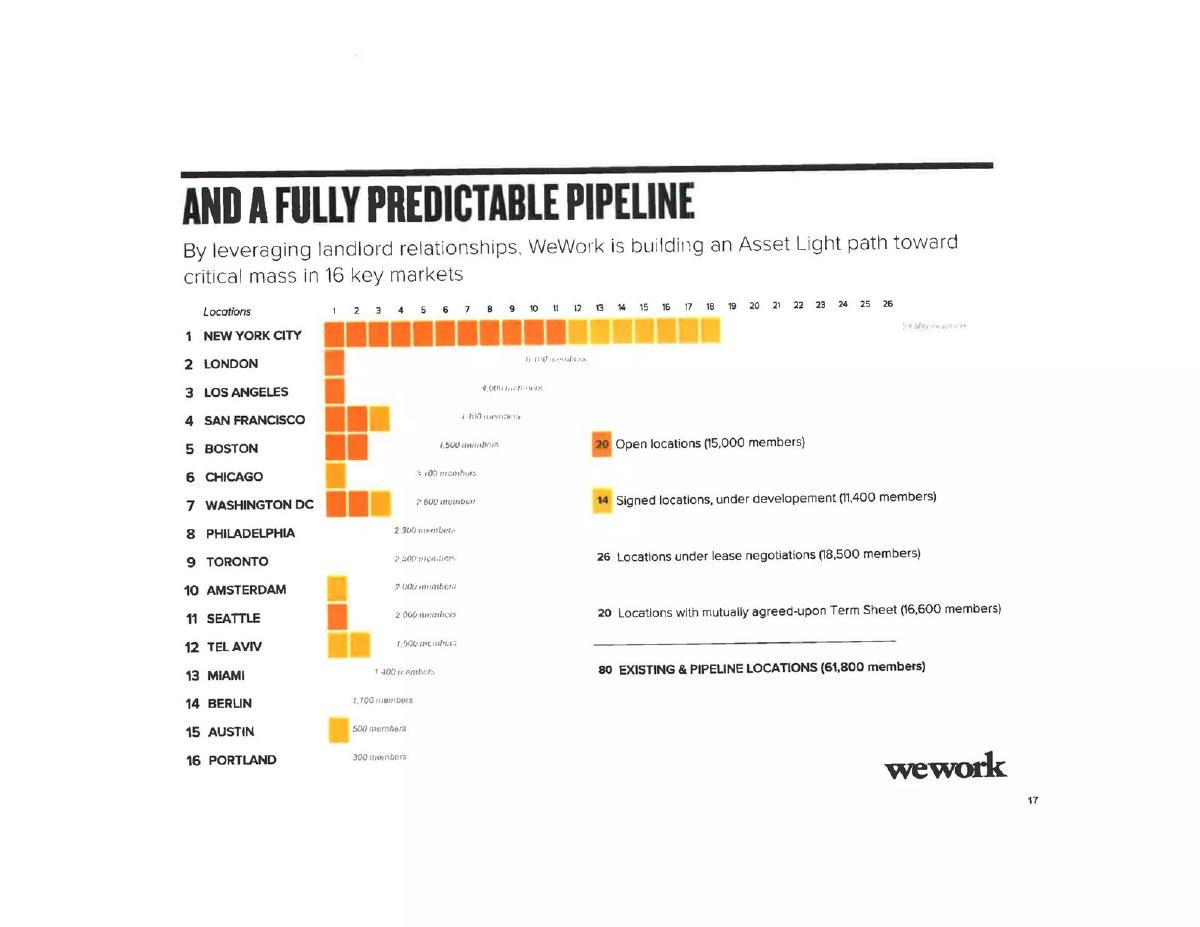
- A 'fully predictable pipeline' was presented, consisting of 20 open locations, 14 signed, 26 under negotiation, and 20 with agreed-upon term sheets (Slide 17).
- The member base was shown to be diversifying from small startups to enterprise clients like Coca-Cola, Microsoft, and Merck (Slide 12).
- WeWork used its mobile app to cross-sell services, claiming a 5x increase in monthly leads for TriNet healthcare since app integration (Slide 24).
- The 'WeLive' residential concept was projected to generate $2.59 billion in annual EBITDA at a 5% market penetration rate (Slide 32).
- The deck emphasizes 'Proprietary software' as the engine for design, development, and management to argue for scalability (Slide 8).
- The presentation lacks a traditional 'Team' slide or a specific 'Ask' in the provided 10-slide sample.
Executive Summary: The 2014 Vision of Space as a Service
The October 2014 WeWork pitch deck represents a pivotal moment in the company's history. At this stage, WeWork was no longer just a co-working provider; it was attempting to redefine itself as a lifestyle brand and a technology ecosystem. The deck, dated October 2014 (Slide 1), focuses heavily on the 'WeLive' expansion and the 'Asset Light' growth strategy. By framing physical square footage as a 'digital' and 'physical' community hybrid, the founders sought to capture the high multiples typically reserved for software companies.
Slide 1: Title Slide
The cover slide is minimalist, featuring the 'Do What You Love' mantra on a card placed on a wooden table. The date 'OCT 2014' and the 'wework' logo are the only other identifiers. This sets a lifestyle-oriented tone rather than a corporate real estate one, signaling that the brand is centered on the experience of the worker rather than the utility of the office.
Slide 4: Creating Fundamental Shifts
This is one of the most important slides for understanding WeWork's valuation logic. It categorizes the company alongside digital giants like Facebook, LinkedIn, and Yelp under 'Community.' It then introduces the concept of 'Clustering' and 'Sharing,' comparing WeWork to Uber and Airbnb. Crucially, it provides a density metric: in 2008, the average square feet per worker was 250; by 2014, WeWork had reduced this to 60 square feet. This 4x increase in density is the core of their margin expansion story. It also introduces 'WeLive,' showing a reduction from 670 square feet per resident to 214.
Slide 8: Powered by Technology at Every Layer
To justify a tech valuation, Slide 8 claims that 'Proprietary software makes the design, development and management of our spaces efficient and scalable.' It lists several software-driven layers: Pipeline Management, Architectural Design (optimized layouts), Sales and Lead Tracking, Space Management (automated tracking), and Member Support. The visuals show various dashboards on laptops and tablets, reinforcing the idea that WeWork is a data-driven platform rather than a leasing company.
Slide 12: Broadening Member Base
This slide addresses the 'startup risk' by showing a diversified client list. It categorizes members by company size, ranging from 1-49 employees to 5,000+. While the left side features startups like Reddit and Hired, the right side features 'Blue Chip' logos including Coca-Cola, J.Crew, News Corp, Red Bull, Merck, and Microsoft. This was intended to prove to investors that the model was resilient and attractive to enterprise clients with higher credit ratings.
Slide 17: A Fully Predictable Pipeline
WeWork presents its growth as an inevitability on this slide. It lists 16 key markets, including New York City, London, Los Angeles, and Tel Aviv. The 'Asset Light' path is highlighted, claiming a total of 80 existing and pipeline locations representing 61,800 members. The breakdown includes 20 open locations (15,000 members), 14 signed (11,400 members), 26 under negotiation (18,500 members), and 20 with agreed-upon term sheets (16,600 members). This visualizes a massive, locked-in growth trajectory.
Slide 20: Connected by a Seamless Mobile Experience
This slide focuses on the member app, describing it as 'intuitive' and 'core to the WeWork experience.' It lists features such as booking rooms, checking in guests, grabbing lunch (via QR codes), and messaging fellow members. By positioning the app as the central interface for the 'community,' WeWork argued that it owned the relationship with the individual worker, not just the company paying the rent.
Slide 24: Strong Interest in Services Offerings
Slide 24 attempts to prove the 'platform' theory—that WeWork can sell high-margin services to its captive audience. It features a bar chart showing 'TriNet Qualified Leads' from January 2014 to September 2014. The chart shows a 5x increase in average monthly leads since the app integration in July 2014. This was a key piece of evidence for the argument that WeWork could eventually become a marketplace for business services (insurance, HR, software).
Slide 28: WeLive / Reinventing Residential
This slide introduces the residential pivot. It defines WeLive as a 'natural extension of the WeWork concept, community and brand.' It breaks the offering into three categories: Space (Beautiful, Functional, Flexible), Community (Connected, Collaborative, Social), and Services (Simple, Seamless, Affordable). The photos depict modern, high-density living environments, suggesting that the 'Space as a Service' model is applicable to all aspects of urban life.
Slide 32: The WeLive Opportunity / U.S.
This is a massive 'TAM' (Total Addressable Market) slide. It lists 25 US cities and calculates the potential revenue based on the population of college-educated non-family renters aged 18-39. The slide projects that at a 5% market penetration , WeLive could generate $6,480,000,000 in annual revenue and $2,592,000,000 in annual EBITDA (at a 40% margin). These are staggering numbers intended to show that the residential opportunity alone could justify a multi-billion dollar valuation.
Slide 37: Closing Slide
The final slide in this set is a promotional slide for 'chagency,' the design agency that likely reformatted or distributed this version of the deck. It contains no company-specific information but provides links for more pitch decks.
What Works in This Deck
1. The Density Narrative: WeWork successfully turned a real estate metric (square footage) into a efficiency metric. By showing they could fit 4x more people into the same space as a traditional office, they presented a clear path to superior unit economics.
2. Enterprise Validation: Including logos like Microsoft and Merck (Slide 12) was critical. It countered the narrative that co-working was only for freelancers and small startups, proving the model had 'legs' in the corporate world.
3. The Platform Play: Slide 24 is a classic 'land and expand' argument. By showing they could drive a 5x increase in leads for a partner like TriNet, they teased a future where WeWork would earn high-margin commissions on every service a member consumed.
What Is Missing From This Deck
1. Actual Financials: While Slide 32 shows 'projections' for WeLive, the 10-slide sample lacks a historical income statement or balance sheet for the core WeWork business. There is no mention of burn rate or the cost of lease obligations.
2. The Team: There is no team slide in this selection. In a high-growth startup, the background of the founders and the real estate/tech leadership is usually a primary focus for investors.
3. Risk Factors: The deck presents the pipeline as 'fully predictable' (Slide 17), but it does not address the risks of long-term lease liabilities paired with short-term member contracts—the fundamental mismatch that eventually led to the company's restructuring.
What Founders Should Copy
1. Use Comparative Anchors: WeWork didn't compare itself to Regus (a traditional office provider). It compared itself to Facebook and Airbnb (Slide 4). Founders should anchor their company to the peers whose valuations they want to emulate.
2. Visualize the Pipeline: Slide 17 is an excellent way to show momentum. Instead of just saying 'we are growing,' they broke it down into 'Open,' 'Signed,' 'Under Negotiation,' and 'Term Sheet.' This gives investors confidence in the short-to-medium term growth.
3. Quantify the Efficiency: If your business model relies on doing something more efficiently than the status quo, find a single metric (like square feet per worker) and show the dramatic improvement your solution provides.
Frequently asked questions
- What was WeWork's primary value proposition in this deck?
- WeWork’s value proposition was built on three pillars: Community, Clustering, and Sharing. As shown on Slide 4, the company argued that it was creating a 'fundamental shift' in how people work and live by leveraging technology to increase density. They specifically highlighted their ability to fit a worker into 60 square feet, compared to the 2008 industry average of 250 square feet, effectively tripling the revenue potential of a given floor plate.
- How did WeWork justify being classified as a technology company?
- The deck uses Slide 8 ('Powered by Technology at Every Layer') and Slide 20 ('Connected by a Seamless Mobile Experience') to frame the business as a tech platform. It claimed that proprietary software handled everything from architectural design to lead tracking and member support. By showing the app's ability to drive service revenue—such as the 5x lead increase for TriNet on Slide 24—they argued the software was a high-margin growth lever.
- What was the 'WeLive' concept mentioned in the slides?
- WeLive was WeWork’s attempt to apply its 'Space as a Service' model to residential real estate. Slide 28 describes it as a natural extension of the brand, focusing on 'Beautiful, Functional, Flexible' living spaces combined with community and services. Slide 32 provides a massive financial projection for this segment, targeting 25 US cities and estimating a $6.48 billion annual revenue potential at 5% penetration of the target demographic.
- How did the deck demonstrate market traction and scale?
- Traction was demonstrated through a 'predictable pipeline' on Slide 17, which showed 80 total locations either existing or in development, representing 61,800 members. Furthermore, Slide 12 ('Broadening Member Base') showcased a transition from small teams to massive enterprise logos like Merck, Microsoft, and Coca-Cola, suggesting that the model was moving beyond the 'freelancer' niche into the broader corporate world.
- What financial metrics were emphasized in the presentation?
- The deck focused on top-line growth and efficiency metrics rather than net profit. Key figures included the reduction in square footage per worker (Slide 4), the 5x growth in service leads (Slide 24), and the projected $2.59 billion EBITDA for the WeLive division (Slide 32). The focus was on the 'Asset Light' path toward critical mass in 16 key markets, emphasizing the scale of the opportunity over current profitability.