WhereIsMyTransport addresses a massive data gap in the 'Majority World,' where informal transit networks dominate but remain unmapped by tech giants like Google. By deploying a proprietary data collection playbook involving over 1,000 in-field collectors, the company transformed chaotic transit systems into structured, monetizable data. Their deck excels at contrasting the 'Developed Market' reality with the 'Majority World' challenge, using a specific case study in Mexico City to prove the scale of informal networks. While the deck is light on specific financial projections and a clear 'Ask'…
Key takeaways
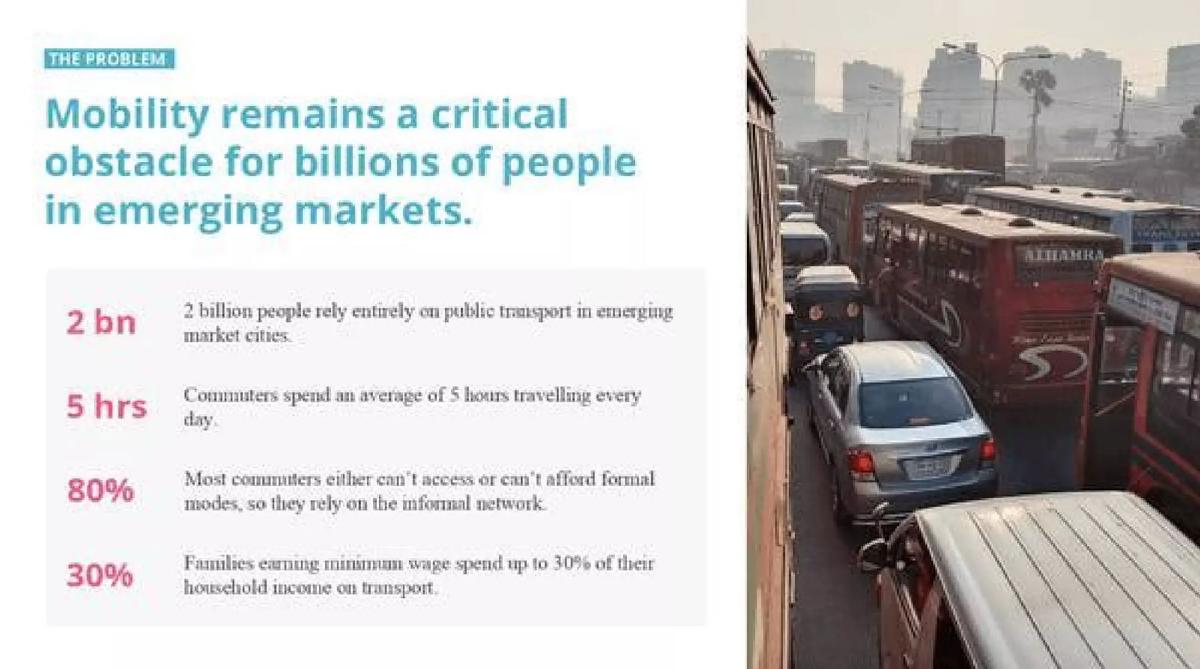
- The deck identifies a massive addressable market of 2 billion people relying on public transport in emerging market cities (Slide 2).
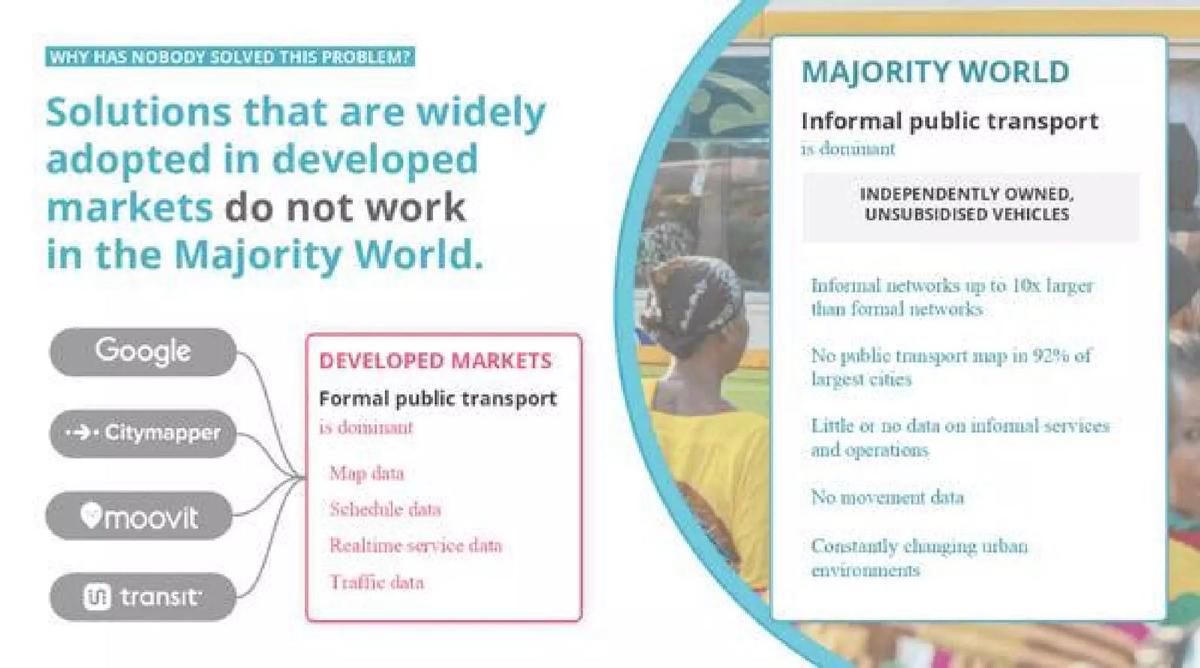
- It highlights a significant competitive moat: 92% of the largest cities in the Majority World have no public transport map (Slide 3).
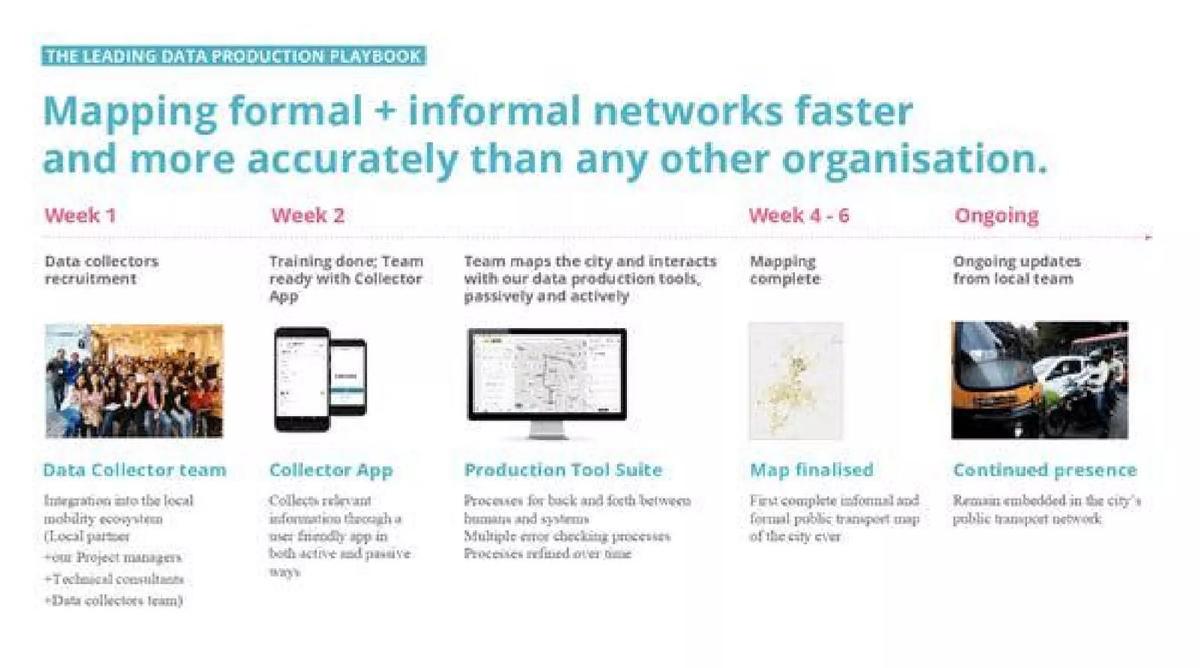
- The company demonstrates a clear operational timeline, claiming they can map a city's formal and informal networks in just 4 to 6 weeks (Slide 5).
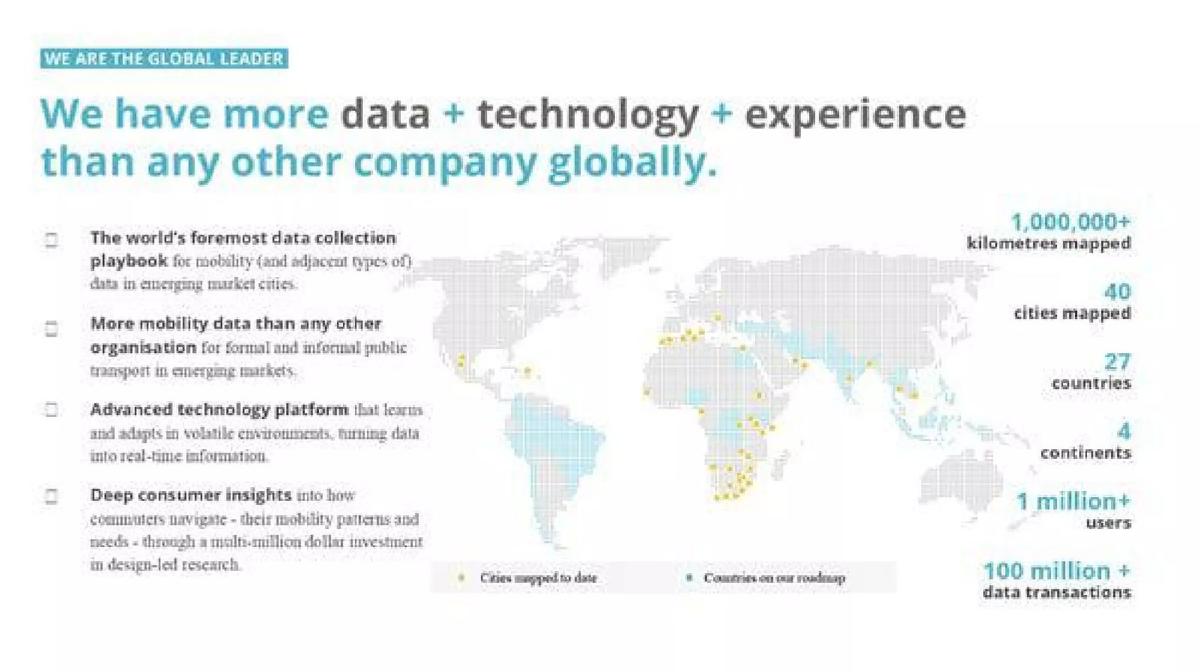
- Traction is evidenced by 1,000,000+ kilometers mapped across 40 cities and 27 countries (Slide 6).
- A Mexico City case study shows that informal networks can be up to 7x larger than formal ones in terms of tracks and routes (Slide 7).
- The business model has shifted from public sector clients to large global corporates, citing Google and Facebook as partners (Slide 9).
- The team is distributed globally with hubs in London, Cape Town, Mexico City, and San Francisco (Slide 10).
- The deck lacks a specific financial 'Ask' slide or a detailed breakdown of how the Series-A funds will be allocated.
Introduction: Mapping the Unmapped
WhereIsMyTransport is a mobility technology company that focuses on the 'Majority World'—emerging markets where public transport is dominated by informal, decentralized networks. While tech giants have mastered the transit data of London and New York, they have largely failed to penetrate cities like Nairobi or Mexico City. This 12-slide Series-A deck, used in 2015 to help secure a total of $27.8 million in funding, focuses on the company's unique ability to digitize these chaotic systems.
The Problem: A Critical Obstacle (Slides 1-2)
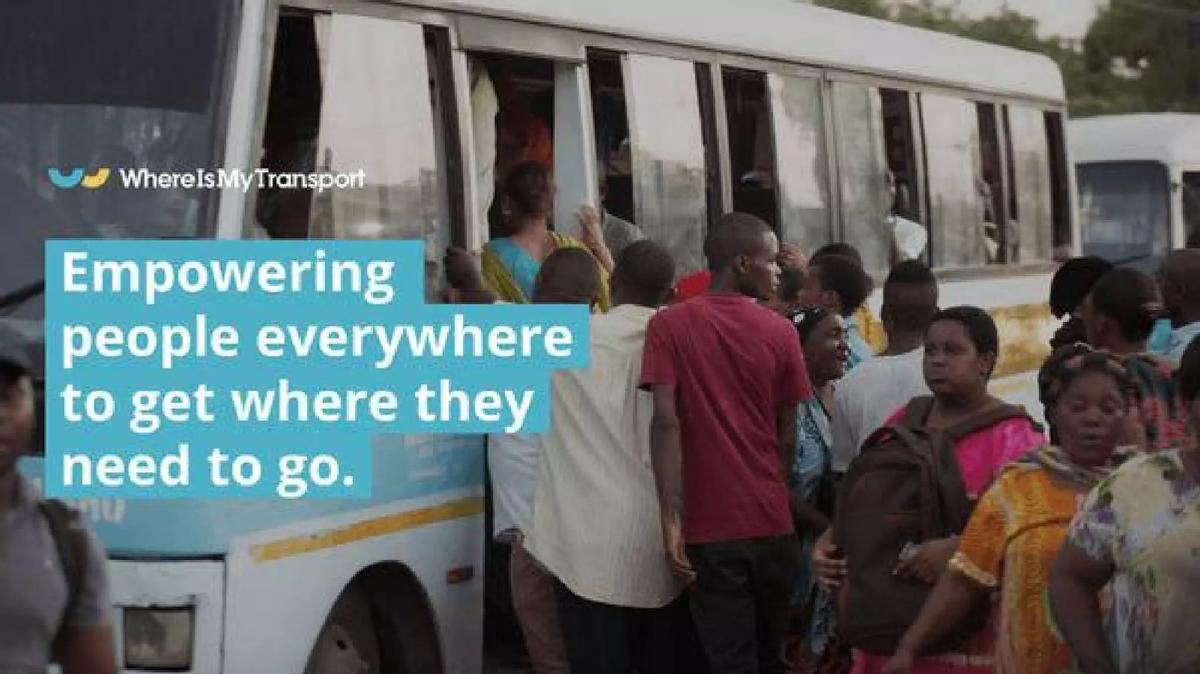
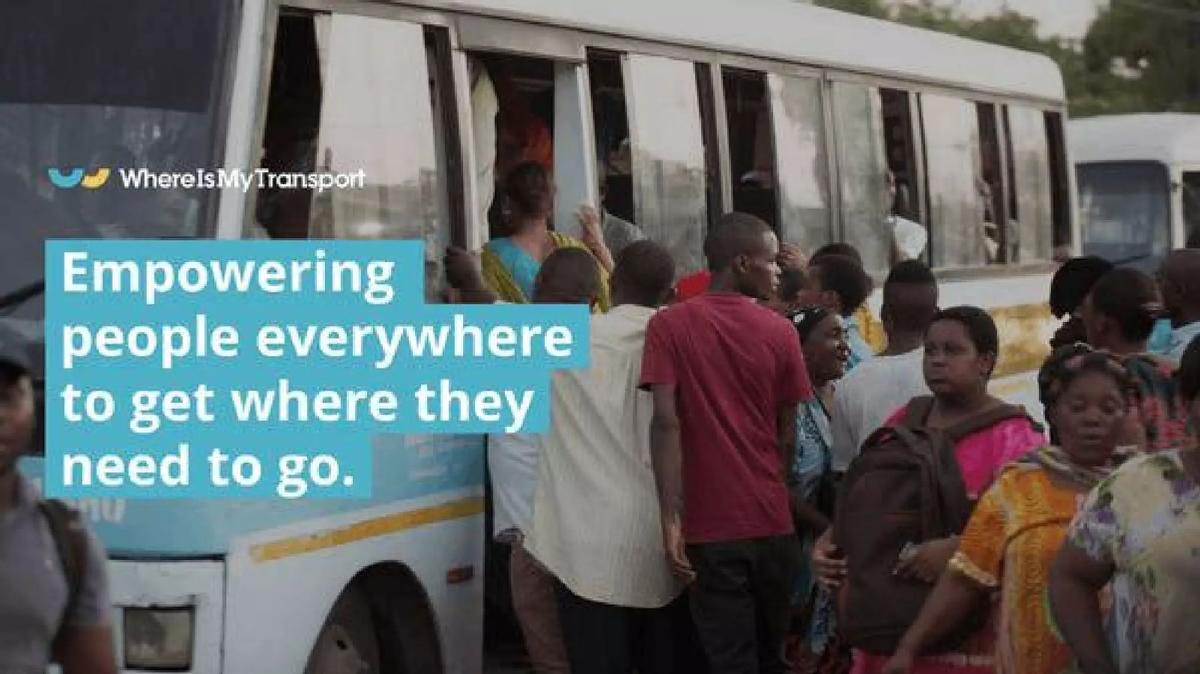
Slide 1 serves as the title card, featuring a high-resolution image of a crowded bus in an emerging market with the slogan, "Empowering people everywhere to get where they need to go." It immediately sets a social-impact tone while grounding the company in its specific geographic focus.
Slide 2 defines the problem with four staggering metrics. It states that 2 billion people rely entirely on public transport in emerging market cities, yet commuters spend an average of 5 hours traveling every day. Crucially, it notes that 80% of commuters rely on informal networks because they cannot access or afford formal modes, and families earning minimum wage spend up to 30% of their household income on transport. This slide successfully establishes the scale and the economic urgency of the problem.
The Market Gap: Developed vs. Majority World (Slide 3)
Slide 3 is perhaps the most important strategic slide in the deck. It asks, "Why has nobody solved this problem?" and provides a side-by-side comparison. On one side, it lists 'Developed Markets' where formal transport is dominant and served by Google, Citymapper, Moovit, and Transit. On the other side, it describes the 'Majority World,' where informal transport is dominant. The deck claims that 92% of the largest cities in these regions have no public transport map and that informal networks are up to 10x larger than formal ones. This positioning frames the incumbents not as competitors, but as players who are fundamentally ill-equipped for the company's target geography.
Product Evolution and The Playbook (Slides 4-5)
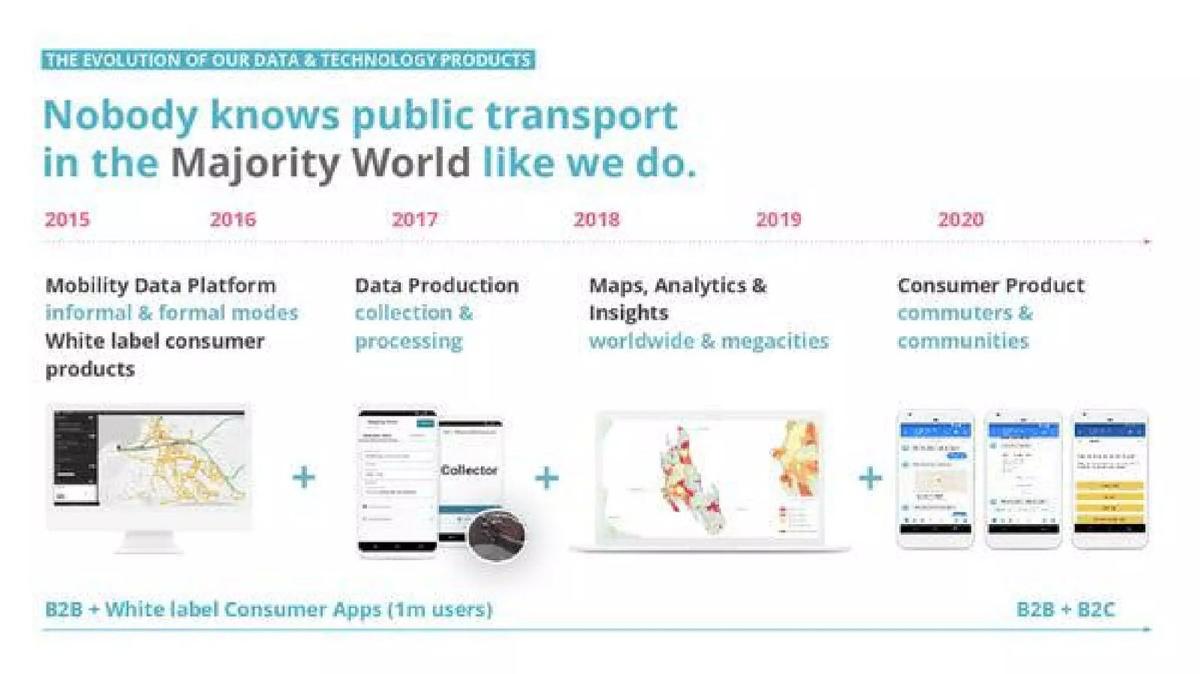
Slide 4 presents a timeline of product evolution from 2015 to 2020. It shows a transition from a B2B mobility data platform and white-label products (reaching 1 million users by 2016) to a full B2B + B2C suite including maps, analytics, and consumer products by 2020. This demonstrates a clear path from data infrastructure to consumer-facing utility.
Slide 5 details the "Leading Data Production Playbook." It breaks down a 6-week mapping cycle: Week 1 for recruitment, Week 2 for training, Weeks 4-6 for mapping completion, followed by ongoing updates. By showing the 'Collector App' and 'Production Tool Suite,' the company proves it has a repeatable operational process rather than just a vague idea. This slide is designed to de-risk the execution concerns investors might have about mapping chaotic cities.
Global Traction and Proof of Concept (Slides 6-7)
Slide 6 uses a world map to visualize the company's reach. The figures are impressive: 1,000,000+ kilometers mapped , 40 cities , 27 countries , and 4 continents . It also claims 1 million+ users and 100 million+ data transactions . This is pure traction, intended to show that the company is already the 'global leader' in this niche.
Slide 7 provides a deep dive into Mexico City (CDMX) to illustrate the data disparity. A bar chart shows that while there are only 450 formal tracks, there are 2,995 informal tracks (a 7x difference). Similarly, informal routes outnumber formal ones 1,390 to 199. The visual map of CDMX included on the slide makes the density of these informal networks undeniable, reinforcing the message that 'no meaningful commuter solution is possible' without this data.
Technology and Monetization (Slides 8-9)
Slide 8 explains the 'Living Data' platform. It shows a flow where journey plans and GPS locations from commuters are fed into the platform, which then outputs real-time info, service alerts, and refreshed mobility data. This creates a flywheel effect where the data becomes more accurate as more people use the service.
Slide 9 addresses monetization. The company admits a shift from public sector clients to "large global corporates," citing broader use cases and better funding. The slide lists high-profile logos including Shell Foundation, Facebook, Google, The World Bank, and Toyota Tsusho . It identifies four key revenue industries: Location Based Services, Infrastructure Providers, Automotive and Equipment, and Mobility-as-a-Service (MaaS). The presence of Google as both a potential competitor (on Slide 3) and a client (on Slide 9) is a sophisticated way to show market validation.
Team and Future Outlook (Slides 10-12)
Slide 10 showcases the team's global footprint. With 65+ in-office experts and 1000+ in-field collectors , the company emphasizes its human capital. The map highlights hubs in London, Cape Town, Mexico City, and San Francisco, suggesting a well-organized international operation.
Slide 11 looks forward to 2023, setting a goal to map 30 of the world's largest megacities , creating an addressable market of 300+ million daily commuters . This provides the 'venture scale' vision required for a Series-A round.
Slide 12 concludes with a list of investors, including Goodwell, Global Innovation Fund, Nedbank, and Omidyar Network . The slide ends on a confident note: "Nobody is better positioned than we are to provide new and innovative mobility solutions... in the Majority World."
What Works in This Deck
Clear Market Differentiation: The distinction between the 'Developed' and 'Majority' worlds is a powerful framing device that explains why existing giants haven't won this market yet. · Operational Detail: Slide 5's mapping playbook turns a daunting task into a manageable, 6-week process, which is essential for building investor trust in an operationally heavy business. · Visual Proof: The Mexico City comparison (Slide 7) is the strongest visual in the deck. It makes the 'invisible' informal network visible and quantifiable. · Blue-Chip Validation: Listing Facebook, Google, and the World Bank as clients or partners immediately elevates the company's credibility.
What Is Missing
Financial Specifics: There is no mention of current revenue, burn rate, or specific financial projections. While they mention 'proven sources of revenue,' they don't provide the numbers to back it up. · The Ask: The deck does not explicitly state how much money they are raising in this round or how they plan to spend the capital. · Unit Economics: There is no breakdown of the cost to map a city versus the lifetime value of the data generated from that city. · Competitor Analysis: While they mention Google and others as 'Developed Market' solutions, they don't address other startups that might be attempting to map informal transit in specific regions (e.g., Digital Matatus in Nairobi).
What a Founder Should Copy
The 'Why Now' Logic: Use a slide like Slide 3 to explain why the current market leaders are structurally incapable of solving the problem you have identified. · The Case Study Slide: If your product deals with complex data, use a single-city or single-client deep dive (like the Mexico City slide) to make the abstract concrete. · Traction Icons: Slide 6 is a masterclass in summarizing global scale. Use simple icons and large numbers to highlight your most impressive metrics. · Client Logos as Social Proof: If you have high-profile partners, don't just list them; categorize them by industry to show the breadth of your market appeal.
Frequently asked questions
- What is the primary problem WhereIsMyTransport is solving?
- The company addresses the lack of mobility data in emerging markets, which they refer to as the 'Majority World.' In these regions, 80% of commuters rely on informal, independently owned, and unsubsidized vehicle networks that are not mapped by traditional services like Google Maps or Citymapper. This data gap makes commuting inefficient, with users spending an average of 5 hours traveling daily.
- How does the company collect its data?
- WhereIsMyTransport utilizes a proprietary 'Data Production Playbook.' This involves recruiting a local team of data collectors (over 1,000 in total) who use a specialized 'Collector App' to map cities both actively and passively. According to the deck, this process takes between 4 to 6 weeks to produce a complete map of both formal and informal transport networks.
- Who are the company's main customers?
- While the company initially focused on the public sector, the deck notes a strategic shift toward large global corporates. Listed clients and partners include Shell Foundation, Facebook, Google, Toyota Tsusho, and the World Bank. They monetize through city data licenses for industries like infrastructure, automotive, and Mobility-as-a-Service (MaaS).
- What is the scale of the company's operations as of the deck's release?
- The company has mapped over 1,000,000 kilometers across 40 cities in 27 countries. They claim to have over 1 million users and have processed more than 100 million data transactions. Their team consists of 65+ in-office experts and a network of over 1,000 field collectors spread across four continents.
- What key fundraising information is missing from the deck?
- The deck is notably missing a formal 'Ask' slide, which typically details the amount of capital being raised and the specific valuation or terms. It also lacks a slide dedicated to unit economics, burn rate, or detailed five-year financial projections, focusing instead on operational milestones and market reach.