Whitestone REIT’s February 2018 investor presentation serves as a progress report for a public company scaling its portfolio of retail properties in high-growth Sunbelt markets. The deck emphasizes a disciplined geographic focus on Texas and Arizona, leveraging business-friendly climates and rapid population growth. Financial highlights include a significant jump in Annual Net Operating Income (NOI) from $19.3 million at the 2010 IPO to an annualized $89.5 million in 2017. The strategy is built on operational efficiency, with specific five-year goals to reduce debt leverage and scale general…
Key takeaways
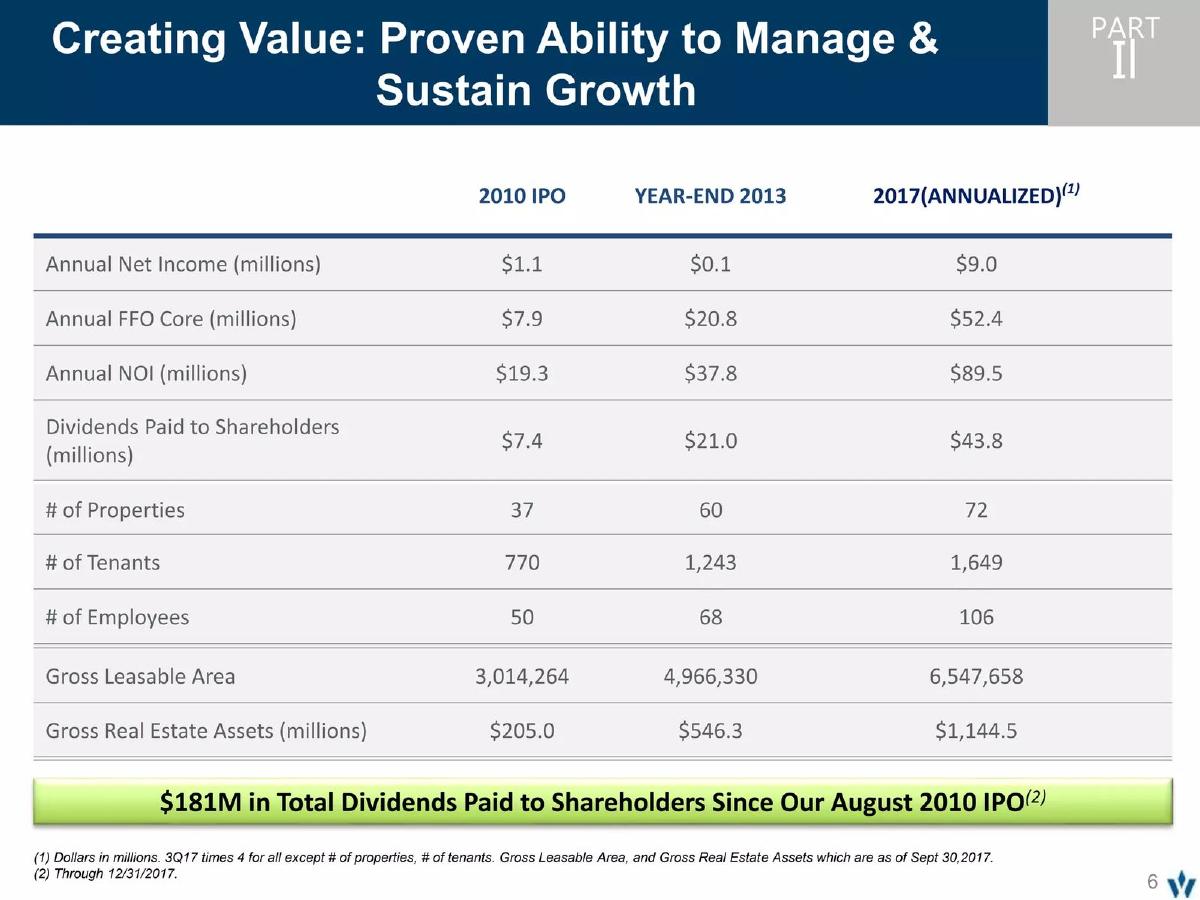
- Gross Real Estate Assets grew from $205.0 million at the 2010 IPO to $1,144.5 million by late 2017 (Slide 6).
- The company has paid $181 million in total dividends to shareholders since its August 2010 IPO (Slide 6).
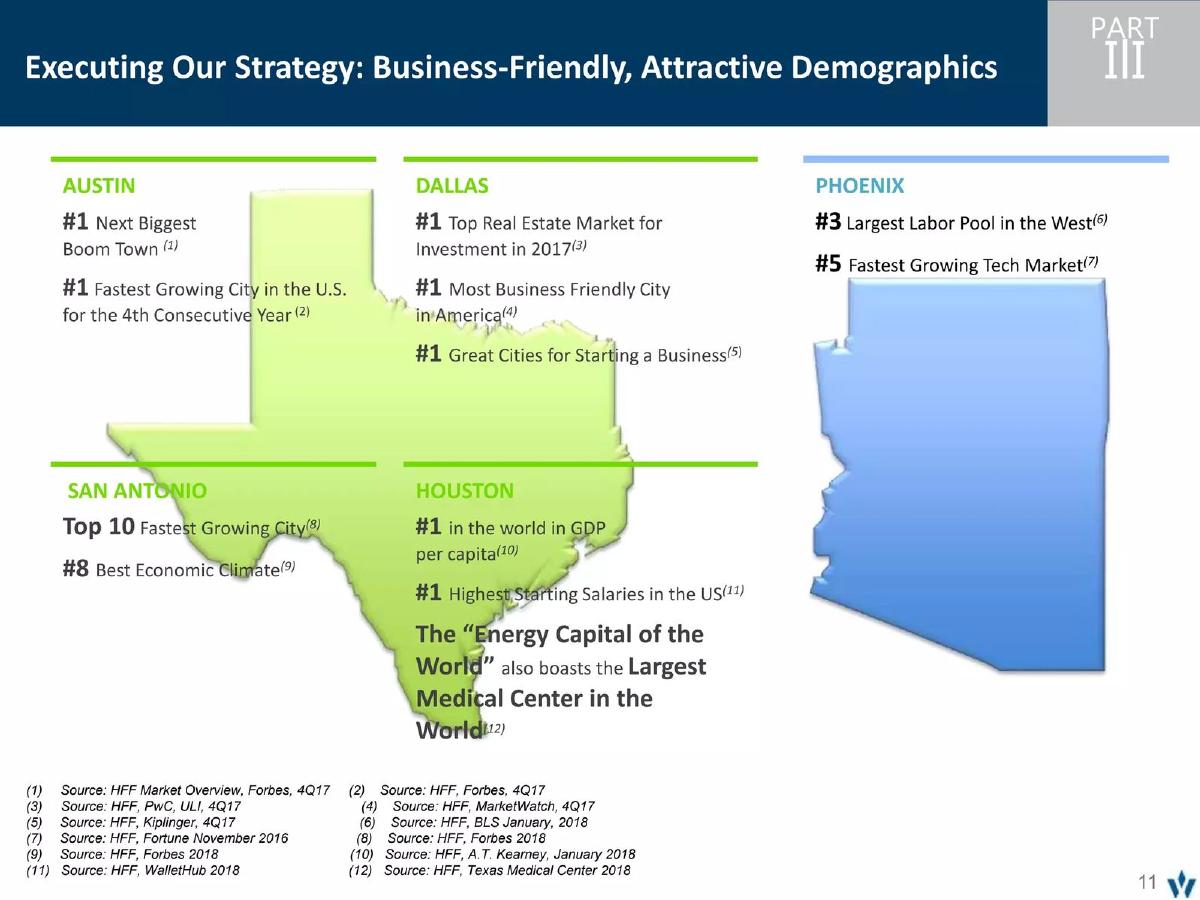
- Whitestone maintains a strict geographic focus on Texas (Austin, Dallas, San Antonio, Houston) and Arizona (Phoenix) (Slide 11).
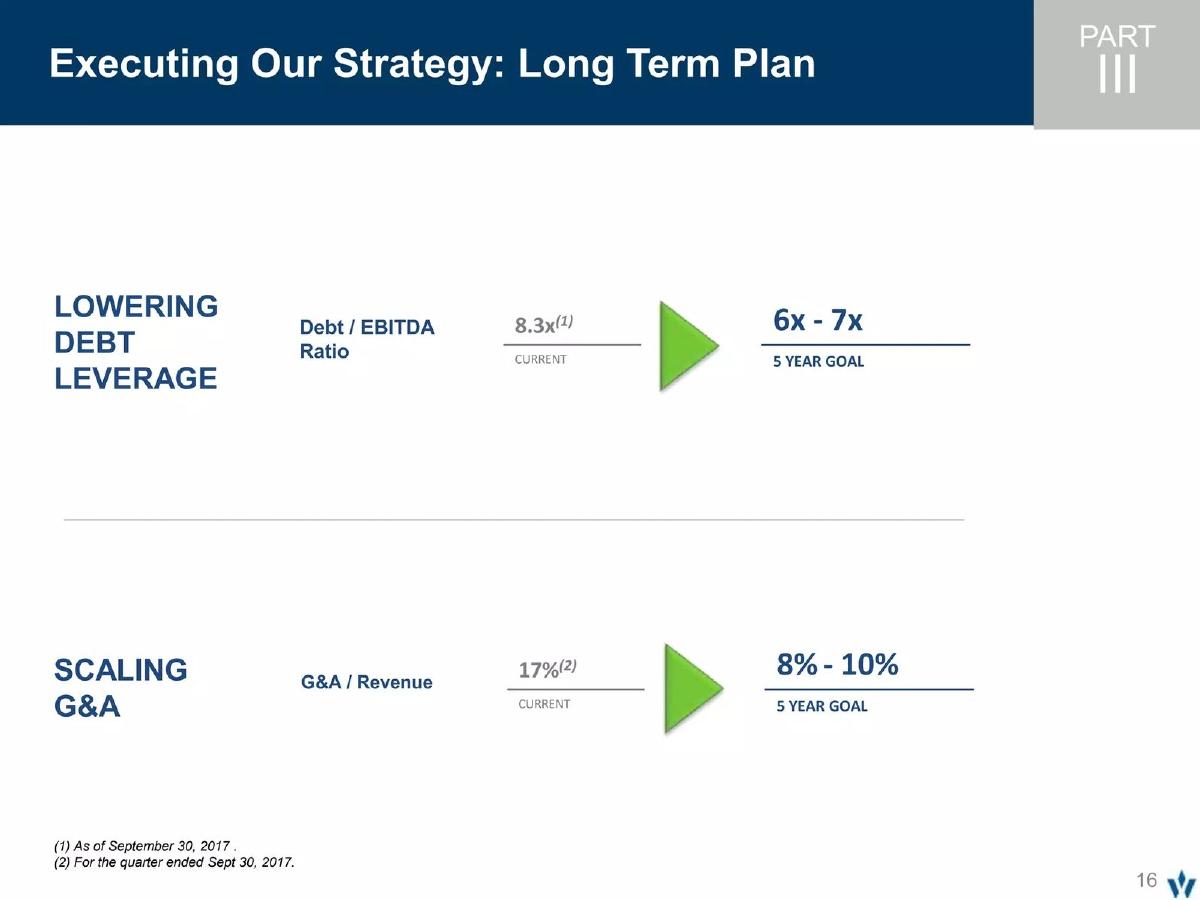
- Management has set a five-year goal to lower the Debt / EBITDA ratio from a current 8.3x to a target of 6x - 7x (Slide 16).
- The company aims to scale G&A as a percentage of revenue from 17% down to 8% - 10% over five years (Slide 16).
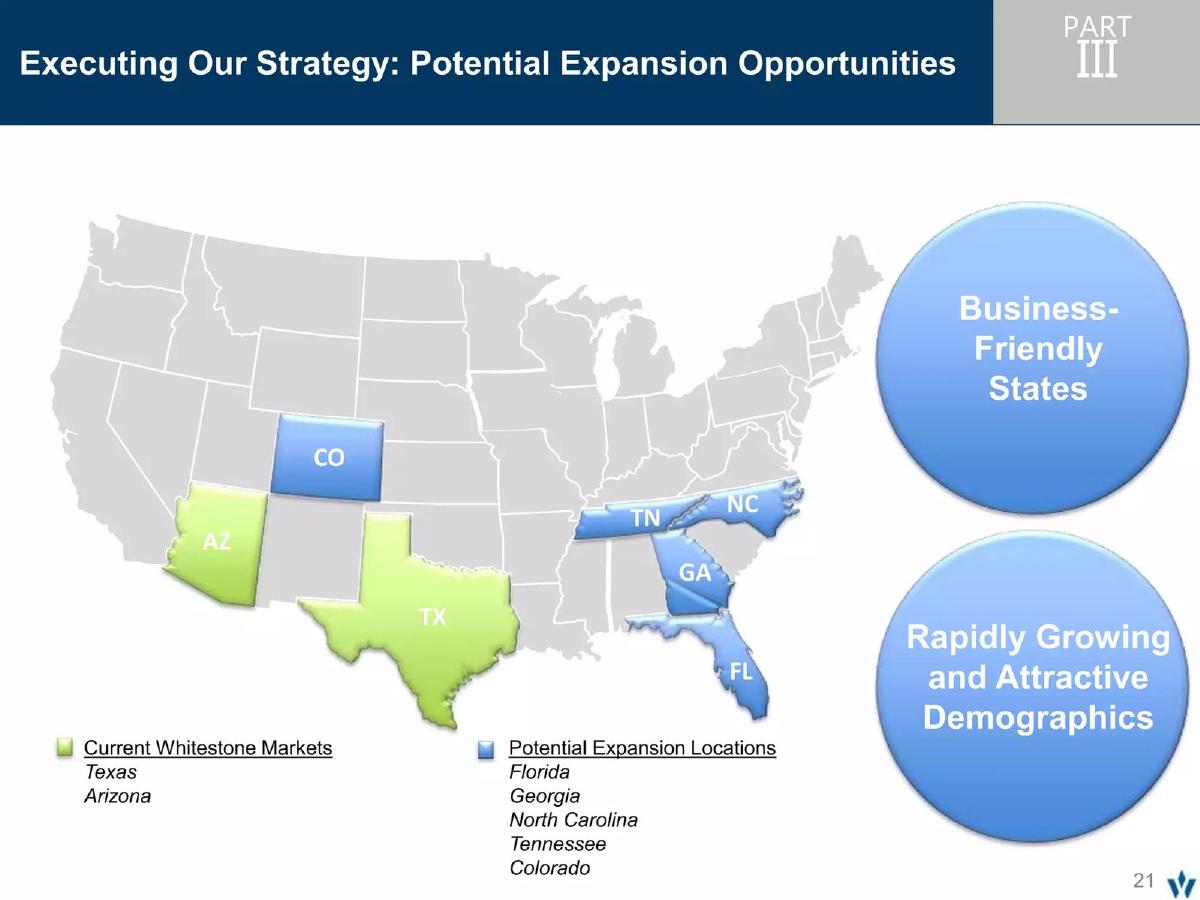
- Potential expansion targets include business-friendly states such as Florida, Georgia, North Carolina, Tennessee, and Colorado (Slide 21).
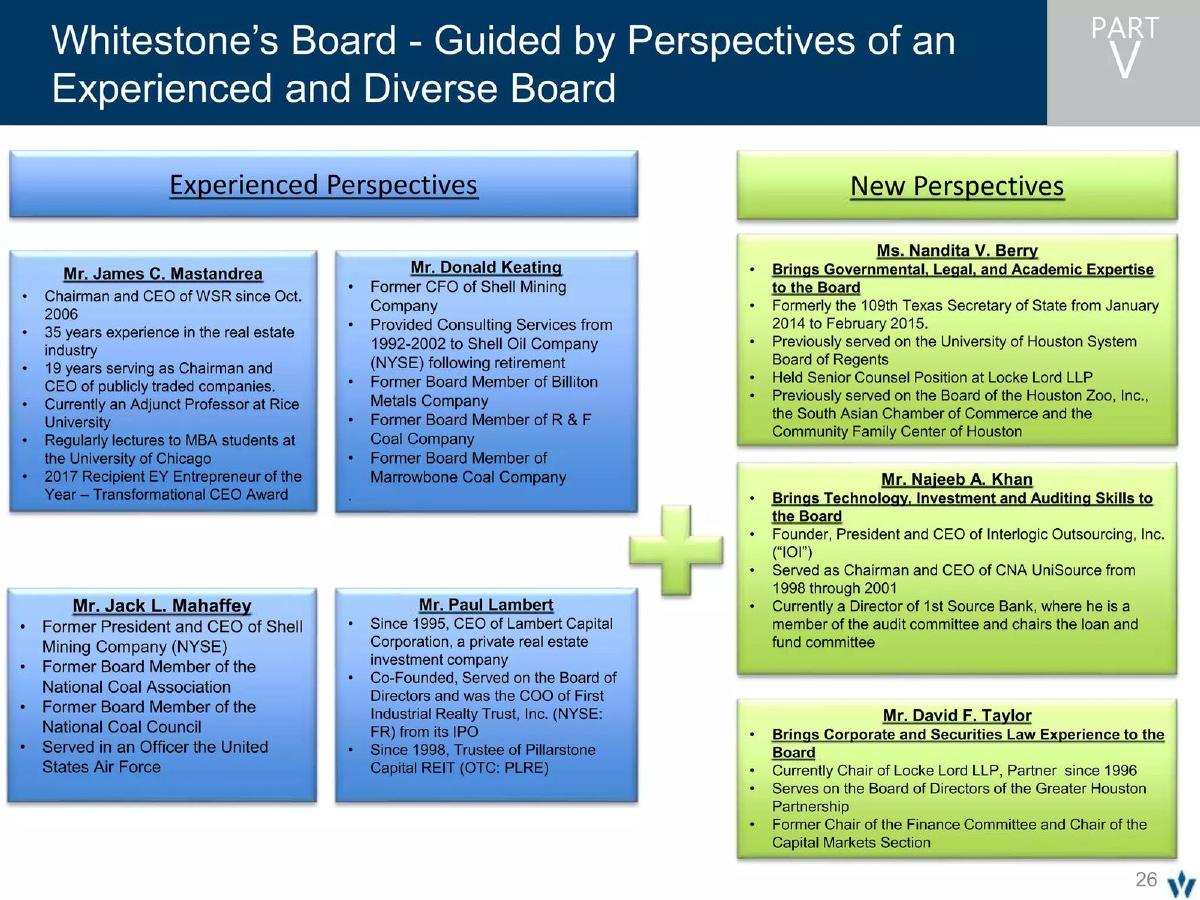
- The Board of Directors is segmented into 'Experienced Perspectives' and 'New Perspectives,' highlighting a mix of real estate veterans and legal/tech experts (Slide 26).
- Annual acquisition volume reached $205 million in 2017 YTD, representing an 18.1% CAGR since 2011 (Slide 31).
Whitestone REIT: A Study in Geographic Concentration and Operational Scaling
The February 2018 investor presentation for Whitestone REIT (NYSE: WSR) provides a detailed look at how a publicly traded real estate investment trust communicates its growth trajectory and operational discipline to the market. Unlike a startup pitch deck that seeks to validate a new concept, this deck is designed to validate a proven model and outline the path to increased profitability through scale.
Slide 1: Title and Visual Identity
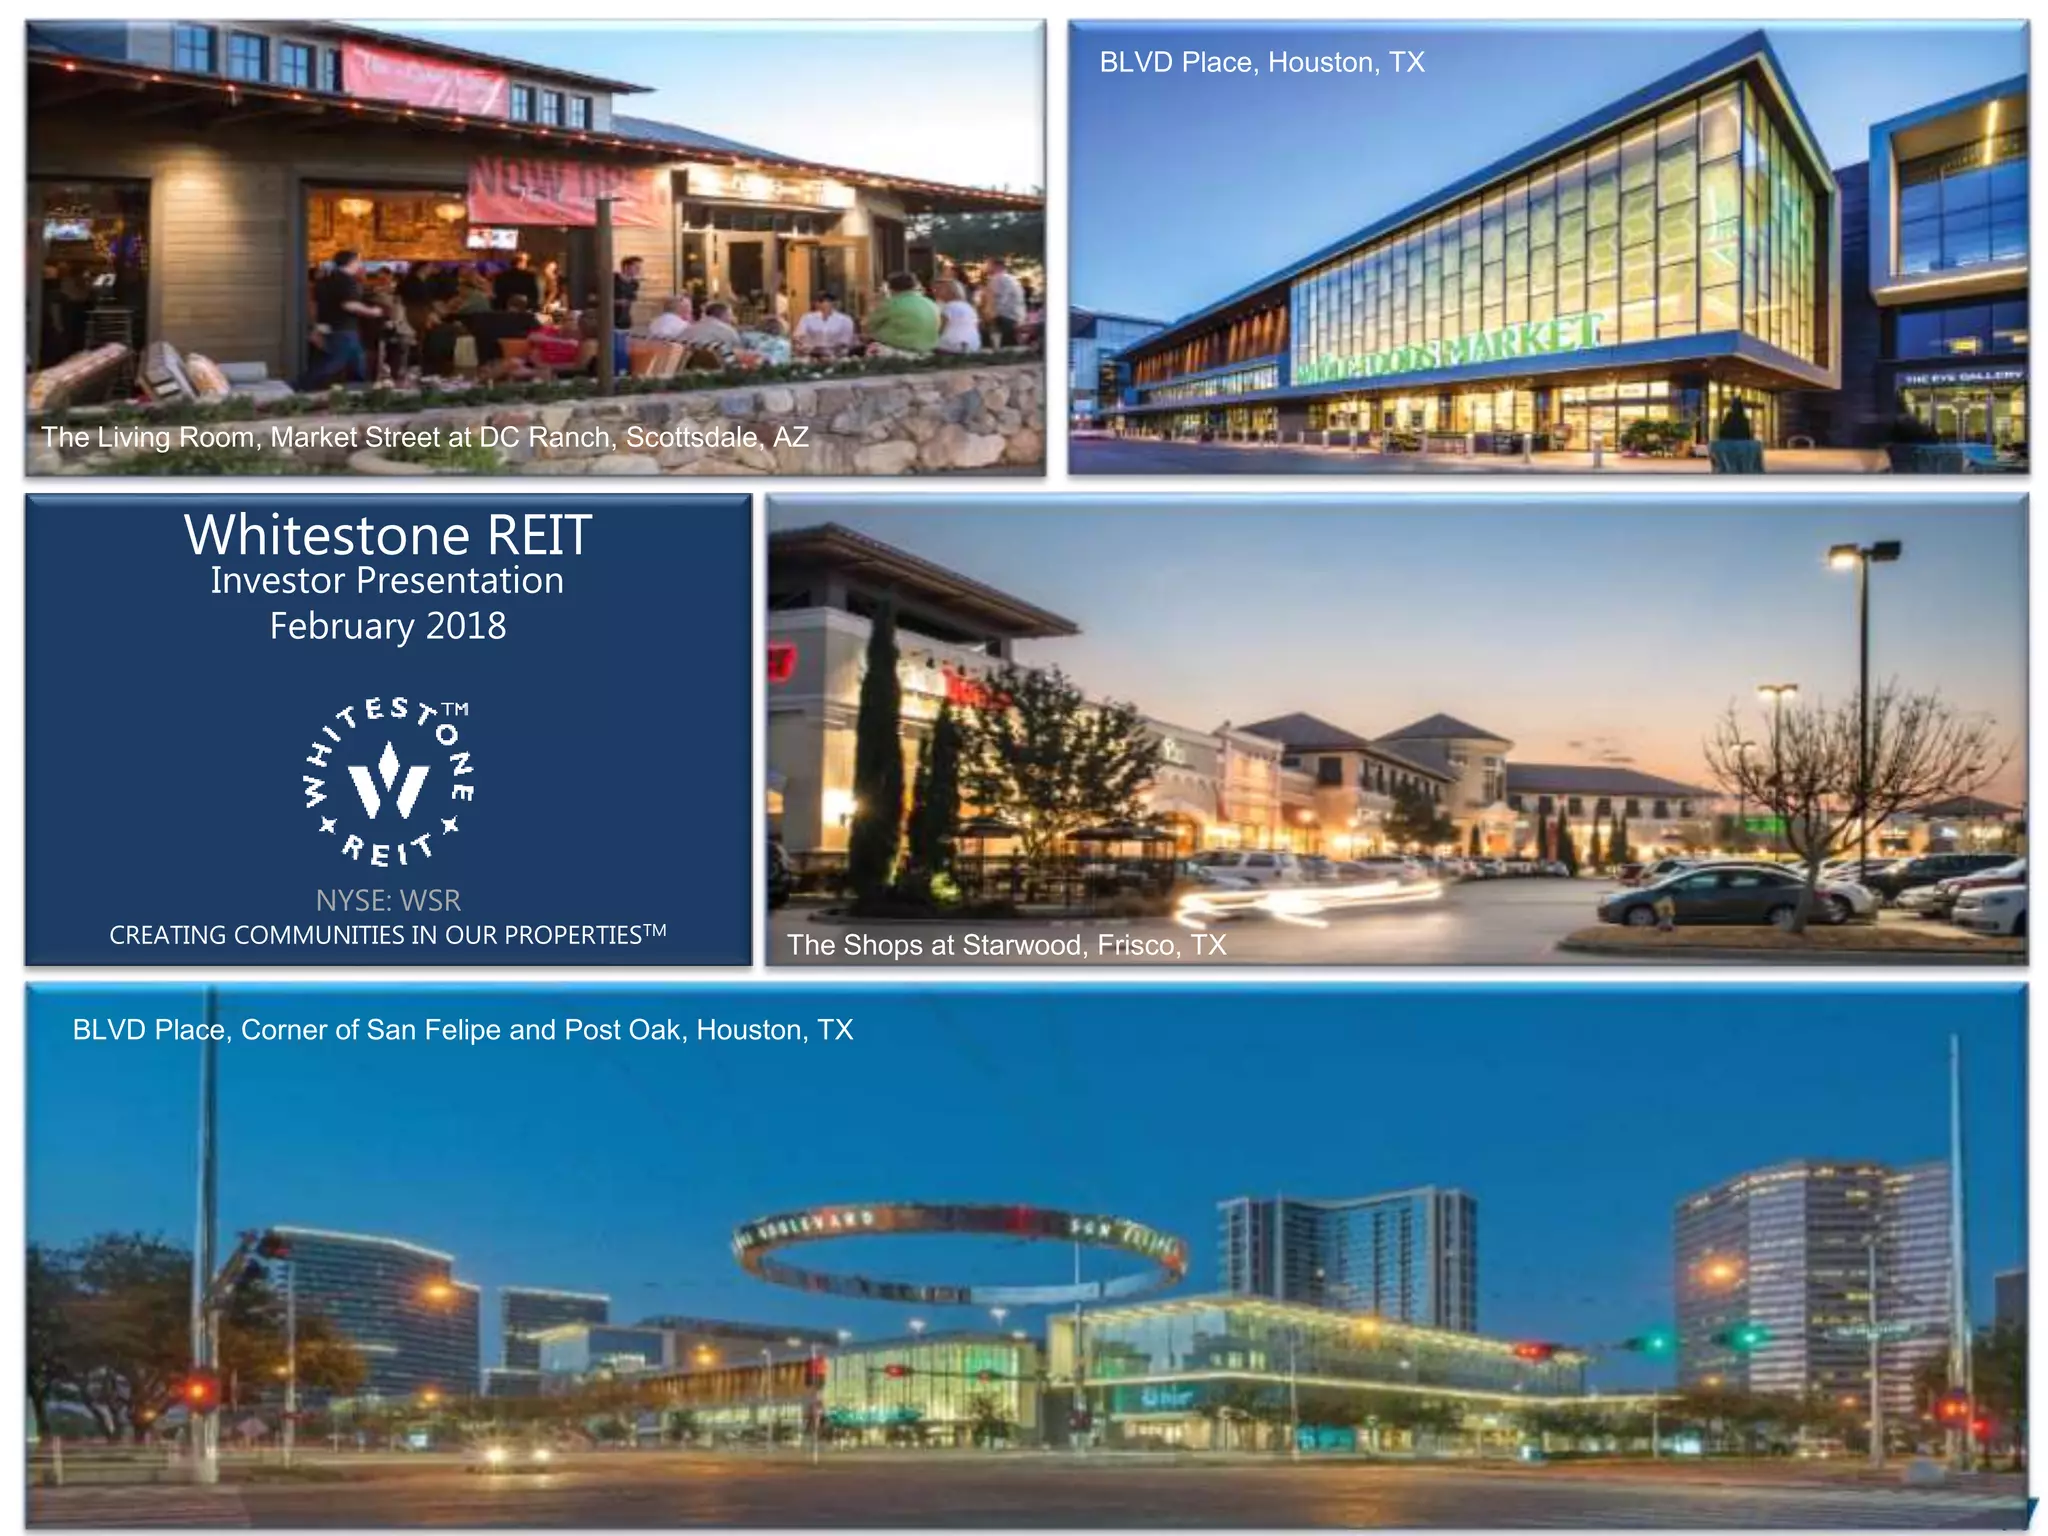
The cover slide establishes the brand's focus: 'Creating Communities in Our Properties.' It features high-quality photography of three flagship properties: The Living Room in Scottsdale, BLVD Place in Houston, and The Shops at Starwood in Frisco. This immediately grounds the presentation in physical assets, showing modern, well-lit, and active retail environments. The inclusion of the NYSE ticker (WSR) signals the company's maturity and public status.
Slide 6: Proven Ability to Manage & Sustain Growth
This is the 'Traction' slide of the deck, and it is exceptionally robust. It compares the company's 2010 IPO state to its 2017 annualized performance. Key metrics include:
Annual Net Income: Increased from $1.1 million to $9.0 million. · Annual FFO Core: Grew from $7.9 million to $52.4 million. · Annual NOI: Rose from $19.3 million to $89.5 million. · Gross Real Estate Assets: Scaled from $205.0 million to $1,144.5 million.
The slide also highlights that $181 million in total dividends have been paid since the IPO, a critical metric for REIT investors who prioritize yield.
Slide 11: Geographic Strategy and Demographics
Whitestone uses this slide to justify its concentration in Texas and Arizona. By citing third-party sources like Forbes, PwC, and MarketWatch, the company paints a picture of a 'business-friendly' environment. Notable stats include Austin being the '#1 Fastest Growing City in the U.S.' and Houston having the 'Largest Medical Center in the World.' This slide explains the 'Why' behind their location choices, suggesting that macroeconomic tailwinds in these specific cities drive property value and tenant stability.
Slide 16: The Long Term Plan
This slide addresses two potential investor concerns: leverage and overhead. It sets clear, quantifiable five-year goals:
Lowering Debt Leverage: Moving the Debt / EBITDA ratio from 8.3x to a range of 6x - 7x. · Scaling G&A: Reducing G&A as a percentage of revenue from 17% to 8% - 10%.
This transparency is useful for building trust; it acknowledges that current ratios may be high and provides a roadmap for improvement through growth.
Slide 21: Potential Expansion Opportunities
While the current focus is Texas and Arizona, this slide looks at the future. It identifies Florida, Georgia, North Carolina, Tennessee, and Colorado as 'Potential Expansion Locations.' The criteria for these markets remain consistent with their current strategy: business-friendly states with rapidly growing and attractive demographics. This signals to investors that the company has a repeatable playbook for new markets.
Slide 26: Board of Directors
The board slide is divided into 'Experienced Perspectives' and 'New Perspectives.' James C. Mastandrea (Chairman and CEO) is highlighted for his 35 years of industry experience. The 'New Perspectives' section includes individuals with backgrounds in law, technology, and government, such as Nandita V. Berry (former Texas Secretary of State). This suggests a board that is not just a 'boys club' of real estate developers but a diverse group capable of navigating complex regulatory and technological shifts.
Slide 31: Acquisition Activity
Found in the appendix but vital to the growth story, this slide shows a 18.1% CAGR in annual acquisition volumes from 2011 to 2017. The bar chart shows a steady climb, peaking at $205 million in 2017 YTD. A pie chart indicates a nearly even split in geographic distribution of total acquisitions since the IPO: 53% in Texas and 47% in Arizona.
Slide 36: Leasing Activity and Spreads
This slide provides granular detail on operational performance. It shows 'Executed Leases' peaking in 2016 at 1,121,000 square feet. More importantly, it lists 'Leasing Spreads'—the percentage increase in rent for renewals—ranging from +2.0% to +9.4%. The 'Expiring Leases' chart shows a significant volume of square footage coming up for renewal in 2019 and 2020, which the company frames as an opportunity to capture 'growth from below market leases.'
Slide 41: EBITDA Reconciliation
The final slide is a technical accounting table reconciling Net Income to EBITDA from 2010 through Q3 2017. This level of financial transparency is standard for public companies but serves as a reminder of the rigorous reporting required in the REIT sector. It shows EBITDA growing from $14.3 million in 2010 to $44.4 million for the first nine months of 2017.
What Whitestone REIT Does Well
The deck is a masterclass in using historical data to project future stability. By showing a consistent upward trend in assets, income, and dividends over a seven-year period, Whitestone minimizes the perceived risk of their expansion plans. The use of third-party data to validate their geographic choices (Slide 11) removes the 'opinion' factor from their strategy, making it appear as a logical response to market data.
Furthermore, the clear 'Long Term Plan' (Slide 16) is highly effective. Many decks fail because they don't address their own weaknesses. By explicitly stating that they intend to lower debt and G&A, Whitestone preempts the most likely criticisms from analysts and shows they have a plan for operational maturity.
What is Missing from the Deck
Despite the wealth of data, there are a few omissions that a private equity or venture investor might look for:
Unit Economics by Property Type: While they show total portfolio growth, they don't break down the performance difference between their various retail formats (e.g., grocery-anchored vs. service-oriented). · Competitor Benchmarking: The deck exists in a vacuum. It does not compare Whitestone’s performance or cap rates to other retail REITs like Kimco or Regency Centers. · Technology Integration: For a 2018 deck, there is very little mention of how they are adapting to the 'retail apocalypse' or the rise of e-commerce, other than a brief mention of 'service-oriented' tenants.
What Founders Should Copy
Founders in capital-intensive industries (like PropTech or Fintech) should emulate Whitestone’s approach to Geographic Validation . Don't just say you are launching in a city; use data to prove that city is the most fertile ground for your specific business model.
Another key takeaway is the Strategic Roadmap for Efficiency . If your startup currently has high burn or inefficient margins, don't hide it. Create a slide like Slide 16 that shows exactly what the target ratio is and the timeframe for reaching it. Investors are often willing to overlook current inefficiencies if there is a credible, data-backed plan to fix them through scale.
Finally, the Board Composition slide (Slide 26) is a great template. Instead of just listing names and logos, Whitestone explains the 'Perspective' each member brings. This helps investors understand the 'brain trust' behind the company and how different skill sets complement the CEO’s vision.
Frequently asked questions
- What is Whitestone REIT's core investment thesis?
- Whitestone REIT focuses on 'Creating Communities in Our Properties,' specifically targeting retail centers in high-growth, business-friendly markets. By concentrating on Texas and Arizona, they capitalize on top-tier demographics and economic climates. Their strategy involves acquiring underperforming properties, improving the tenant mix to include service-oriented businesses, and scaling operations to reduce overhead costs relative to revenue.
- How has the company performed financially since its IPO?
- The company shows significant growth across all key REIT metrics. Between its 2010 IPO and 2017, Annual NOI increased from $19.3 million to $89.5 million. The number of properties grew from 37 to 72, and the number of tenants more than doubled from 770 to 1,649. Most notably, the gross leasable area expanded from approximately 3 million to over 6.5 million square feet.
- What are the primary risks or areas for improvement identified in the deck?
- The deck explicitly identifies debt leverage and G&A expenses as areas for optimization. With a current Debt / EBITDA ratio of 8.3x, the company is focused on deleveraging to a 6x-7x range. Additionally, their G&A at 17% of revenue is relatively high for the sector, leading to a stated goal of reducing this to 8-10% through increased scale and operational efficiency.
- What does the lease expiration schedule look like?
- As of the 2018 presentation, Whitestone had a weighted average remaining lease term of 4.2 years. The expiration schedule shows a peak in 2019 and 2020, with 954,000 and 958,000 square feet expiring respectively. The company views this as an opportunity to 'capture growth from below market leases,' suggesting they intend to raise rents as these contracts renew.
- How is the company's leadership structured?
- The board is led by Chairman and CEO James C. Mastandrea, who has been in the role since 2006. The deck highlights a balance between long-tenured real estate and energy sector veterans (like Donald Keating and Jack Mahaffey) and newer members who bring expertise in government, law, and technology (such as Nandita Berry and Najeeb Khan).