Duco’s 2018 Series B deck is a metric-heavy presentation designed for sophisticated institutional investors. The company, which provides self-service data integrity and reconciliation software, uses this deck to prove that its 'low-touch' SaaS model can successfully penetrate the complex, often high-friction world of global banking. By showcasing specific 'land-and-expand' case studies where initial £60k-£180k contracts grew by 2.1x to 3.4x within two years, Duco builds a credible narrative for reaching a $100m ARR target. While the deck redacts specific CAC and LTV figures in this public ver…
Key takeaways
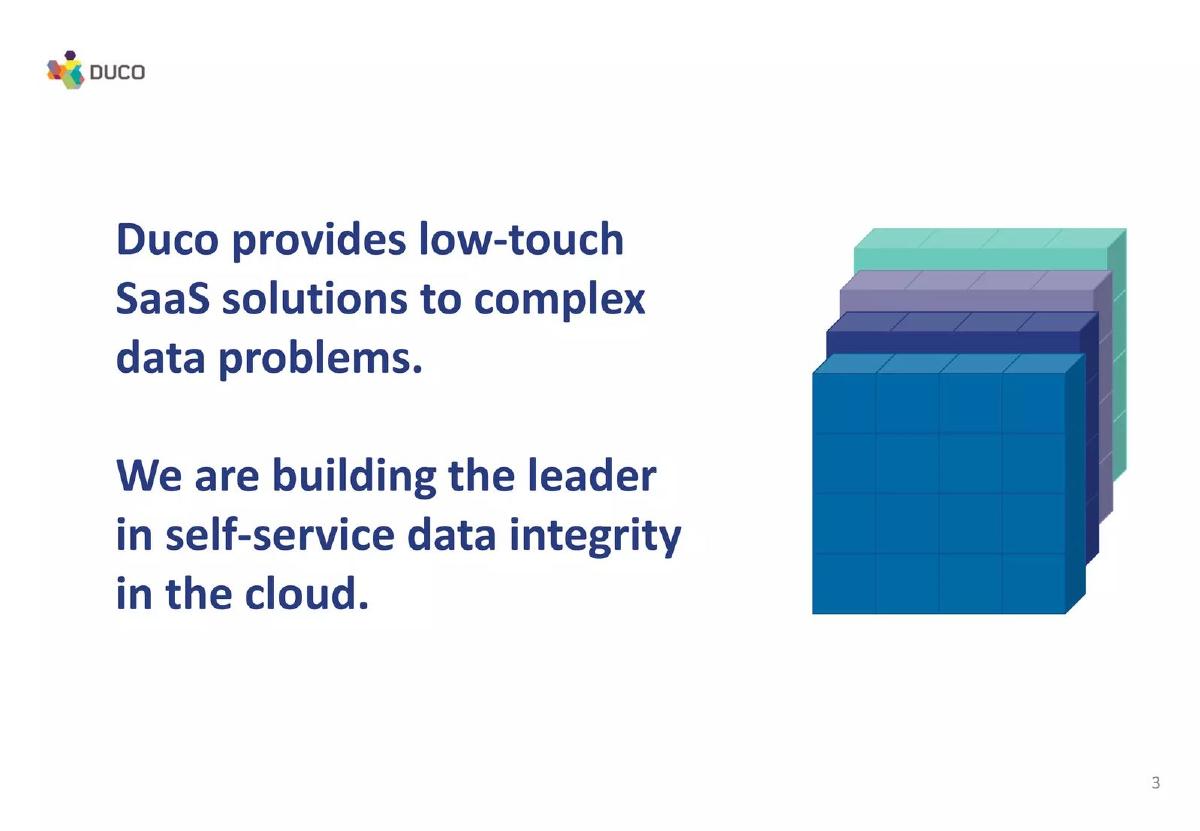
- The company defines itself as a leader in self-service data integrity in the cloud, focusing on low-touch SaaS for complex data (Slide 3).
- Duco presents a plausible roadmap to $100m ARR by targeting 850 firms across six financial sub-sectors, including 20 universal banks at a $1.5m target each (Slide 6).
- Contracted ACV grew from £0.8m in 2015 to £3.6m in 2017, representing a 98% year-over-year increase (Slide 9).
- The business model demonstrates high stickiness with a negative net revenue churn of -47% in FY17 and a projected -33% for FY18 (Slide 9).
- Execution strategy relies on a viral 'land-and-expand' model, starting with narrow use cases like trade reconciliation before expanding to inter-system recs (Slide 12).
- Real-world evidence of expansion is shown through three client examples, with one growing from £180k to £610k ARR in just 15 months (Slide 15).
- The company identifies a massive total addressable market by listing integrity issues in non-financial verticals like Insurance, Medical, and Telecom (Slide 21).
- A detailed timeline shows a significant pivot in 2013, moving from selling software to JP Morgan and Credit Suisse to launching the Duco Cube SaaS platform (Slide 27).
Introduction and Value Proposition
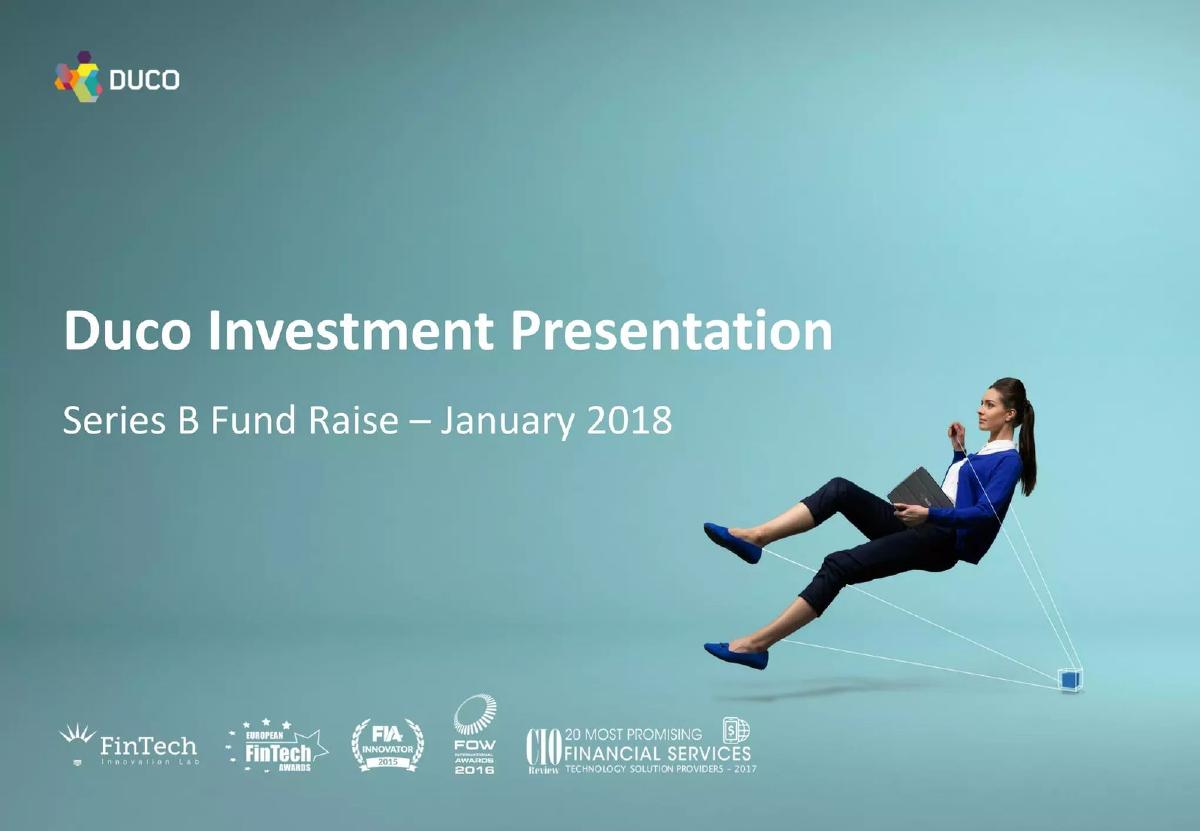
The Duco Series B pitch deck, dated January 2018, is a highly structured document aimed at institutional investors. It moves quickly from high-level vision to granular financial performance. The cover (Slide 1) immediately establishes credibility by displaying five industry awards, including the FinTech Innovation Lab and CIO Review’s 20 Most Promising Financial Services Technology Solution Providers 2017.
Defining the Solution
On Slide 3, Duco defines its market position with two clear statements: they provide "low-touch SaaS solutions to complex data problems" and are building the "leader in self-service data integrity in the cloud." The use of the term "low-touch" is critical here; it signals to investors that unlike traditional enterprise software that requires months of professional services and implementation, Duco can be deployed rapidly, leading to faster time-to-value and higher margins.
The Path to $100m ARR
Slide 6 is one of the most important slides for a Series B investor. It moves away from theoretical TAM (Total Addressable Market) and provides a "plausible example" of how the company reaches $100 million in Annual Recurring Revenue. The table breaks down the target market into six segments:
Universal Banks: 20 firms at $1,500,000 average ARR ($30m total). · Retail Banks: 100 firms at $250,000 average ARR ($25m total). · Brokers: 150 firms at $100,000 average ARR ($15m total). · Asset Managers: 50 firms at $300,000 average ARR ($15m total). · Hedge Funds: 300 firms at $40,000 average ARR ($12m total). · Payment Companies: 30 firms at $100,000 average ARR ($3m total).
This bottom-up approach to market sizing is far more convincing than a top-down "1% of a $10B market" slide because it shows the company understands its unit economics and sales targets per segment.
Growth and Retention Metrics
Slide 9 presents the core financial health of the business. Even with some redactions in this version of the deck, the visible numbers are impressive. Contracted ACV (Annual Contract Value) grew from £0.8m in 2015 to £1.8m in 2016 (+119%), reaching £3.6m in 2017 (+98%). For the then-current FY18E, they projected £6.5m in ACV.
The standout metric on this slide is Net Rev Churn . In FY17, it was -47%. Negative churn is the holy grail of SaaS; it means that the growth from existing customers (upsells and expansions) is significantly outweighing the loss from customers leaving. Even the projected -33% for FY18E indicates a very healthy, sticky product. The deck also notes a Gross Margin of 74% for FY18E, which is standard for a healthy SaaS business but impressive for one operating in the complex financial services sector.
Execution Strategy: Land and Expand
The Viral Velocity Model
Slide 12 illustrates the "Land and Expand" strategy. Duco identifies a "narrowest, most urgent use case" as the insertion point—specifically trade and order reconciliation. Once inside a global bank's middle office department, the product naturally flows into other use cases like portfolio reconciliation, inter-system recs, and collateral management. This reduces the friction of the initial sale while maximizing the lifetime value of the customer.
Proven Case Studies
Slide 15 provides the evidence for the strategy outlined on slide 12. It shows three specific client growth trajectories:
Client 1: 3.4x growth. Started at £180k ARR; grew to £610k ARR within 1 year and 3 months. · Client 2: 3.4x growth. Started at £60k ARR; grew to £205k ARR within 1 year. · Client 3: 2.1x growth. Started at £180k ARR; grew to £378k ARR within 1 year and 11 months.
These charts are powerful because they prove that the expansion isn't just theoretical—it is a repeatable pattern across their customer base.
Future Market Expansion
While the current focus is clearly financial services, Slide 21 looks toward the future. It identifies "Integrity issues exist in all verticals," listing Insurance, Medical, Retail/Logistics, and Telecom. By highlighting commonalities like "General ledger, finance/treasury, customer and CRM data," Duco argues that their technology is a horizontal solution that just happened to start in the most demanding vertical (finance). This suggests a much larger long-term TAM than the $100m ARR roadmap initially implies.
Company History and The Pivot
Slide 27 provides a chronological history of the company. It reveals that Duco was not an overnight success but the result of a significant strategic shift. Between 2010 and 2012, the team was building a SaaS platform and having market conversations while selling traditional software to JP Morgan and Credit Suisse. The "Pivot time!" in 2013 involved killing the old software business and launching "Duco Cube." This history shows a management team capable of making hard decisions to pursue a more scalable business model.
What is Missing from the Deck
As this is a teardown of a specific set of slides, there are notable omissions that were likely present in the full 28-slide version or the redacted sections:
Team Slide: The provided slides do not include the leadership team or board of directors. For a Series B, the pedigree of the executive team and their ability to scale is a primary concern for investors. · Unit Economics (Redacted): Slide 9 has redacted the ARPA (Average Revenue Per Account), CAC (Customer Acquisition Cost), CAC Payback, and LTV (Lifetime Value). While the growth and churn numbers are excellent, investors would need to see these to understand the efficiency of the capital being raised. · Competition: There is no mention of legacy competitors (like SunGard or SmartStream) or newer fintech rivals. A Series B deck usually needs to explain why the company is winning against specific incumbents. · The Ask: The specific amount of capital being raised and the intended use of funds are not shown in these slides.
What Founders Should Copy
Founders building enterprise SaaS should take note of several elements in this deck:
The "Plausible" Roadmap: Instead of just showing a huge TAM, show exactly how many customers in which segments get you to $100m. It demonstrates operational maturity. · Negative Churn as a Hero Metric: If you have negative net revenue churn, it should be front and center. It is the strongest evidence of product-market fit and long-term viability. · Visualizing Expansion: Slide 15's simple line charts showing account growth over time are incredibly effective. They turn a vague concept ("we upsell customers") into a proven, measurable reality. · The Insertion Point: Clearly defining the "narrowest, most urgent use case" (Slide 12) shows that you understand how to actually get through the door of a large, bureaucratic organization.
Frequently asked questions
- What is Duco's core product offering?
- Based on slide 3, Duco provides 'low-touch SaaS solutions to complex data problems.' Specifically, they focus on self-service data integrity in the cloud. This allows financial institutions to reconcile data across different systems without the heavy lifting typically associated with legacy enterprise software installations.
- How does Duco plan to reach $100 million in ARR?
- Slide 6 outlines a 'plausible example' for reaching $100m ARR. The strategy involves capturing 850 firms. The bulk of the revenue is projected to come from 20 Universal Banks ($30m total), 100 Retail Banks ($25m total), and 150 Brokers ($15m total), with the remainder coming from asset managers, hedge funds, and payment companies.
- What are the key growth metrics shown in the deck?
- Slide 9 highlights significant momentum: Contracted ACV grew 119% in 2016 and 98% in 2017, reaching £3.6m. Most notably, the company reported negative net revenue churn of -47% in FY17, indicating that existing customers are expanding their spend significantly faster than any cancellations are occurring.
- What does the 'land-and-expand' strategy look like in practice?
- Slide 15 provides three specific case studies. For example, 'Client 1' started with an £180k ARR insertion point for system migration and excel elimination. Within 15 months, that account grew 3.4x to £610k ARR. This demonstrates the 'viral' internal velocity mentioned on slide 12.
- What was the 'pivot' mentioned in the company history?
- Slide 27 shows that between 2010 and 2012, the company was selling traditional software to banks like JP Morgan. In 2013, they underwent a 'Pivot time!' where they killed the old software business, created the Duco brand, and launched 'Duco Cube,' their current SaaS platform.