Diplomat's September 2015 investor deck serves as a comprehensive overview of a scaled healthcare player transitioning through significant growth phases. With 2014 revenues reaching $2.2 billion and a projected climb to $3.3 billion for 2015, the company emphasizes its position as the largest independent specialty pharmacy in the U.S. The narrative centers on 'limited distribution' drugs—a high-barrier-to-entry model that accounted for 40% of their 2014 revenue. By highlighting a 63% CAGR from 2005 to 2014 and a strategic shift toward high-margin specialty infusions through acquisitions like…
Key takeaways
- Diplomat reported a 63% Compound Annual Growth Rate (CAGR) in revenue from 2005 to 2014, reaching $2.215 billion (Slide 6).
- The company held a 3% market share in a $78 billion total market in 2014, positioning it as the largest independent player behind CVS, Express Scripts, and Walgreens (Slide 6).
- Limited distribution drugs are a core moat, representing 40% of 2014 revenue and providing exclusive or semi-exclusive access to high-value medications (Slide 9).
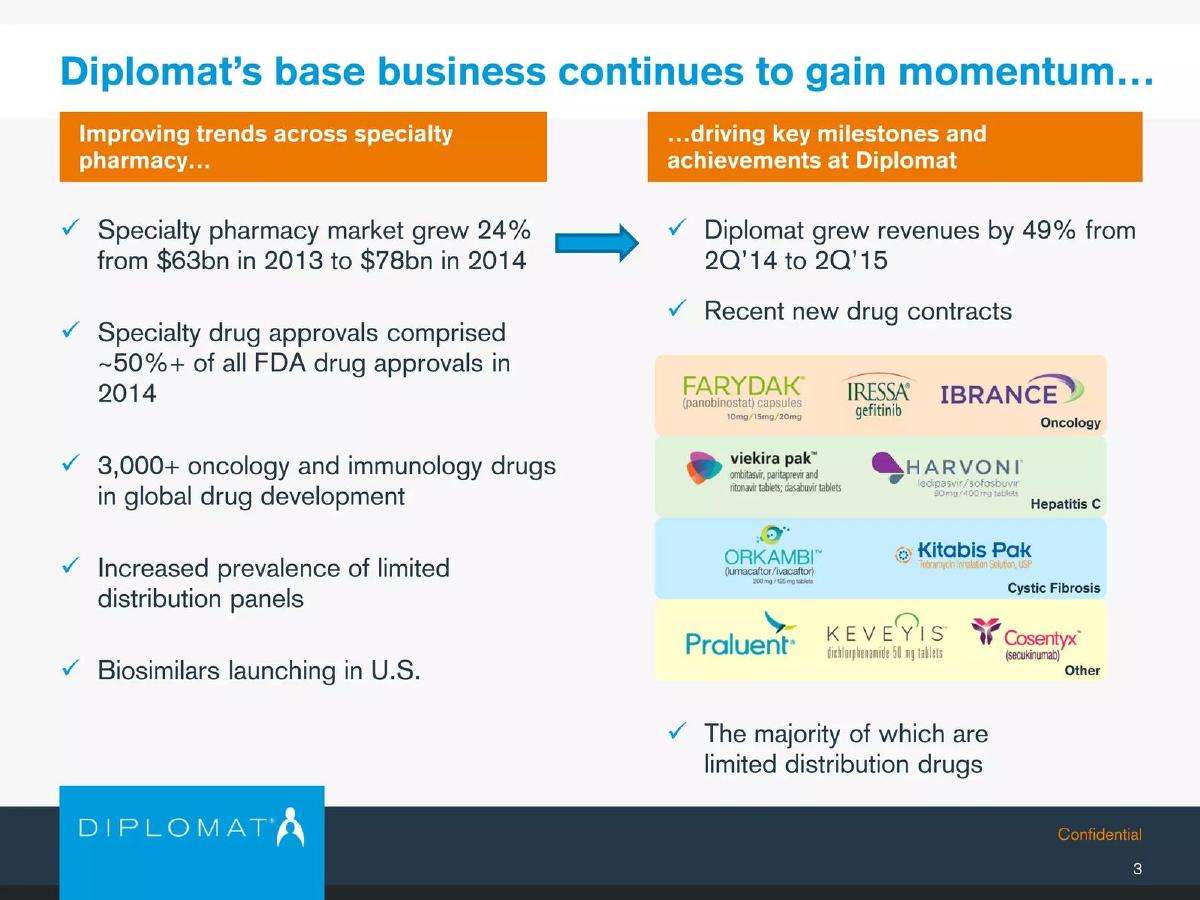
- Revenue grew 49% year-over-year from 2Q'14 to 2Q'15, driven by new drug contracts in oncology and immunology (Slide 3).
- The acquisition of BioRx significantly boosted margins, bringing in a 29% gross margin and approximately 10% EBITDA margin (Slide 12).
- Adjusted EBITDA grew 141% when comparing the first six months of 2014 ($14 million) to the first six months of 2015 ($34 million) (Slide 18).
- The deck explicitly outlines an M&A strategy focused on targets that make the company 'better, not just bigger' (Slide 15).
- Financial transparency is high, including a full reconciliation of Net Income to Adjusted EBITDA, accounting for M&A expenses and share-based compensation (Slide 24).
Introduction: The Human Element of High-Scale Healthcare
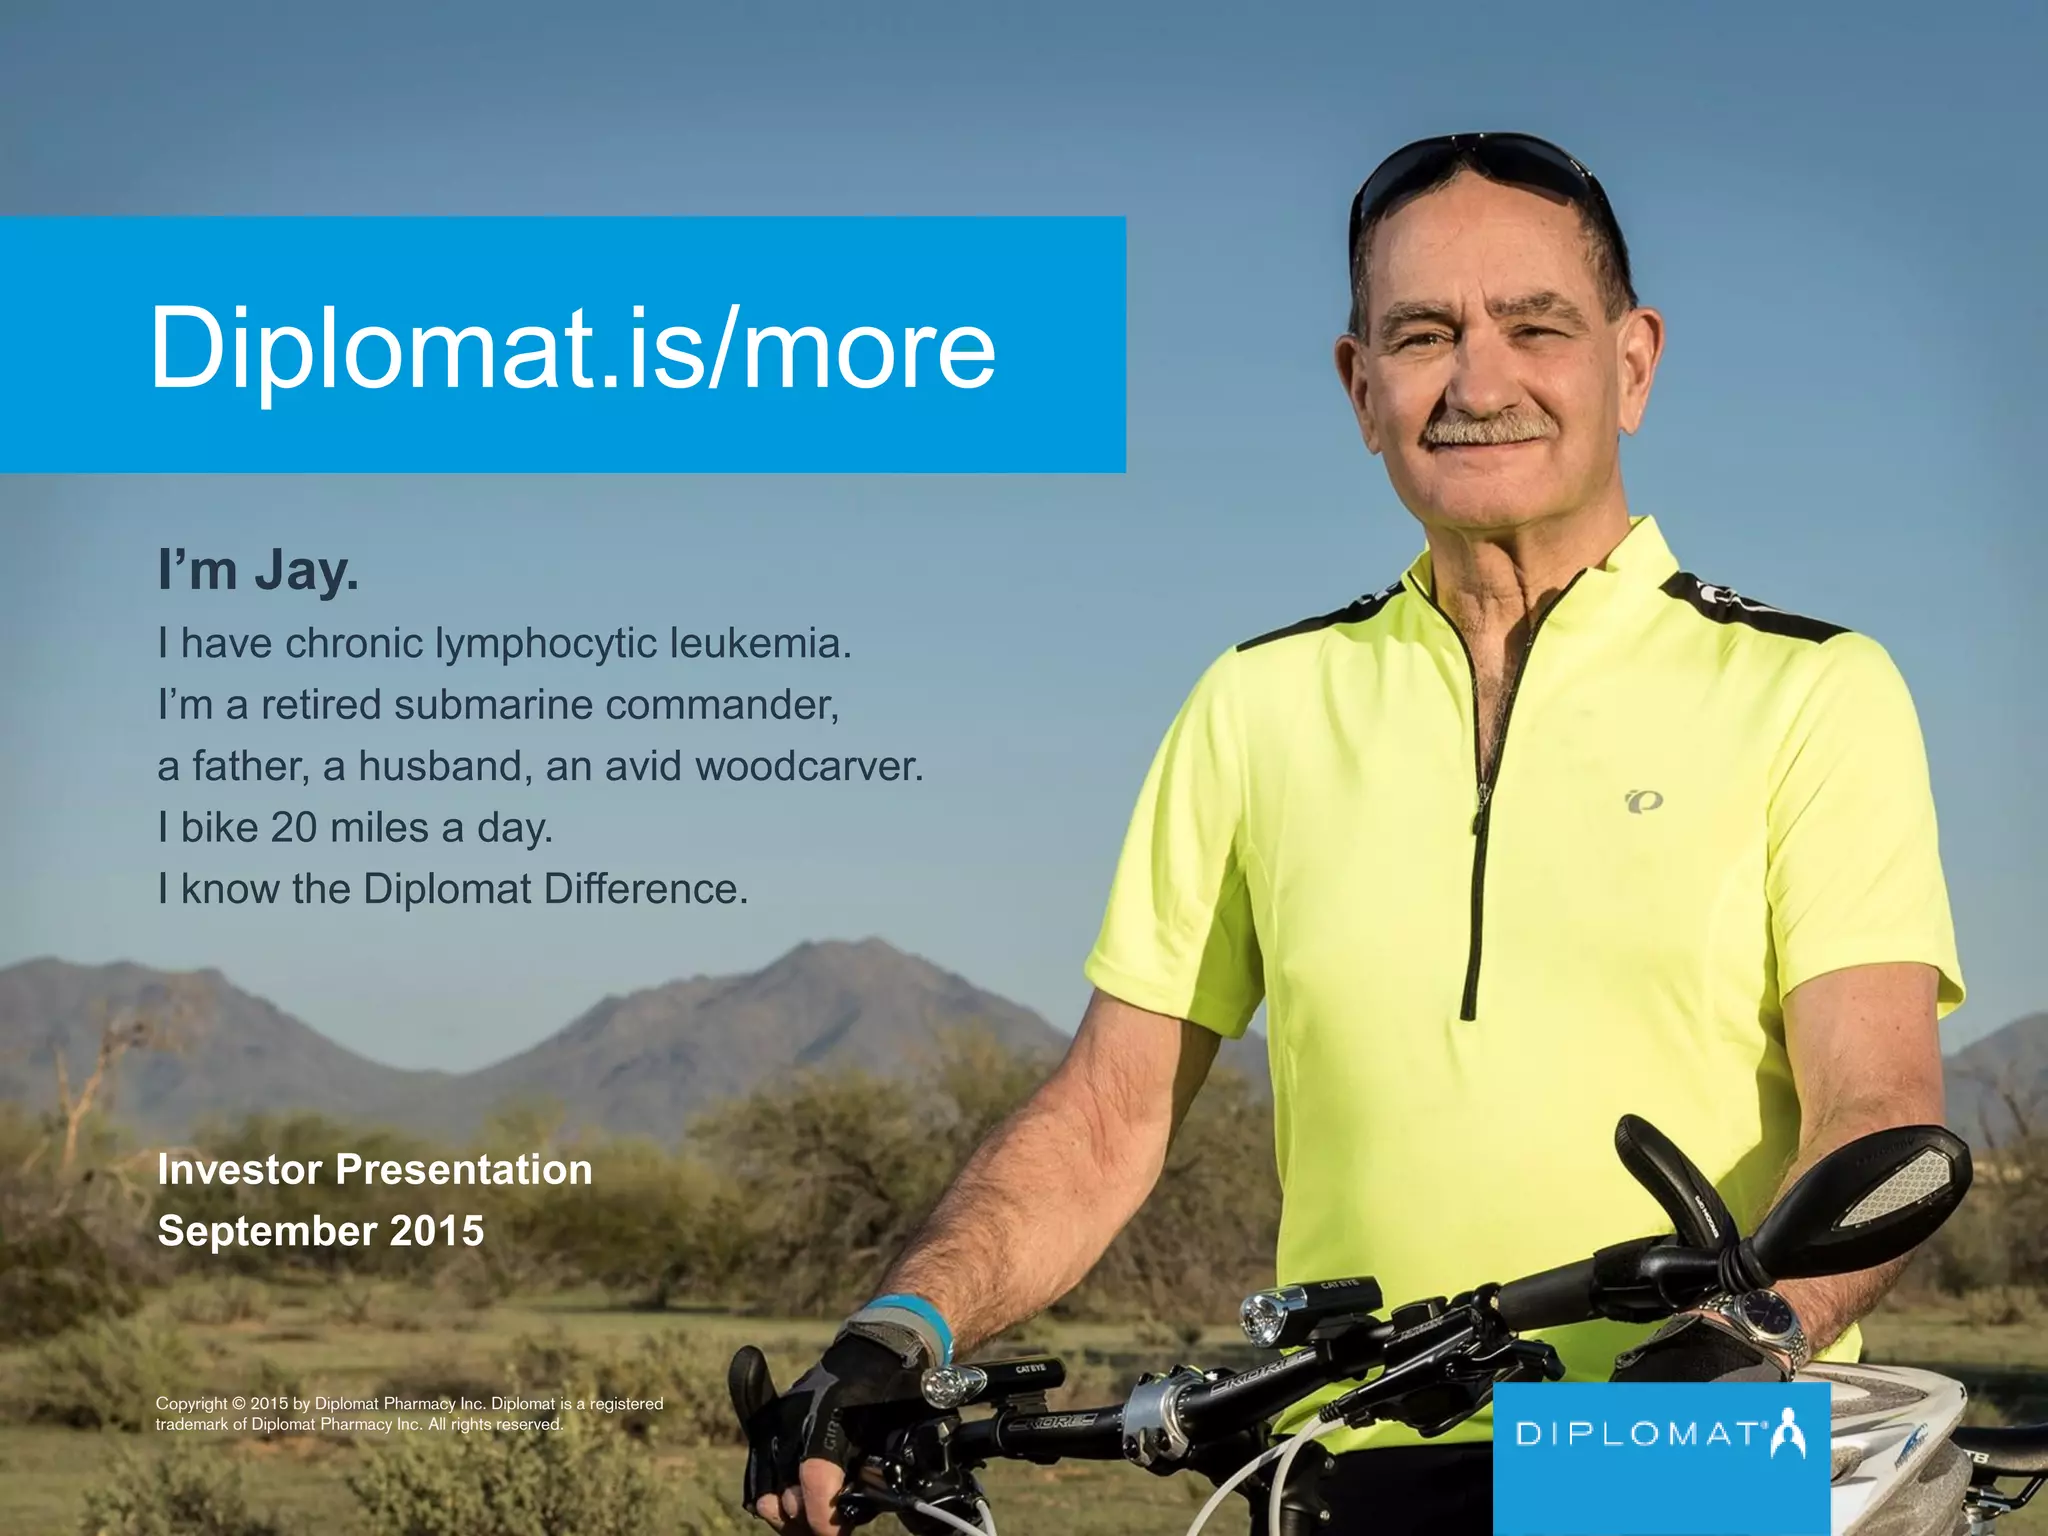
The Diplomat investor deck from September 2015 opens not with a spreadsheet, but with a patient. Slide 1 features 'Jay,' a retired submarine commander with chronic lymphocytic leukemia. This sets a narrative tone that balances the cold reality of a multi-billion dollar pharmacy business with the individual outcomes that drive its revenue. By the time the reader reaches the financial data, the 'why' of the business has been firmly established.
Slide 1: Title and Patient Narrative
The cover slide introduces the 'Diplomat Difference' through a testimonial. It establishes the company's focus on chronic, complex conditions. The branding is clean, and the inclusion of a specific URL (Diplomat.is/more) suggests an integrated marketing approach for the investor presentation. The copyright notice confirms the entity as Diplomat Pharmacy Inc.
Slide 3: Momentum and Market Trends
This slide bridges the gap between macro market trends and Diplomat's specific performance. On the left, it notes the specialty pharmacy market grew 24% to $78 billion in 2014. It also highlights that specialty drugs comprised over 50% of FDA approvals that year. On the right, Diplomat maps its own growth to these trends, reporting a 49% revenue increase from 2Q'14 to 2Q'15. The slide lists specific high-profile drug contracts in Oncology (Farydak, Iressa, Ibrance), Hepatitis C (Viekira Pak, Harvoni), and Cystic Fibrosis (Orkambi, Kitabis Pak), reinforcing their access to the most critical new therapies.
Slide 6: Market Position and Historical Growth
Slide 6 is the 'traction' slide. It defines Diplomat as the 'Largest independent specialty pharmacy.' Key facts include its 1975 founding in Flint, MI, and a 2014 employee count of approximately 1,550. The revenue chart is the centerpiece, showing a 63% CAGR from 2005 ($27 million) to 2014 ($2.215 billion), with a 2015 estimate of $3.3 billion. The market share pie chart is equally important, showing that while Diplomat only holds 3% of the $78 billion market, it is the largest player not tied to a major PBM or retail conglomerate like CVS (33%) or Express Scripts (25%). A national footprint map shows pharmacy locations across 12 states, including California, Florida, and Pennsylvania.
Slide 9: The Limited Distribution Moat
This slide explains the core business logic. Diplomat defines 'Limited Distribution' as a strategy where manufacturers provide only one or a few pharmacies with dispensing rights. This eliminates wholesalers and gives Diplomat real-time clinical data and deeper partnerships with biotech firms. The slide notes that Diplomat had a portfolio of over 80 limited distribution drugs, accounting for 40% of their 2014 revenue. They explicitly position themselves as an investment in the 'pharma / biotech drug pipeline, without the binary risk' of clinical trial failure.
Slide 12: High Margin Business Expansion
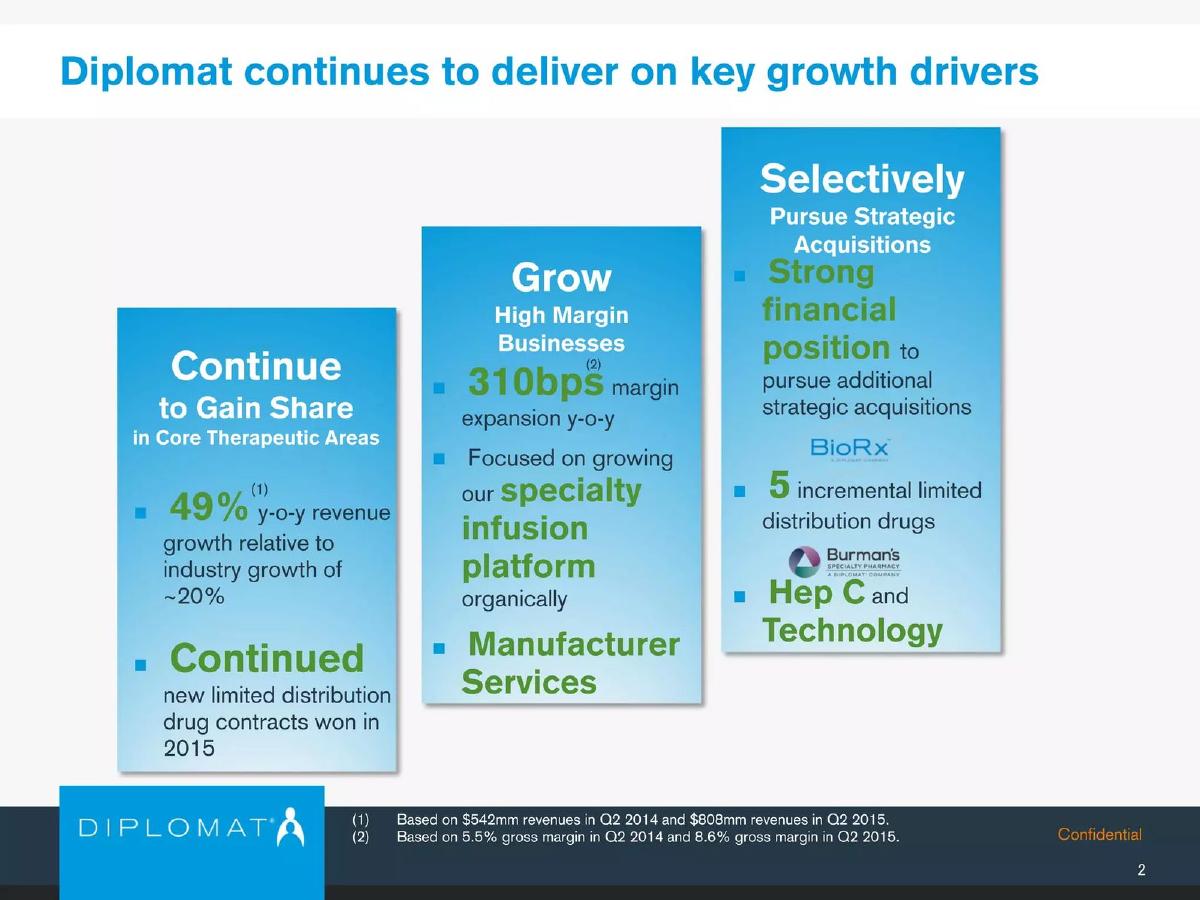
Growth isn't just about volume; it's about margin. Slide 12 details the strategy to grow high-margin segments. It highlights the acquisition of BioRx, which brought in a 29% gross margin and 10% EBITDA margin—significantly higher than the company's consolidated averages. It also points to opportunities in specialty generics and biosimilars (like Copaxone and Neupogen) as a long-term addressable market expansion. The slide uses logos of high-value drugs like Sovaldi and Harvoni to illustrate where rebate and service fee opportunities exist.
Slide 15: M&A Strategy
Diplomat outlines its criteria for future acquisitions. The focus is on targets that provide 'access to Limited Distribution drugs' and 'new therapeutic areas.' The most telling bullet point is the final one: 'Makes DPLO better, not just bigger.' This suggests a disciplined approach to capital allocation, focusing on margin-accretive deals rather than just top-line growth.
Slide 18: Financial Performance and Operating Leverage
This slide provides the hard numbers on profitability. Total revenue shows consistent year-over-year growth, but the Adjusted EBITDA chart is the highlight. It shows a dip in 2012 due to 'infrastructure investments including IT, facilities and personnel,' followed by a sharp recovery. Adjusted EBITDA grew from $19 million in 2013 to $35 million in 2014. The comparison of the first six months of 2014 ($14 million) to 2015 ($34 million) shows a 141% growth rate, with EBITDA margins expanding from 1.4% to 2.4%.
Slide 21: Investment Highlights Summary
This is the 'wrap-up' slide. It distills the pitch into five pillars: market share gains, a unique business model, an experienced management team, an outstanding financial profile, and multiple growth avenues. It serves as a checklist for investors to remember the key arguments made throughout the deck.
Slide 24: Financial Reconciliation
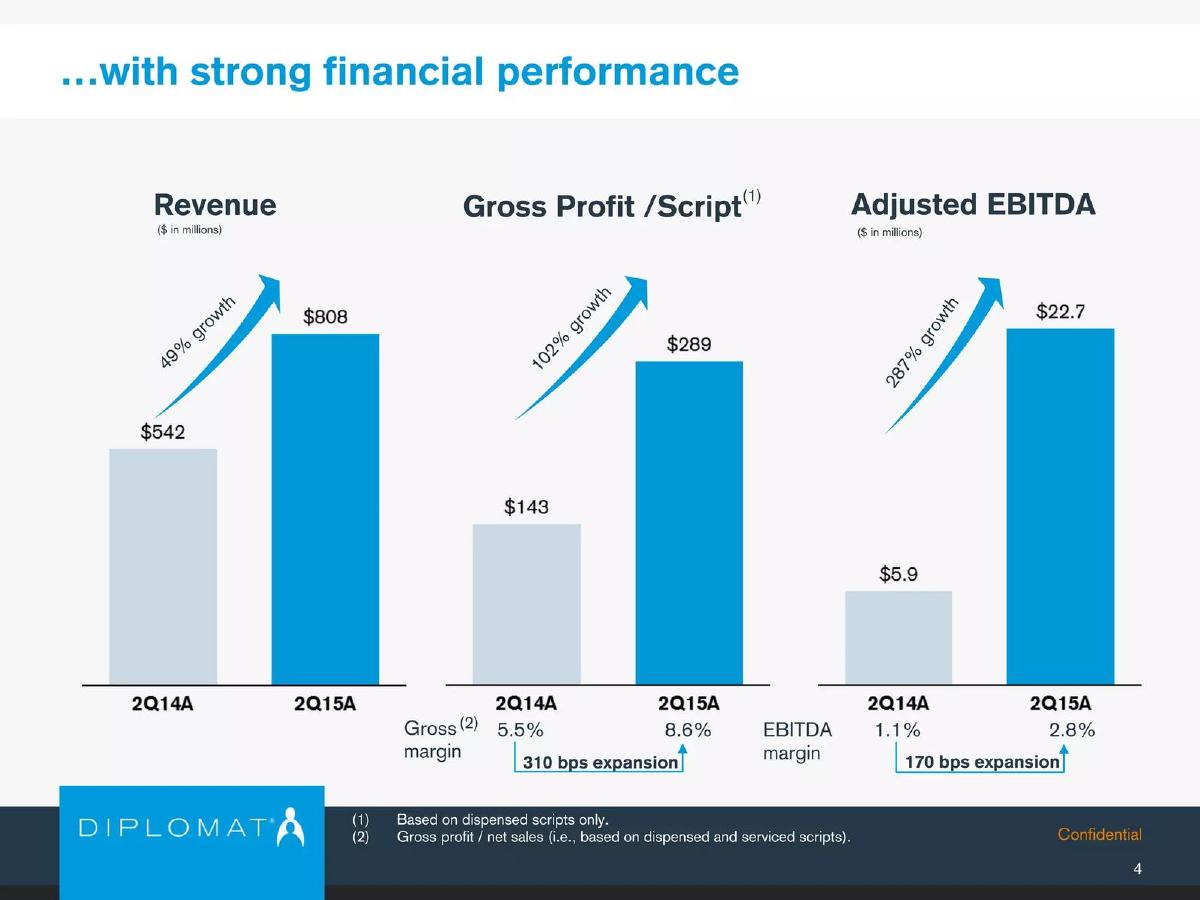
In a display of corporate maturity, Slide 24 provides a detailed reconciliation of Net Income to Adjusted EBITDA. It accounts for depreciation, interest, taxes, share-based compensation, and M&A expenses. For 2Q'15, it shows how a $3.4 million net income translates to a $22.7 million Adjusted EBITDA. This level of detail is standard for public or late-stage private companies and builds significant trust with institutional investors.
What Diplomat Does Well
The deck excels at explaining a complex B2B2C healthcare model in simple terms. By focusing on 'Limited Distribution,' Diplomat gives investors a clear 'moat' to believe in. The use of a 10-year revenue chart (Slide 6) provides a sense of inevitability to their growth, while the EBITDA reconciliation (Slide 24) proves they are not hiding costs. The transition from a patient story to a multi-billion dollar financial summary creates a complete narrative arc.
What Is Missing
While the deck is comprehensive, it lacks a detailed 'Team' slide in this 9-slide selection (though the full 26-slide deck likely included one). There is also very little mention of the specific technology platform mentioned as an 'infrastructure investment' on Slide 18. Investors would likely want to know if their IT stack is a proprietary advantage or a standard industry tool. Additionally, while they mention 'competition,' there is no detailed 'Competitive Matrix' showing how their service levels or data reporting actually beat CVS or Walgreens in the eyes of a biotech manufacturer.
Founder Takeaways
Define your moat early: Diplomat doesn't just say they are a pharmacy; they explain the 'Limited Distribution' model as their primary barrier to entry. Founders should identify the one structural advantage they have and hammer it home.
Show operating leverage: The EBITDA margin expansion from 1.3% to 2.4% (Slide 18) is a powerful signal. It tells investors that as the company gets bigger, it gets more efficient. Even small margin improvements are worth highlighting if they show a trend.
Use M&A as a narrative tool: Instead of just saying they will buy companies, Diplomat explains why (Slide 15) and shows a successful example (BioRx on Slide 12). If your growth strategy involves acquisitions, show the 'before and after' of a past deal to prove you can integrate and extract value.
Balance the 'Why' and the 'How': Start with the mission (the patient) but back it up with rigorous financial reconciliation. A deck that is all heart lacks credibility; a deck that is all spreadsheets lacks inspiration. Diplomat strikes a professional balance between the two.
Frequently asked questions
- What is Diplomat's primary competitive advantage according to the deck?
- Diplomat identifies its 'Limited Distribution' model as a central theme. Unlike traditional pharmacies that rely on multiple wholesalers, Diplomat partners directly with manufacturers for exclusive or preferred dispensing rights. This creates a barrier to entry and allows them to capture 40% of their revenue from drugs that most pharmacies cannot access, as noted on Slide 9.
- How does Diplomat justify its growth potential in a crowded market?
- The deck points to a 24% growth in the specialty pharmacy market (from $63bn to $78bn) and the fact that 50% of all FDA drug approvals in 2014 were specialty drugs. Slide 3 highlights that with 3,000+ oncology and immunology drugs in development, Diplomat is positioned to capture this pipeline without the 'binary risk' of drug development.
- What are the key financial metrics for Diplomat's performance?
- Diplomat emphasizes revenue growth and EBITDA margin expansion. Slide 18 shows revenue increasing from $578 million in 2010 to $2.215 billion in 2014. More importantly, Adjusted EBITDA margins improved from 1.3% in 2010 to 2.4% in the first half of 2015, demonstrating operating leverage as the business scales.
- What is Diplomat's strategy regarding acquisitions?
- As outlined on Slide 15, Diplomat seeks M&A targets that accelerate high-margin opportunities, expand therapeutic areas, or provide access to new limited distribution drugs. The acquisition of BioRx is cited on Slide 12 as a prime example, specifically because it offers a 29% gross margin, which is significantly higher than their base business.
- Who are Diplomat's main competitors?
- Slide 6 provides a market share breakdown. Diplomat (3%) competes against CVS Health/Omnicare (33%), Express Scripts (25%), Walgreens (10%), and OptumRx/Catamaran (8%). Diplomat differentiates itself by being the largest 'independent' player, meaning it is not owned by a PBM (Pharmacy Benefit Manager) or a massive retail chain.