Daseke’s August 2017 investor presentation serves as a masterclass in pitching a consolidation or 'roll-up' strategy. The company highlights its position as the largest owner of flatbed and specialized equipment in North America while emphasizing that it still holds less than 1% of a $133 billion market. The deck leans heavily on financial performance, showcasing a 50% Adjusted EBITDA CAGR from 2009 to 2016 and a clear path to $140 million in pro forma Adjusted EBITDA for 2017. By providing detailed end-market diversification and a transparent earnout structure for management, Daseke builds a…
Key takeaways
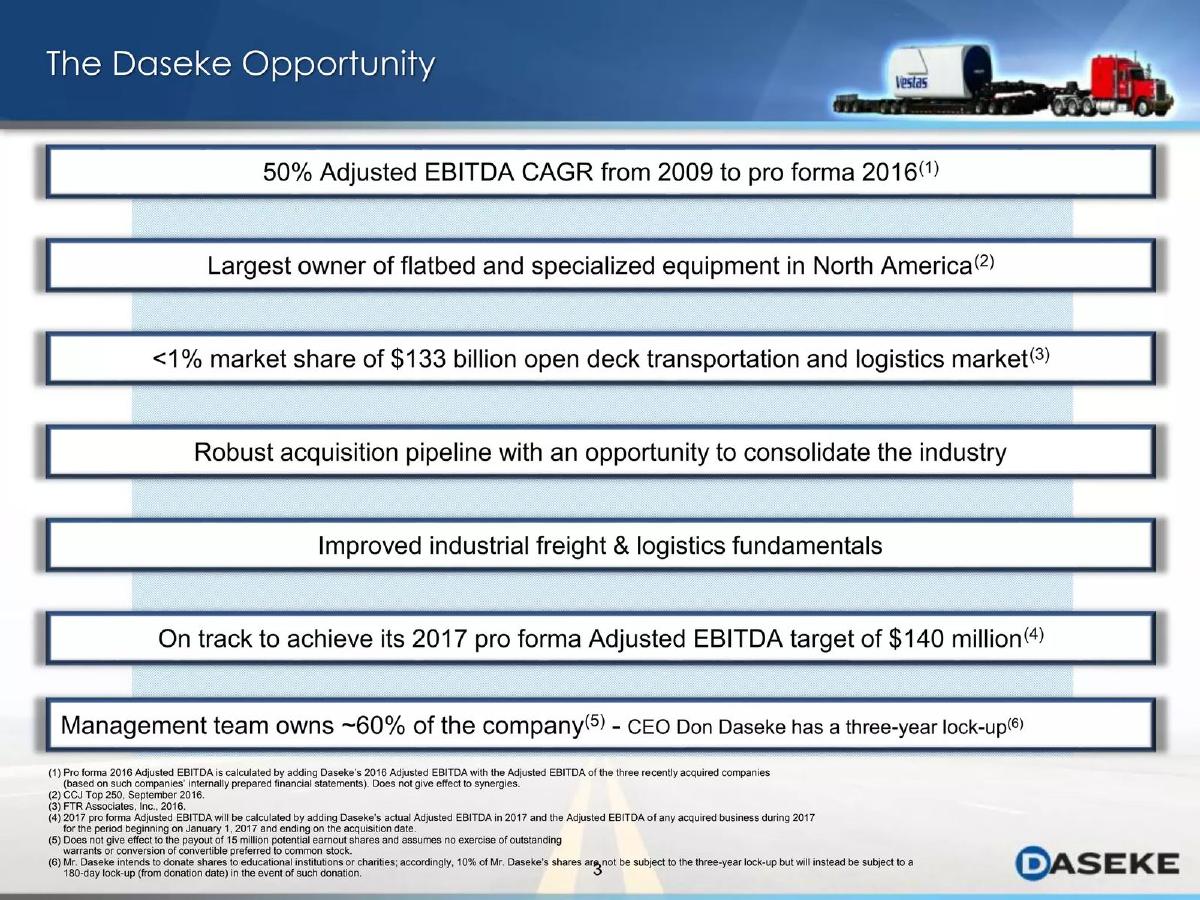
- Daseke claims to be the largest owner of flatbed and specialized equipment in North America as of September 2016 (Slide 3).
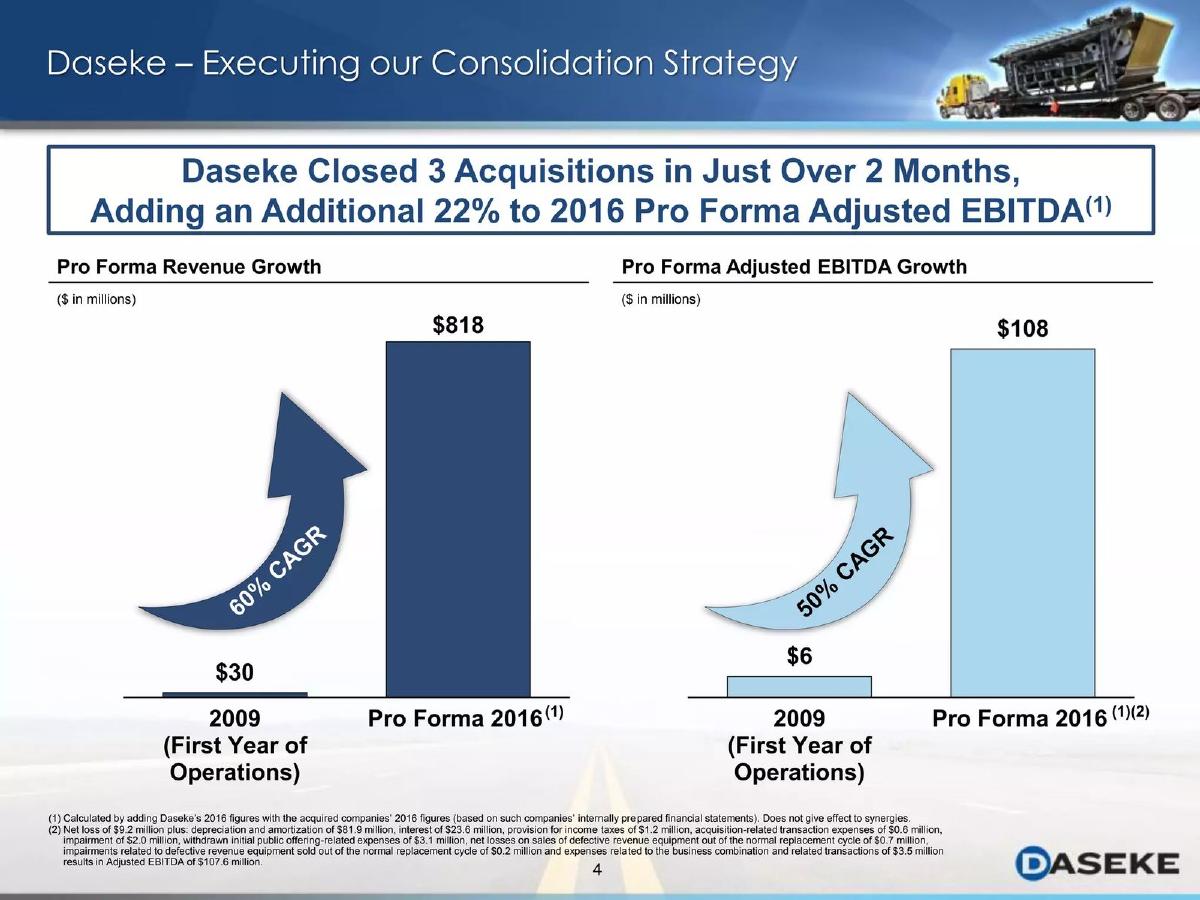
- The company achieved a 50% Adjusted EBITDA CAGR between 2009 and pro forma 2016 (Slide 3).
- Despite its size, Daseke holds less than 1% market share of the $133 billion open deck transportation market (Slide 3).
- Revenue is well-diversified across sectors, with Metals (22%), Building Materials (20%), and Heavy Equipment & Energy (18%) as the top three segments (Slide 9).
- Pro forma revenue grew from $652 million in 2016 to a projected $979 million in 2017, largely driven by acquisitions (Slide 15).
- Management and pre-public merger stockholders own approximately 60% of the company, with the CEO under a three-year lock-up (Slide 3).
- The company utilizes a unique earnout structure with stock awards tied to reaching $200 million in Adjusted EBITDA and a $16.00 share price by 2019 (Slide 18).
- Market dynamics are supported by a recovery in truckload rates, which were projected to rise through mid-2018 (Slide 21).
Executive Summary: The Consolidation Play
Daseke’s August 2017 investor presentation is a clinical look at a high-growth industrial roll-up. At the time of this deck, Daseke was positioning itself as the premier consolidator in the highly fragmented North American flatbed and specialized logistics market. The deck focuses heavily on the scale of the opportunity, the historical success of their M&A strategy, and the alignment of management incentives with shareholder value. It is less about the 'tech' of logistics and more about the 'economics' of scale in a $133 billion market.
Slide 1: Title and Positioning
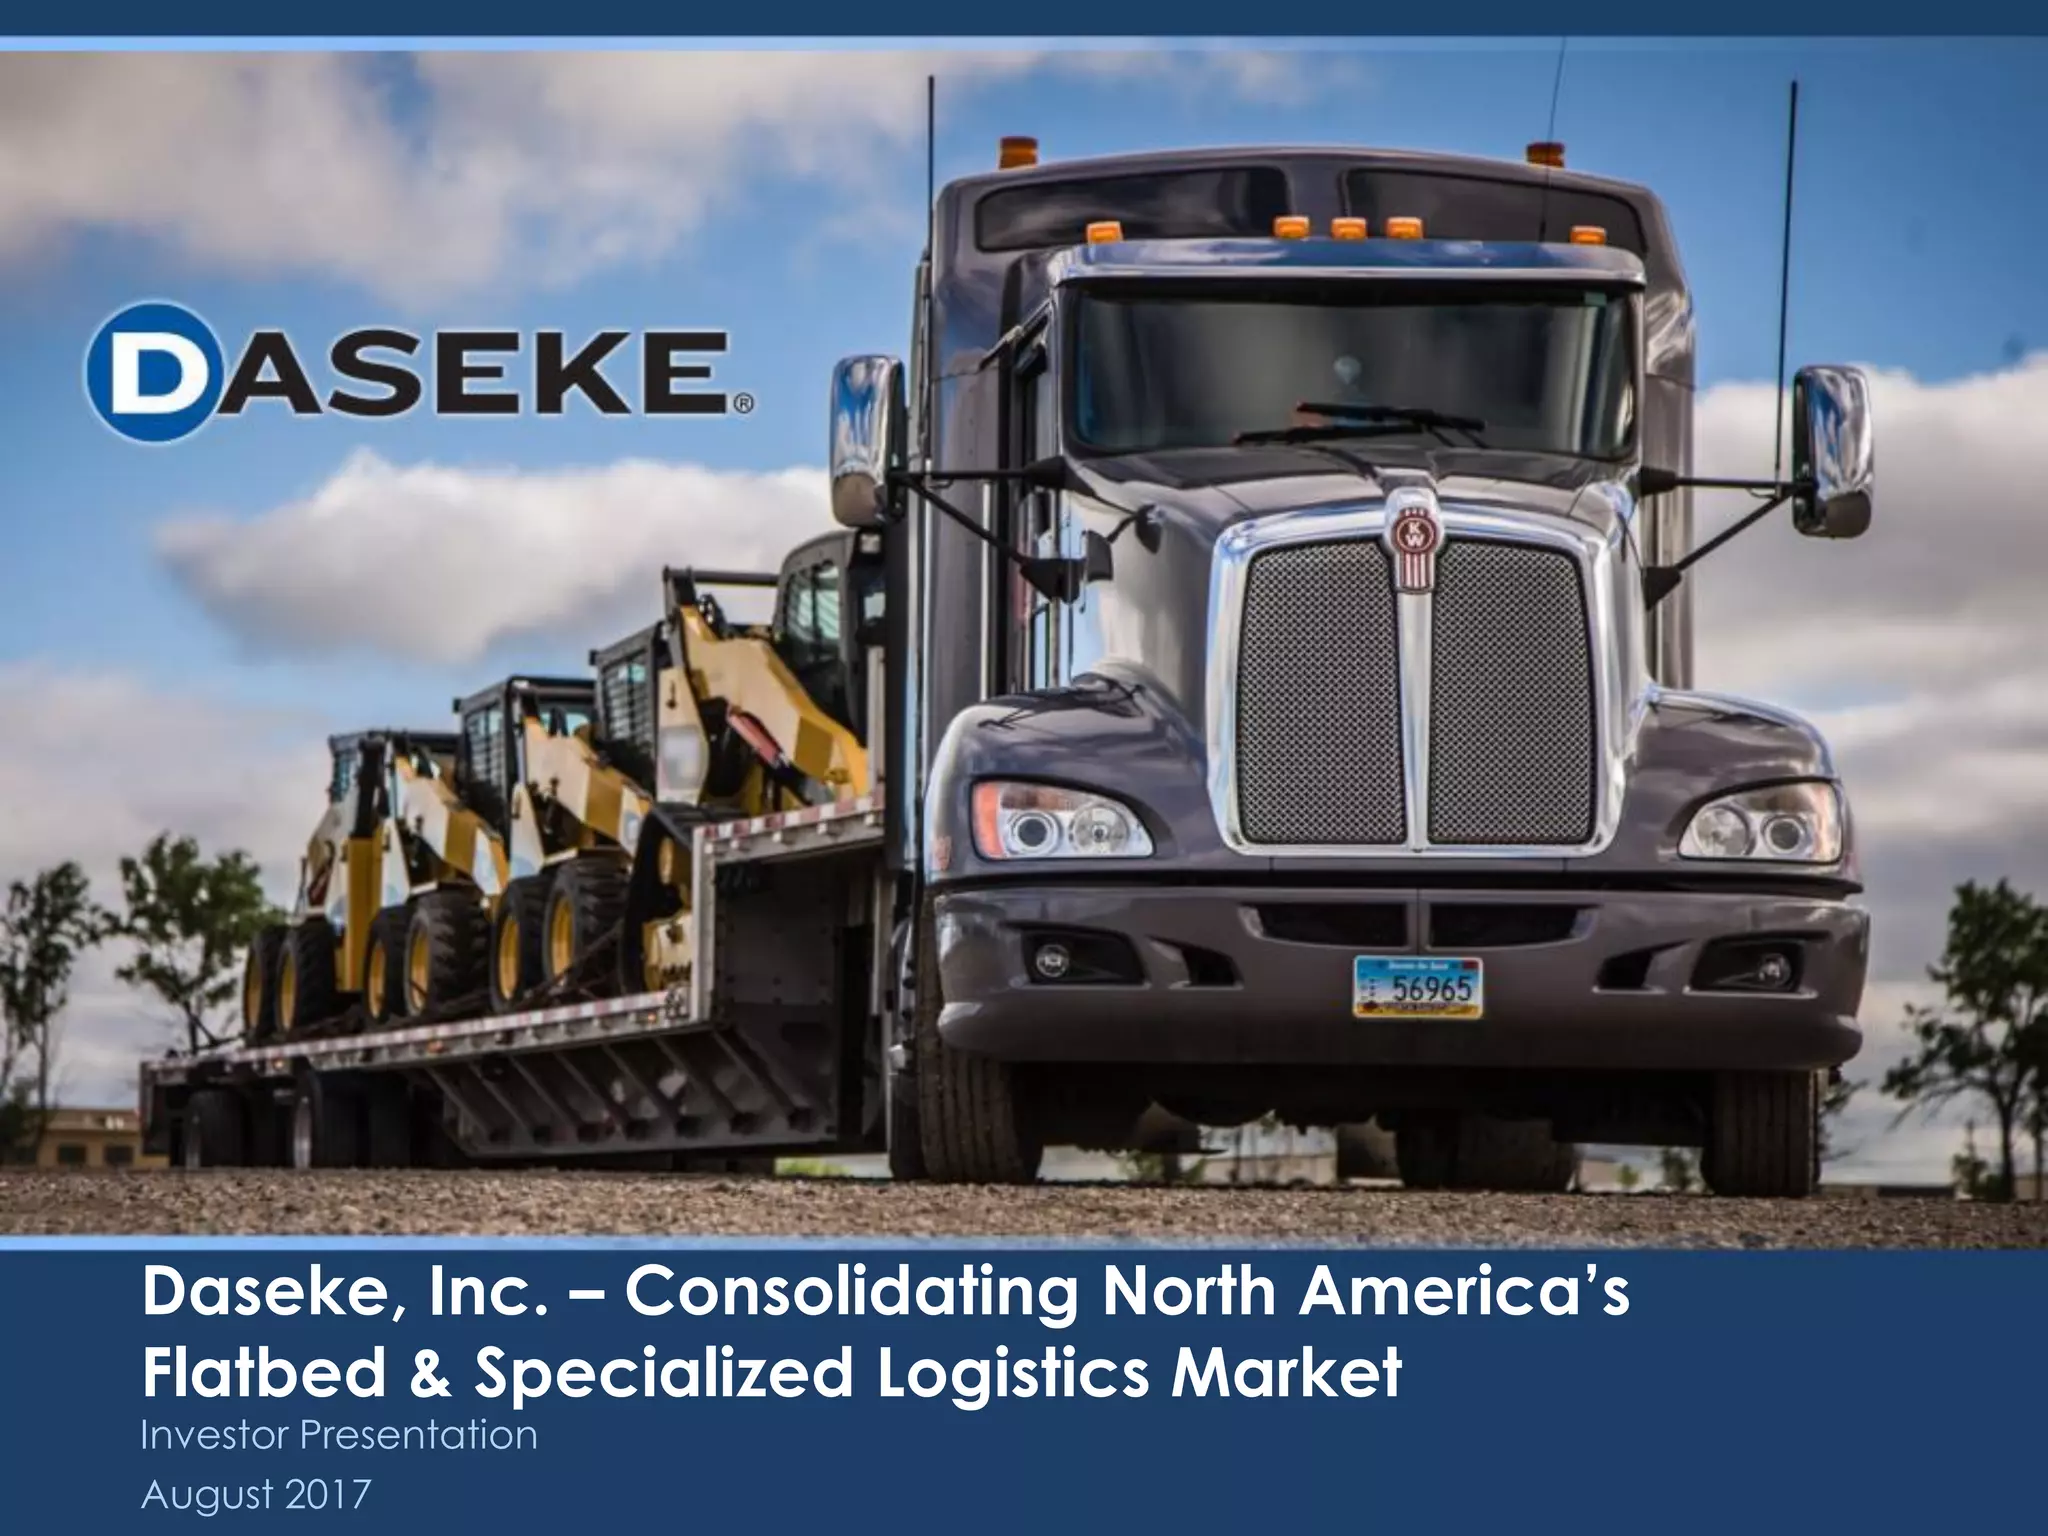
The cover slide establishes the company's core value proposition immediately: "Consolidating North America’s Flatbed & Specialized Logistics Market." The imagery of a Kenworth truck hauling heavy machinery reinforces the "specialized" nature of their fleet, distinguishing them from standard dry van carriers. The date, August 2017, places this deck shortly after their public debut via a SPAC merger earlier that year.
Slide 3: The Daseke Opportunity
This is the 'Executive Summary' slide, and it is dense with high-impact metrics. Daseke leads with a 50% Adjusted EBITDA CAGR from 2009 to pro forma 2016 . This is a critical metric for a roll-up, as it proves the company can not only buy businesses but also integrate them profitably. The slide also notes they are the "Largest owner of flatbed and specialized equipment in North America," yet they hold less than 1% market share of a $133 billion market. This juxtaposition is intentional; it tells investors that Daseke is the leader in a market that is still almost entirely up for grabs. Finally, the mention of a 60% management ownership stake and a three-year lock-up for CEO Don Daseke addresses potential concerns about 'pump and dump' schemes common in new public listings.
Slide 6: Improving Industry Environment
Logistics is a cyclical business, and Slide 6 uses a complex line chart from Morgan Stanley Research to argue that the cycle is turning in Daseke's favor. The chart tracks "Incremental Demand / Incremental Supply." The 2017 red line shows a sharp upward trend compared to the 2016 blue line, suggesting that demand is beginning to outstrip supply. This macro-economic tailwind is used to justify the aggressive acquisition targets mentioned elsewhere in the deck.
Slide 9: Well-Diversified End-Markets
For an industrial company, concentration risk is a major red flag. Daseke uses Slide 9 to debunk this concern. Their revenue mix is spread across eight distinct categories. Metals (22%) , Building Materials (20%) , and Heavy Equipment & Energy (18%) are the largest, but no single segment dominates. This diversification suggests that Daseke can weather a slowdown in housing (Building Materials) if the energy sector is booming, or vice versa. It portrays the company as a broad proxy for North American industrial health rather than a niche player.
Slide 12: North American Network Map
This slide provides a visual representation of the company's physical footprint. The heat map shows intense activity in the U.S. South and Midwest, which are hubs for manufacturing and energy production. The coverage extends significantly into Canada (Ontario, Quebec, British Columbia) and parts of Mexico. For a logistics company, density equals efficiency. This map proves Daseke has the infrastructure to handle cross-border contracts for large multinational clients.
Slide 15: Key Metrics & Financials
This is perhaps the most important slide for a financial analyst. It breaks down Revenue and Adjusted EBITDA into "Standalone" and "Acquired Post Q1 2017" buckets. Revenue was projected to grow from $652 million in 2016 to $979 million in 2017 . Crucially, the standalone business was expected to grow from $652 million to $723 million, proving that there is organic growth happening alongside the acquisitions. The Adjusted EBITDA chart shows a similar trend, moving from $88 million to a projected $140 million. This slide validates the "roll-up" thesis with hard numbers.
Slide 18: Earnout Details
Transparency regarding management compensation is rare in many decks, but Daseke includes it here to show alignment. The earnout structure is tied to both Adjusted EBITDA targets and Stock Price targets . To unlock the full 15 million shares, the company needed to hit $200 million in EBITDA and a $16.00 stock price by 2019. This tells investors that management only wins if the company grows significantly and the market rewards that growth with a higher valuation.
Slide 21: Truckload Rates Trend
The final slide in this selection focuses on pricing power. It shows a year-over-year percentage change in truckload rates (net of fuel surcharges). After a dip in 2016, the rates show a clear recovery in 2017, with projections (dotted lines) showing continued growth into 2018. This slide serves as a closing argument for why now is the right time to invest: the company is growing, the market is fragmented, and the pricing environment is improving.
What Daseke Does Well
Daseke excels at framing the market opportunity . By citing a $133 billion total addressable market (TAM) and showing they have less than 1% of it, they make their aggressive acquisition strategy seem conservative rather than risky. They also do an excellent job of separating organic growth from acquisition growth on Slide 15, which is a common point of skepticism for investors looking at roll-ups. The inclusion of the management earnout structure (Slide 18) is a sophisticated move that builds trust by showing exactly what the leadership is incentivized to do.
What is Missing from the Deck
While the deck is strong on financials and macro trends, it is light on operational specifics . There is no mention of the technology stack used to integrate these disparate trucking companies. In a modern logistics context, how a company manages data, dispatch, and fuel efficiency across thousands of trucks is a key competitive advantage. Additionally, the deck omits a detailed competitor analysis . While it mentions they are the "largest," it doesn't name the second or third largest players or explain why Daseke is a better acquirer than a private equity firm. Finally, there is no mention of the 'Ask' —though as an investor presentation for a public company, the 'ask' is implied as buying the stock, a specific capital raise amount is not listed in these slides.
What You Should Copy
If you are building a company in a fragmented industry, copy the 'Consolidation Runway' slide (Slide 3) . Showing that you are the leader while still having a tiny percentage of the total market is a powerful way to demonstrate growth potential. You should also copy the revenue diversification pie chart (Slide 9) . Investors love to see that you aren't reliant on a single customer or sector. Finally, if you are a founder with a significant stake, be transparent about your lock-up and incentives as Daseke did. It signals long-term commitment and reduces the fear of founder exit post-funding.
Frequently asked questions
- What is Daseke's primary growth strategy according to the deck?
- Daseke's primary strategy is industry consolidation. Slide 3 explicitly mentions a 'robust acquisition pipeline with an opportunity to consolidate the industry.' The financial data on Slide 15 supports this, showing that a significant portion of their 2017 revenue growth ($256 million of the $979 million total) was projected to come from companies acquired post-Q1 2017.
- How does Daseke mitigate the risks of a cyclical logistics market?
- The company uses end-market diversification to mitigate cyclicality. Slide 9 shows that no single industry accounts for more than 22% of their revenue. By serving Metals, Building Materials, Energy, Lumber, and Aircraft Parts, they ensure that a downturn in one specific sector (like Energy) does not cripple the entire business.
- What are the specific financial targets for the management earnout?
- As detailed on Slide 18, the earnout is tiered over three years. For 2017, the target was $140 million EBITDA and a $12.00 stock price. For 2018, it rose to $170 million and $14.00. The final 2019 target was $200 million in Adjusted EBITDA and a $16.00 stock price, with up to 15 million shares total available for award.
- What does the 'Open Deck' market size represent for Daseke?
- The 'Open Deck' market refers to flatbed and specialized transportation. Slide 3 identifies this as a $133 billion market. By stating they have less than 1% market share despite being the largest player, Daseke is signaling to investors that there is an enormous 'runway' for growth through further acquisitions without hitting antitrust or saturation limits.
- How does the deck illustrate Daseke's geographic reach?
- Slide 12 provides a heat map of Daseke's North American network. It shows heavy concentration (red zones) in the Southeastern United States, Texas, and the Midwest/Great Lakes region, with significant coverage extending into Canada and the Pacific Northwest, demonstrating a truly continental logistics footprint.