The Yelp Q2 2015 investor deck, as presented in this 10-slide version, is a data-heavy update designed to reassure shareholders of the company's scaling capabilities four years after its IPO. Rather than focusing on a 'vision' for a new product, the deck leans into hard execution metrics, comparing its 2015 performance to its 2012 IPO baseline. Key highlights include a massive jump in quarterly revenue from $24.9 million to $153.7 million and a strategic pivot toward mobile, where users view 10 times more pages than on the web. The deck effectively positions Yelp as the digital successor to t…
Key takeaways
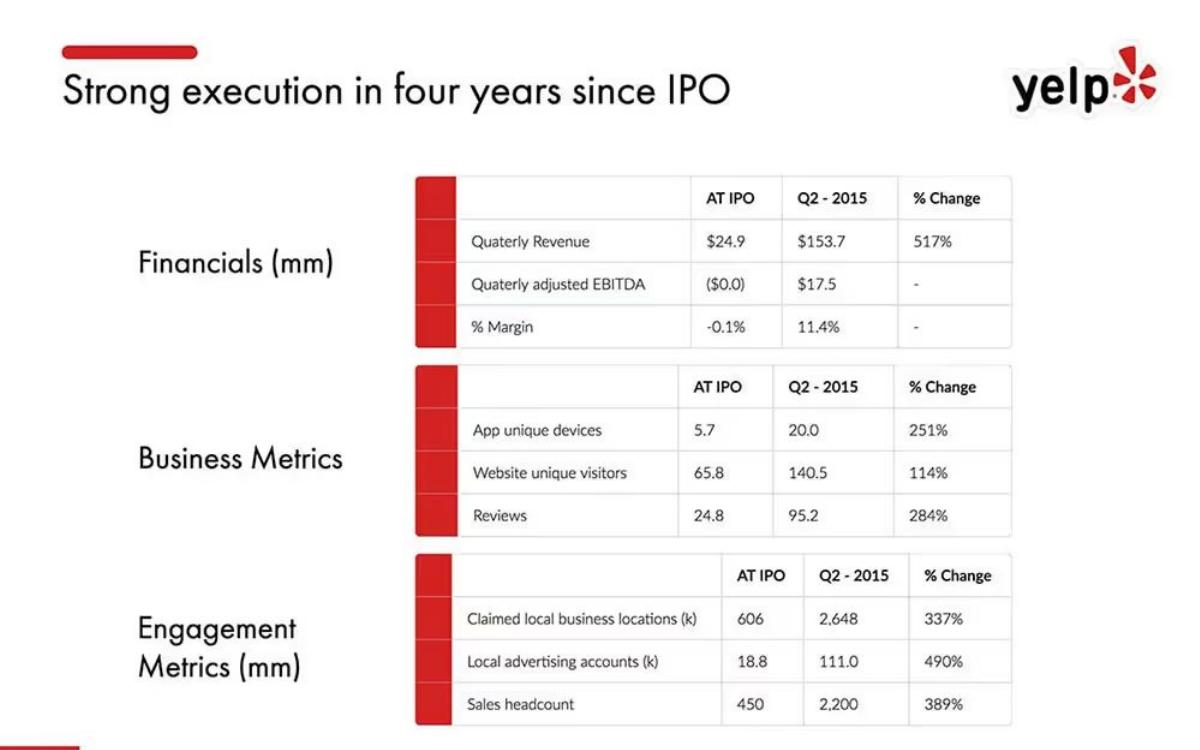
- Quarterly revenue grew 517% from $24.9 million at IPO to $153.7 million by Q2 2015 (Slide 3).
- Yelp transitioned from a negative 0.1% margin at IPO to an 11.4% margin in Q2 2015 (Slide 3).
- The sales headcount increased by 389%, growing from 450 at IPO to 2,200 by mid-2015 (Slide 3).
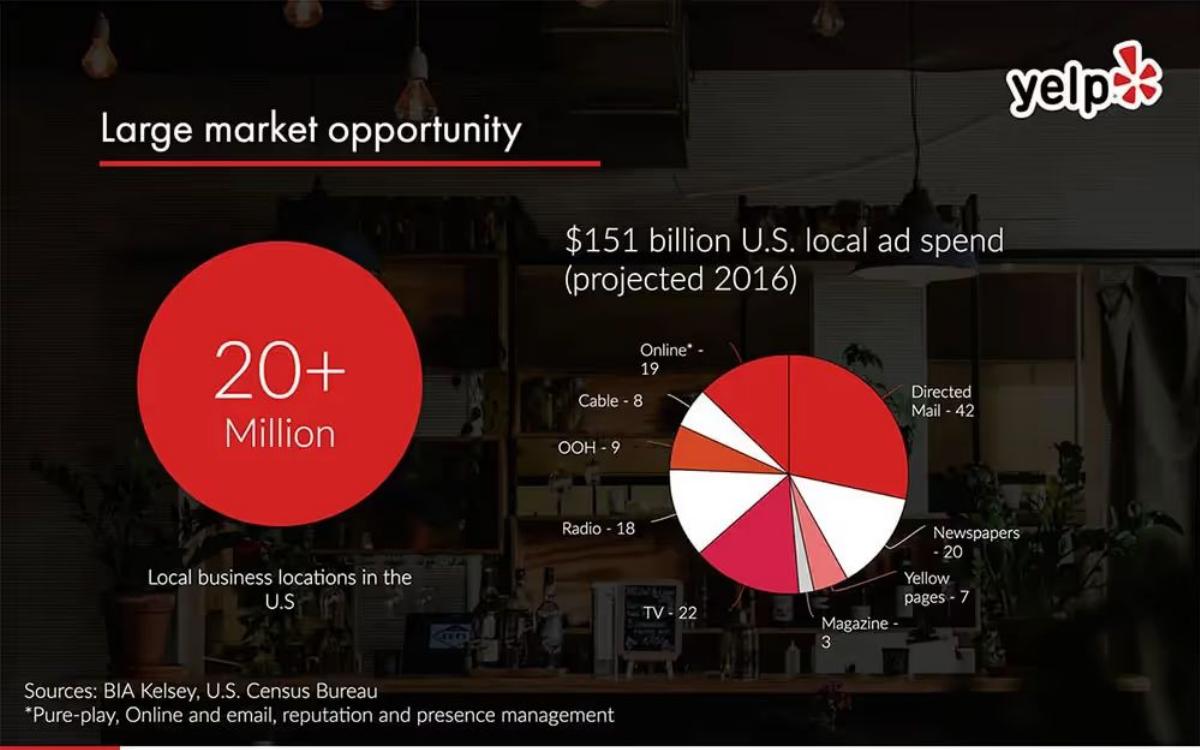
- The U.S. local advertising market was projected at $151 billion for 2016, with Yelp targeting the shift from offline to online (Slide 4).
- App unique devices grew from 5.7 million at IPO to 20.0 million in Q2 2015 (Slide 3).
- App users are significantly more engaged than web users, viewing more than 10X as many pages (Slide 8).
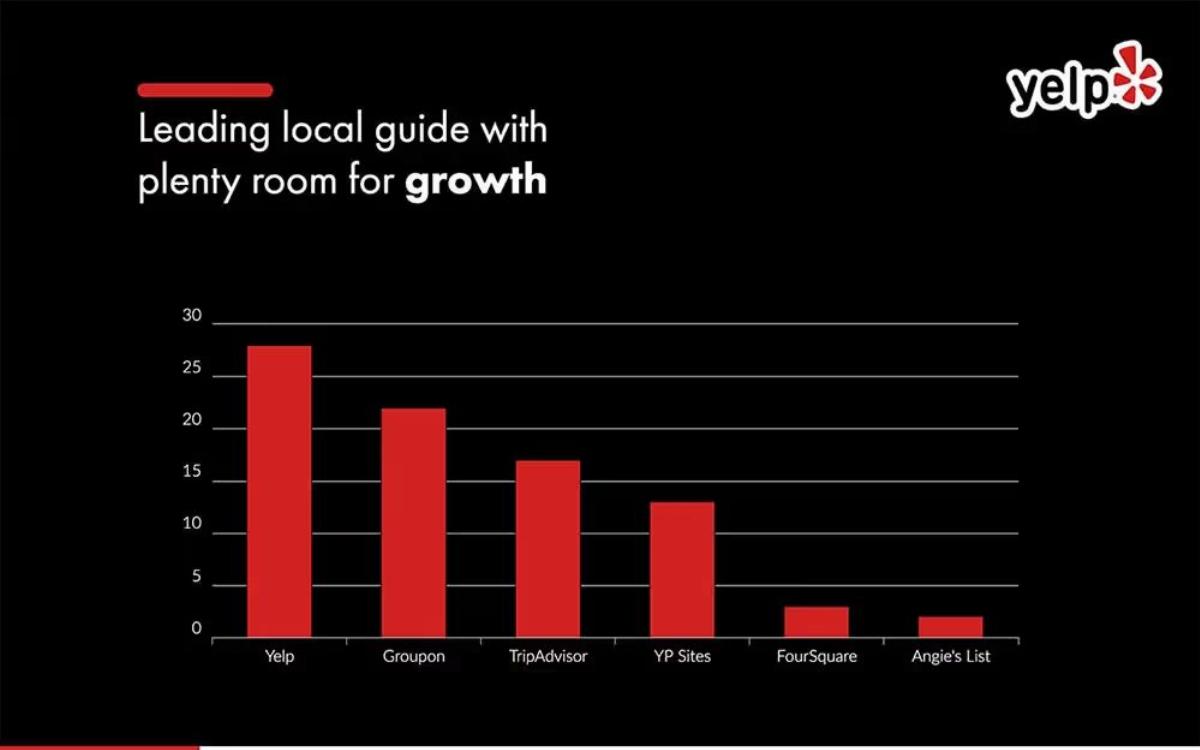
- Yelp claims a leading position in the local guide market, outperforming Groupon and TripAdvisor in specific reach metrics (Slide 6).
- The deck provides a specific ROI case study showing $983 in estimated monthly revenue from a $267 ad spend (Slide 10).
Executive Summary: The Post-IPO Victory Lap
The Yelp Q2 2015 investor deck is a study in growth at scale. Reported by the publisher to be from 2015, this deck does not follow the traditional 'problem-solution' format of a seed-stage startup. Instead, it operates as a performance report for a public company. The narrative is simple: we are the leaders in local, our move to mobile is working, and our advertisers see a massive return on investment. With a quarterly revenue jump of over 500% since its IPO, Yelp uses this deck to prove that it has successfully transitioned from a web-based directory to a mobile-first advertising powerhouse.
Slide 1: Title Slide
The deck opens with a high-resolution image of a dimly lit bar, immediately grounding the company in its core sector: local hospitality and nightlife. The text is minimal, stating 'Yelp Investor Pitch Deck Q2-2015.' It establishes a professional, corporate tone while maintaining the brand's connection to local business environments.
Slide 2: The Mission Statement
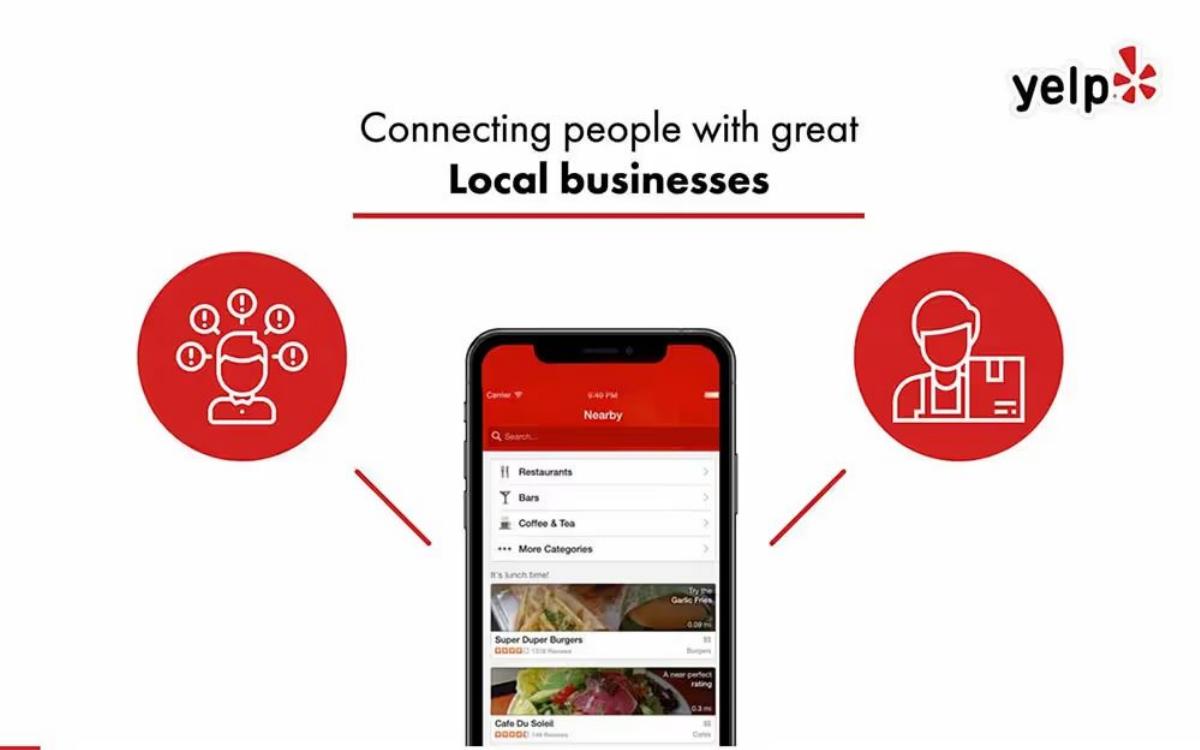
Slide 2 provides a high-level overview of the platform's purpose: 'Connecting people with great Local businesses.' The slide uses a simple three-part graphic. On the left, an icon represents the consumer (the 'people'); on the right, an icon represents the business owner; and in the center, a smartphone displays the Yelp app interface. This reinforces the 'marketplace' nature of the business, where Yelp acts as the essential bridge between demand and supply.
Slide 3: Strong Execution in Four Years Since IPO
This is arguably the most important slide in the deck. It uses three tables to compare metrics 'AT IPO' (2012) to 'Q2 - 2015.' The data is categorized into Financials, Business Metrics, and Engagement Metrics. The figures are impressive: Quarterly Revenue rose from $24.9 million to $153.7 million (a 517% change). Quarterly adjusted EBITDA moved from a loss of $0.0 million to a gain of $17.5 million, shifting the margin from -0.1% to 11.4%. The slide also notes that the sales headcount grew from 450 to 2,200, indicating a massive investment in the human capital required to sell local ads.
Slide 4: Large Market Opportunity
Yelp quantifies its Total Addressable Market (TAM) here. Citing BIA Kelsey and the U.S. Census Bureau, the slide claims there are '20+ Million Local business locations in the U.S.' and a projected '$151 billion U.S. local ad spend' for 2016. A pie chart breaks down where this money currently goes, with 'Directed Mail' ($42 billion) and 'TV' ($22 billion) taking the largest shares. This slide tells investors that Yelp only needs to capture a small fraction of the offline-to-online shift to continue its growth trajectory.
Slide 5: The Industry is Shifting Online
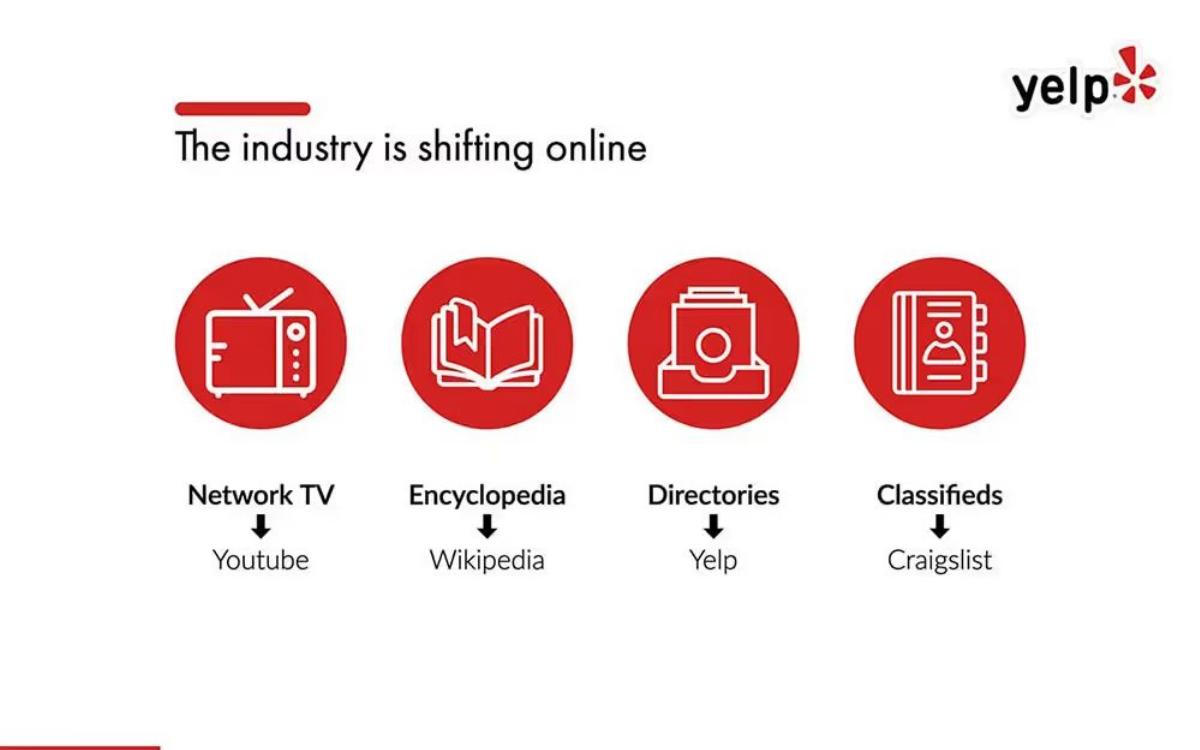
This slide provides the qualitative 'Why Now' for the market data on the previous slide. It uses analogies to show how traditional media has been disrupted: Network TV became YouTube, Encyclopedias became Wikipedia, and Classifieds became Craigslist. Crucially, it positions 'Directories' (meaning the physical Yellow Pages) as having been replaced by Yelp. This frames Yelp not just as a website, but as a fundamental utility of the digital age.
Slide 6: Leading Local Guide with Plenty Room for Growth
Slide 6 addresses the competitive landscape. A bar chart shows Yelp at the top, followed by Groupon, TripAdvisor, YP Sites, Foursquare, and Angie's List. While the Y-axis is not explicitly labeled with a unit (likely millions of unique visitors or a similar reach metric), the visual intent is clear: Yelp is the market leader. The phrase 'plenty room for growth' suggests that despite being #1, they have not yet saturated the market.
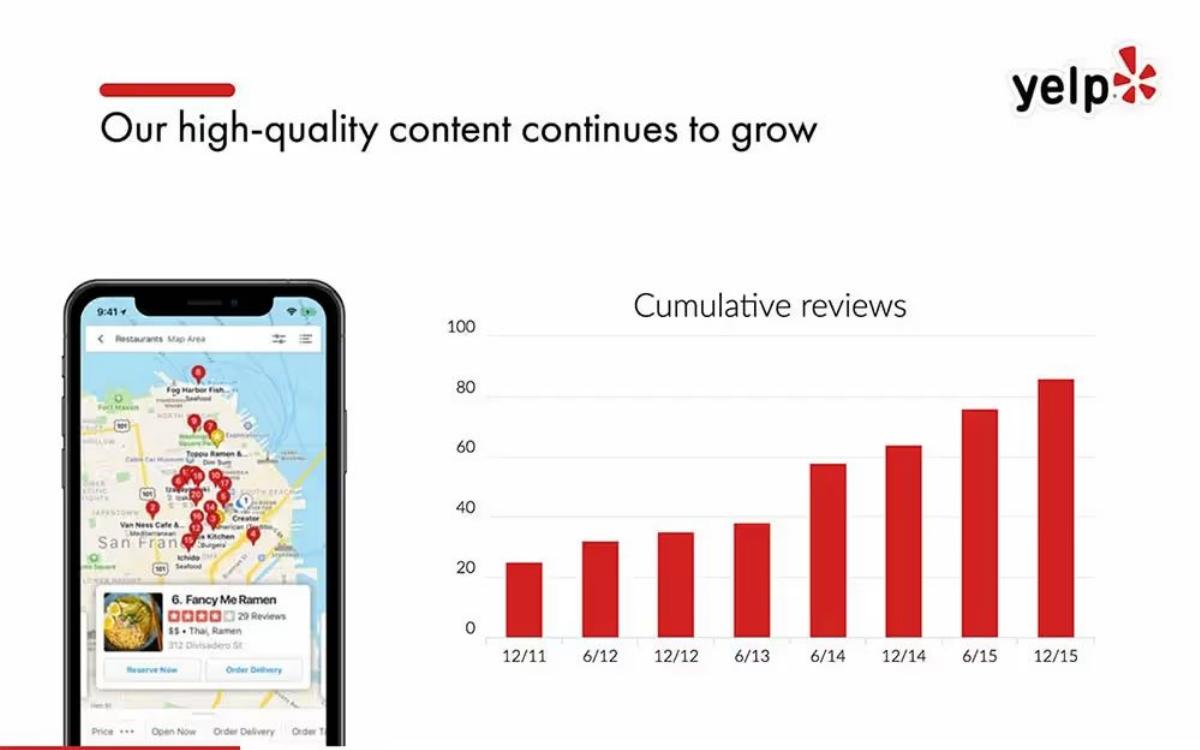
Slide 7: High-Quality Content Growth
Content is the moat for a review site. This slide shows a bar chart of 'Cumulative reviews' from 12/11 to 12/15. The growth is steady and linear, moving from approximately 20 million reviews to over 80 million in four years. By showing a map of San Francisco with dense clusters of pins, Yelp illustrates the 'density' of its data, which makes the product more useful for consumers and harder for competitors to replicate.
Slide 8: Strong App Growth Drives Engagement
This slide highlights the company's successful pivot to mobile. A bar chart shows 'App unique devices' growing from roughly 14 million in Q4 2014 to 20 million in Q4 2015. The most significant piece of text on this slide is: 'App users view more than 10X as many pages as websites users.' This explains why Yelp is so focused on app downloads; every app user is worth significantly more in terms of ad inventory and engagement than a desktop user.
Slide 9: Local Advertising Products
Slide 9 breaks down the revenue model. It lists 'Enhanced profile with video' at $50 - $100 a month and 'Local search ads' with a $50 - $1,000 monthly budget and a CPC of $1 - $20+. By showing icons for a megaphone (ads), a cursor (call to action), and a slideshow (visual content), Yelp demonstrates that it has a diversified suite of products to extract value from local businesses at various price points.
Slide 10: Compelling ROI for Local Advertisers
The deck concludes with the 'bottom line' for the customer. A bar chart compares an 'Average monthly spend on CPC or CPM ads' ($267) against 'Estimated monthly revenue from ad-driven leads' ($983). Citing a Boston Consulting Group survey from November 2012, this slide provides the mathematical justification for a small business owner to spend money on Yelp. It turns an advertising expense into a profit-generating investment, which is the ultimate selling point for any B2B platform.
What Yelp Does Well
The deck is exceptionally disciplined in its use of data. By anchoring every growth metric to the IPO date, Yelp creates a narrative of 'promises kept.' Investors who bought in at the IPO can see exactly how their capital was deployed to scale revenue and user engagement. The comparison to the Yellow Pages (Slide 5) is a brilliant piece of positioning; it takes a complex digital marketplace and explains it through a familiar, multi-billion dollar legacy industry. Furthermore, the focus on 'App vs. Web' engagement (Slide 8) shows that the management team understands where the highest-value growth is coming from and is successfully steering the company in that direction.
What is Missing from the Yelp Deck
As a post-IPO deck, this presentation omits several elements that a private startup would need. There is no 'Team' slide, which is usually a requirement to build trust in the founders' ability to execute. There is also no 'Ask' or 'Use of Funds' slide, as the company is already public and likely using this for quarterly earnings or general investor relations rather than a specific capital raise. From a product perspective, the deck is very light on 'Future Vision.' It explains how the current engine works and how it has grown, but it doesn't offer a glimpse into new verticals (like reservations or deliveries) that might drive the next phase of growth. Finally, there is no mention of risks, such as the increasing competition from Google Maps, which would eventually become Yelp's biggest threat.
Founder Takeaways: What to Copy
Founders should study Slide 3 for its clarity in presenting 'Traction.' If you are raising a Series A or B, comparing your current metrics to your Seed round metrics in a simple table is a powerful way to show velocity. Additionally, Slide 10 (ROI) is a masterclass in B2B sales. If your product costs money, you must be able to show—with data—how much money it makes or saves the customer. Finally, the use of analogies in Slide 5 is a great way to explain a new market category. If you can say 'We are X for Y,' and 'Y' is a massive, dying legacy industry, you immediately help investors understand the scale of the opportunity without needing a 50-page market research report.
Frequently asked questions
- What is the primary goal of this specific Yelp deck?
- This deck, dated Q2 2015, functions as an investor update rather than a seed-stage pitch. Its primary goal is to demonstrate 'strong execution' since the company's IPO. It uses comparative tables to show growth in revenue, EBITDA, and user engagement, proving that the business model is scaling efficiently and that the transition to mobile is driving higher user value.
- How does Yelp define its market opportunity?
- Yelp identifies a $151 billion U.S. local advertising spend for 2016. The deck argues that the industry is shifting online, positioning Yelp as the direct digital successor to 'Directories' (Yellow Pages). By showing that traditional media like newspapers and direct mail still command large portions of that $151 billion, Yelp highlights the massive 'room for growth' as those budgets migrate to digital platforms.
- What is the significance of the mobile app metrics in this deck?
- Slide 8 is critical because it highlights that app users view 10X more pages than website users. By showing that app unique devices grew 251% since the IPO, Yelp is signaling to investors that its most valuable and engaged user base is growing rapidly. This shift to mobile is presented as a primary driver of long-term engagement and advertising inventory.
- How does Yelp justify its advertising costs to local businesses?
- Yelp uses a 'Compelling ROI' slide (Slide 10) to show that for an average monthly spend of $267 on CPC or CPM ads, a business can expect approximately $983 in estimated monthly revenue from ad-driven leads. This nearly 3.7x return is backed by a Boston Consulting Group survey, providing third-party credibility to Yelp's value proposition for small business owners.
- What essential startup pitch elements are missing from this deck?
- Because this is a post-IPO investor deck, it lacks a traditional 'Team' slide, a specific 'Ask' (funding amount), and a 'Problem' slide. It assumes the audience is already familiar with the product. It also lacks a detailed roadmap or future product features, focusing instead on the historical performance and the current efficiency of the existing advertising engine.