Teranga Gold’s August 2016 presentation is a quintessential public-market resource deck. Spanning 32 slides (with 8 key slides analyzed here), it moves quickly past the 'vision' to focus on hard valuation metrics, specifically targeting an 'undervaluation' narrative. The deck is anchored by the Sabodala Gold Mine in Senegal and the proposed acquisition of Gryphon Minerals in Burkina Faso. Unlike venture decks that sell potential, this deck sells proven and probable reserves, citing a $549 million cumulative cash flow projection over the life of the mine. It is heavy on technical compliance (N…
Key takeaways
- The company positions itself as undervalued by comparing its $401M Enterprise Value to peers like B2Gold at $3,624M (Slide 5).
- Teranga projects $549M in cumulative cash flow over the life of the Sabodala mine, despite a planned $44M negative cash flow year in 2021 for underground development (Slide 13).
- The deck highlights a specific M&A strategy involving the acquisition of Gryphon Minerals in Burkina Faso and a joint venture with Miminvest in Cote d'Ivoire (Slide 17).
- Reserve growth is a core metric, showing an 80% increase in reserves since the 2010 IPO, reaching a pro-forma 3.5Moz for 2016 (Slide 21).
- Technical transparency is high, with a full breakdown of measured, indicated, and inferred resources across 10 different deposits (Slide 25).
- The presentation relies heavily on BMO GoldPages data from August 22, 2016, to validate its market positioning (Slide 5).
- Operational focus is centered on West Africa, specifically Senegal, Burkina Faso, and Cote d'Ivoire (Slides 9, 17).
Executive Summary: The Resource Playbook
Teranga Gold’s August 2016 presentation is a clinical example of how a publicly traded mining company communicates value. In the resource sector, 'story' is secondary to 'grade' and 'jurisdiction.' This deck focuses on the Sabodala mine in Senegal and a strategic expansion into Burkina Faso and Cote d'Ivoire. The narrative is simple: we have the gold, the costs are manageable, and the market hasn't realized our true value yet.
Slide 1: Title and Context
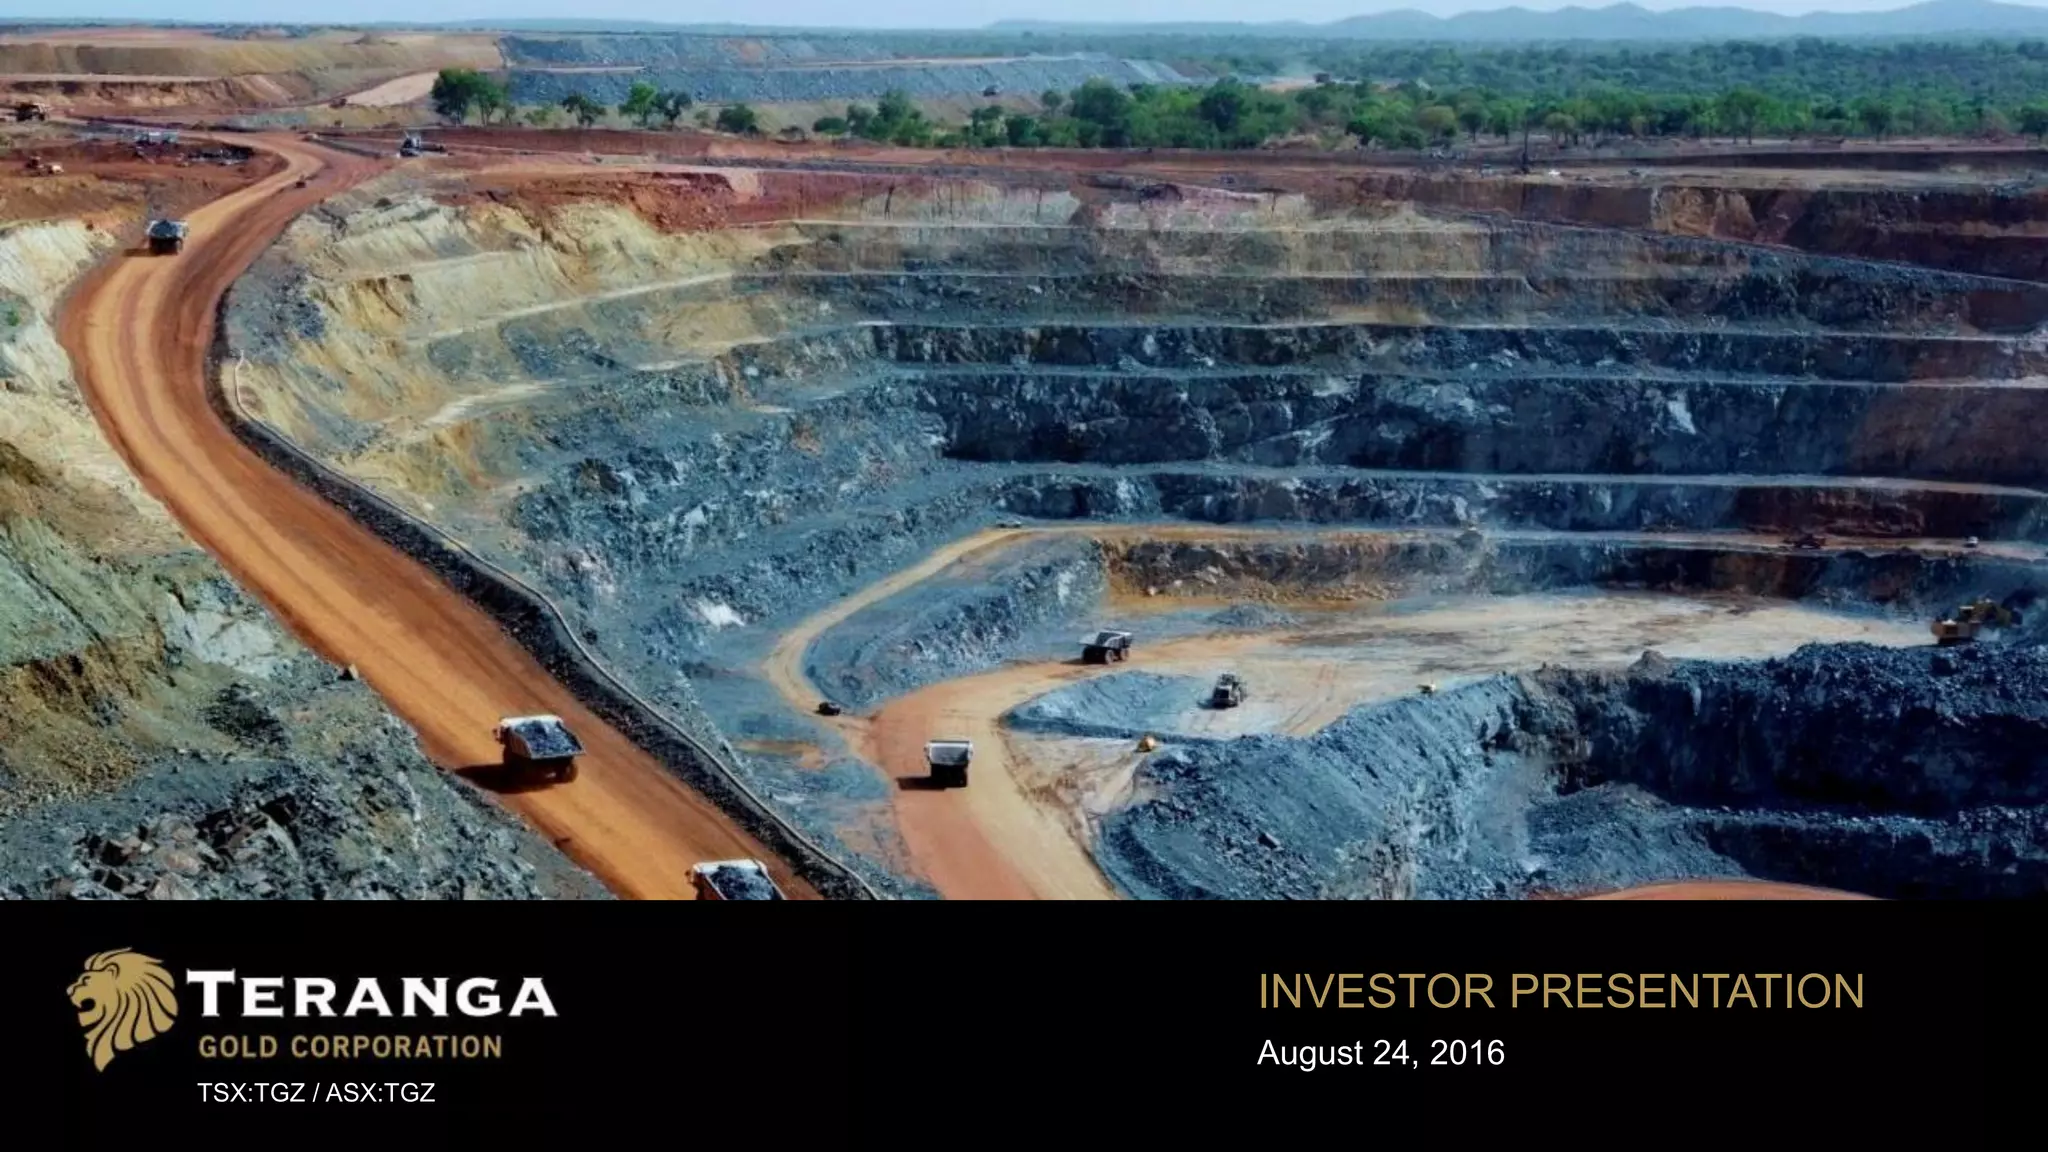
The cover slide establishes immediate professional credibility with a high-resolution aerial shot of an active open-pit mine. It identifies the company as Teranga Gold Corporation and lists its dual-listing tickers: TSX:TGZ and ASX:TGZ. The date, August 24, 2016, is crucial as mining decks are highly sensitive to the spot price of gold at the time of publication.
Slide 5: The Undervaluation Thesis
This is the most aggressive slide in the deck. It uses four charts to compare Teranga against peers like Perseus, Alacer, Golden Star, and B2Gold. Slide 5 notes an Enterprise Value of $401M, which is dwarfed by B2Gold’s $3,624M. The most compelling data point is the EV/2016E EBITDA, where Teranga sits at 3.1x, significantly lower than the peer average. This slide is designed to trigger a 'value' signal for institutional investors looking for arbitrage between current price and asset quality.
Slide 9: Asset Spotlight - Sabodala Gold Mine
A transition slide featuring the Sabodala Gold Mine in Senegal. In mining, the 'flagship' asset must be presented as a stable, industrial powerhouse. The imagery of the processing plant at night emphasizes 24/7 operations and significant existing infrastructure investment, reducing the perceived risk of 'development' failures.
Slide 13: Cash Flow and Life of Mine (LOM)
Slide 13 provides a year-by-year cash flow projection from 2016 to 2029. The headline figure is $549M in cumulative cash flow. The slide is notable for its honesty regarding the year 2021, where it projects a ($44M) cash flow deficit due to underground mine development. By showing the subsequent recovery to $68M in 2023 and $137M in 2024, the company justifies the short-term capital expenditure as a bridge to higher-margin production.
Slide 17: Strategic M&A Expansion
This slide introduces the 'Proposed Acquisition of Gryphon Minerals' in Burkina Faso and a 'Joint Venture with Miminvest' in Cote d'Ivoire. This represents a shift from a single-mine company to a regional consolidator. For investors, this mitigates 'single-asset risk'—the danger that a problem at one mine could bankrupt the entire company.
Slide 21: Reserve Growth Metrics
Slide 21 visualizes the growth of the company's reserve base. It claims an '80% increase in reserves since IPO.' The chart shows the progression from 1.5Moz at the 2010 IPO to a pro-forma 3.5Moz in 2016. It specifically breaks down the 2.6M Proven & Probable reserves at an average grade of 1.59 grams per tonne. In mining, 'grade is king,' and maintaining a grade above 1.5g/t while increasing volume is a key indicator of operational health.
Slide 25: Technical Resource Summary
This is a data-heavy table that would be ignored in a tech pitch but is essential here. It lists ten different deposits (Sabodala, Gora, Niakafiri, etc.) and breaks them down by Tonnes, Grade, and Ounces across Measured, Indicated, and Inferred categories. The total 'Measured and Indicated' resource is listed at 85,373,000 tonnes at 1.62 g/t for 4.44 million ounces. This level of granular detail is required for compliance and for technical due diligence by buy-side analysts.
Slide 32: The 'Notes' Slide
The final slide provided is a blank 'Notes' page. While seemingly useless, in a printed investor packet, this is a standard inclusion for analysts to jot down figures during a live roadshow presentation.
What Teranga Gold Does Well
The deck excels at comparative benchmarking . By placing their metrics directly alongside well-known competitors, they remove the guesswork for the investor. They also do an excellent job of mapping the capital cycle . Mining is capital-intensive; by showing exactly when the money goes out (2021) and when it comes back (2022-2029), they build a transparent relationship with their shareholders. Finally, the use of standardized reporting (NI 43-101) ensures that the data is beyond reproach from a regulatory standpoint.
What is Missing from the Deck
The most glaring omission in these slides is a detailed management team slide . While the assets are impressive, mining in West Africa requires significant political and operational expertise. There is also no mention of ESG (Environmental, Social, and Governance) initiatives, which, even in 2016, were becoming critical for institutional investors in the extractive industries. Finally, while they mention a 'Joint Venture,' the specific terms of the Gryphon acquisition (cash vs. stock, dilution impact) are not detailed in these specific slides.
Founder Lessons: Copy These Tactics
The 'Undervaluation' Anchor: If you are raising a down-round or a flat-round, or if you believe your industry is currently out of favor, use Slide 5’s approach. Compare your internal metrics (EBITDA, users, revenue) against the multiples of your larger peers to show the 'upside' for a new investor. · Visualizing the Long Game: Slide 13’s cash flow bridge is excellent. Don't just show a hockey stick; show the 'valley of death' (the capex year) and explain exactly why it is a prerequisite for the subsequent growth. · Data Granularity: If you are in a technical field (Biotech, Deep Tech, Fintech), don't be afraid of a slide like Slide 25. Providing a 'Data Room' style summary slide within the deck shows you have nothing to hide and have done the rigorous work. · Jurisdictional Focus: Teranga clearly defines its sandbox (West Africa). For startups, this translates to 'Market Focus.' Don't try to be everything to everyone; show that you are winning a specific, high-value geography or niche before expanding.
Frequently asked questions
- What is the primary valuation argument in this deck?
- Teranga Gold argues they are significantly undervalued relative to their production and reserves. On Slide 5, they show an EV/2016E EBITDA multiple of 3.1x, which is the lowest among their peer group, including Endeavour (5.6x) and Roxgold (13.1x). By highlighting these discrepancies, they are signaling a 'buy' opportunity to investors based on a eventual market correction to peer-level multiples.
- How does the company handle the risk of negative cash flow?
- Slide 13 explicitly forecasts a negative cash flow of $44 million in 2021. Rather than hiding this, they frame it as a necessary 'large capex associated with underground mine development.' This transparency builds credibility with institutional investors who understand the cyclical capital requirements of transitioning from open-pit to underground mining operations.
- What is the significance of the Gryphon Minerals acquisition?
- The acquisition is the primary driver for their 'Pro Forma 2016' reserve growth. According to Slide 21, adding Gryphon’s 0.826Moz of reserves to Teranga’s existing 2.63Moz allows the company to reach a 3.5Moz reserve base. This move shifts the company from a single-asset producer to a multi-jurisdictional player in West Africa.
- What technical standards does the deck adhere to?
- The deck frequently references NI 43-101 Technical Reports (Slide 13) and CIM definitions for Mineral Resources (Slide 25). These are Canadian regulatory standards for disclosure for mineral projects. Adhering to these is mandatory for their TSX listing and ensures that the 'Proven & Probable' reserve claims are audited and standardized.
- Who is the intended audience for this presentation?
- This is not a deck for seed investors. With its focus on EV/EBITDA multiples, gold grade (grams per tonne), and complex resource tables, it is designed for institutional equity analysts, hedge fund managers, and mining-sector specialists who trade on the TSX and ASX.