Buynomics secured a $13M Series A in 2024 by positioning itself as the 'Operating System for Commercial Decisions.' The deck successfully moves from a high-level problem—the inaccuracy of traditional price elasticity models—to a granular demonstration of their ML-driven accuracy. By highlighting $17.8B in revenue under management and providing a side-by-side case study comparing their predictions against actual market outcomes, the company provides a rare level of proof for an enterprise SaaS tool. While the deck is light on competitive landscape and specific team bios in the provided slides,…
Key takeaways
- The company positions itself as a 'Commercial Operating System' rather than just a pricing tool (Slide 1, 7).
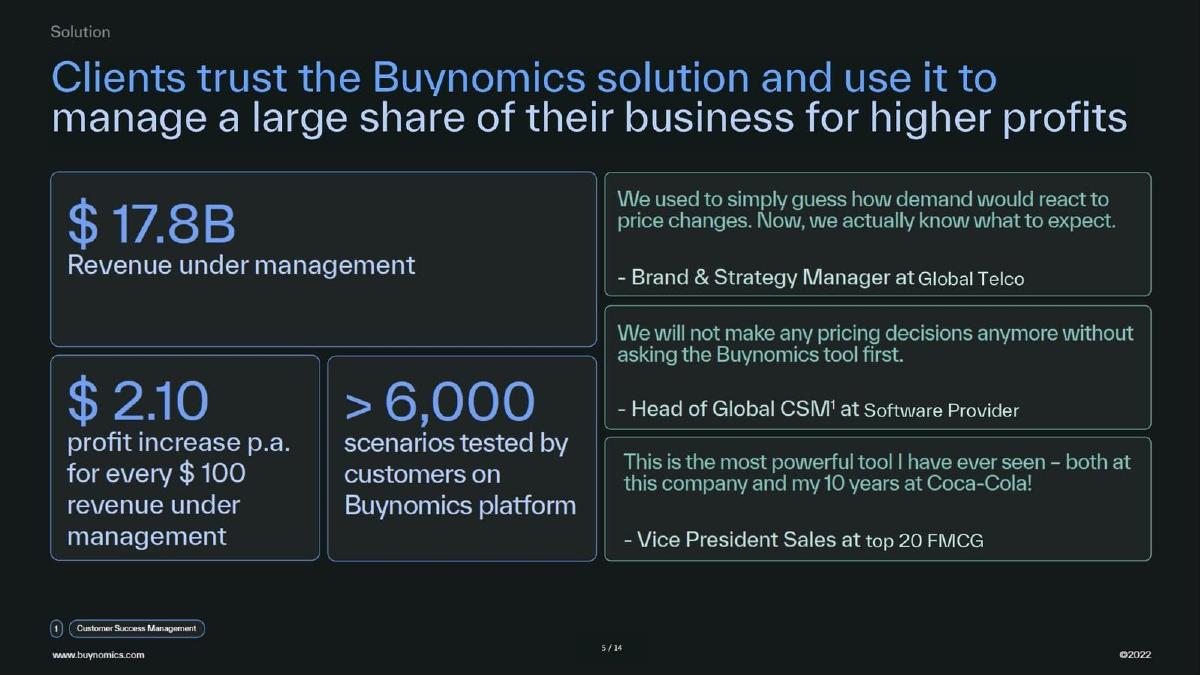
- Buynomics claims to manage $17.8B in revenue for its clients as of the 2022 deck version (Slide 5).
- The platform delivers a reported $2.10 profit increase per $100 of revenue under management (Slide 5).
- A detailed case study shows the platform predicted a 4.3m unit sales drop, nearly matching the actual 4.1m drop, while traditional methods predicted 10.2m units (Slide 11).
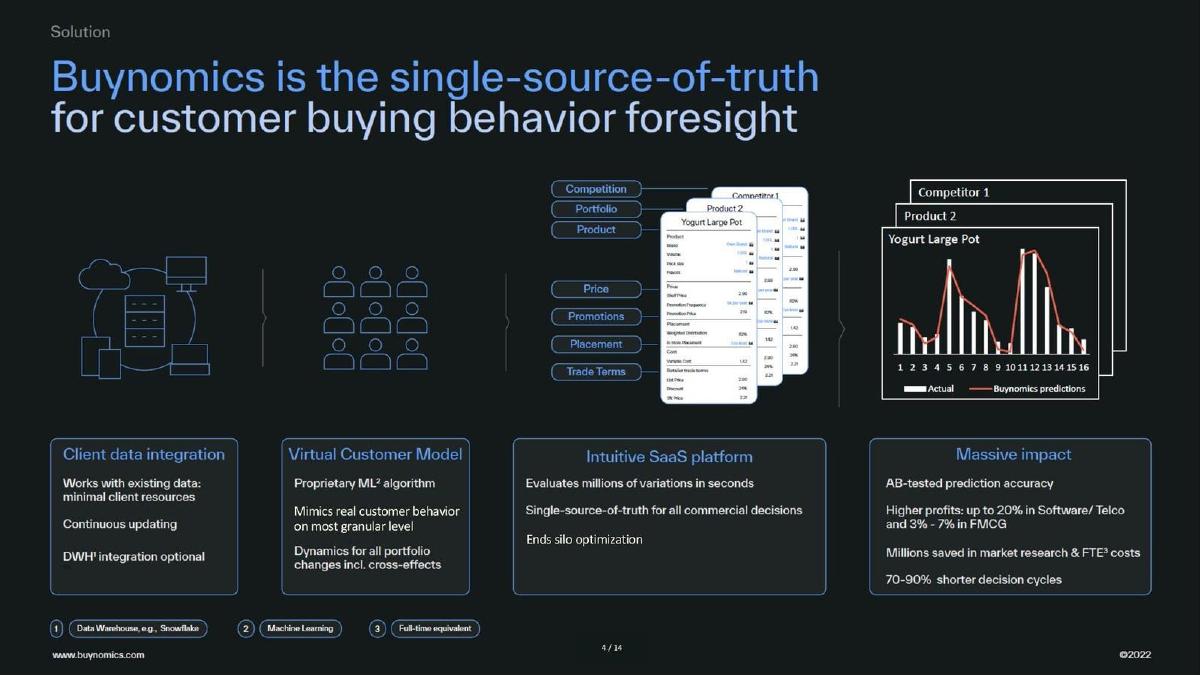
- The software requires only three data inputs to function: sales data, product data, and promotional activity (Slide 9).
- The deck identifies 'gut-feeling' and 'isolated conjoint studies' as the primary legacy competitors (Slide 3).
- Future expansion plans include moving into supply chain, sales, and account management use cases (Slide 7).
- The product claims to drive up to 20% higher profits for specific sectors like telecoms and software (Slide 13).
Introduction: The Shift from Gut Feeling to Behavioral Science
Buynomics entered the market with a clear target: the outdated methods large enterprises use to set prices and manage product portfolios. As reported by Business Insider, the company raised a $13M Series A in 2024. The deck analyzed here, dated 2022, serves as the foundation for that growth, focusing heavily on the inaccuracy of legacy economic models. By positioning their solution as an 'Operating System,' Buynomics attempts to move away from being a niche 'tool' and toward becoming a mission-critical infrastructure component for CPG, Telco, and Software giants.
Slide 1: The Vision Statement
The deck opens with a minimalist title slide. The tagline, "Building the Operating System for Commercial Decisions," is a strategic choice. In enterprise software, an 'Operating System' implies a platform that other processes run on, suggesting high stickiness and a broad total addressable market (TAM). It lists the founders, Dr. Sebastian Baier and Dr. Ingo Reinhardt, signaling a leadership team with academic or professional expertise in the field.
Slide 3: Defining the Challenge
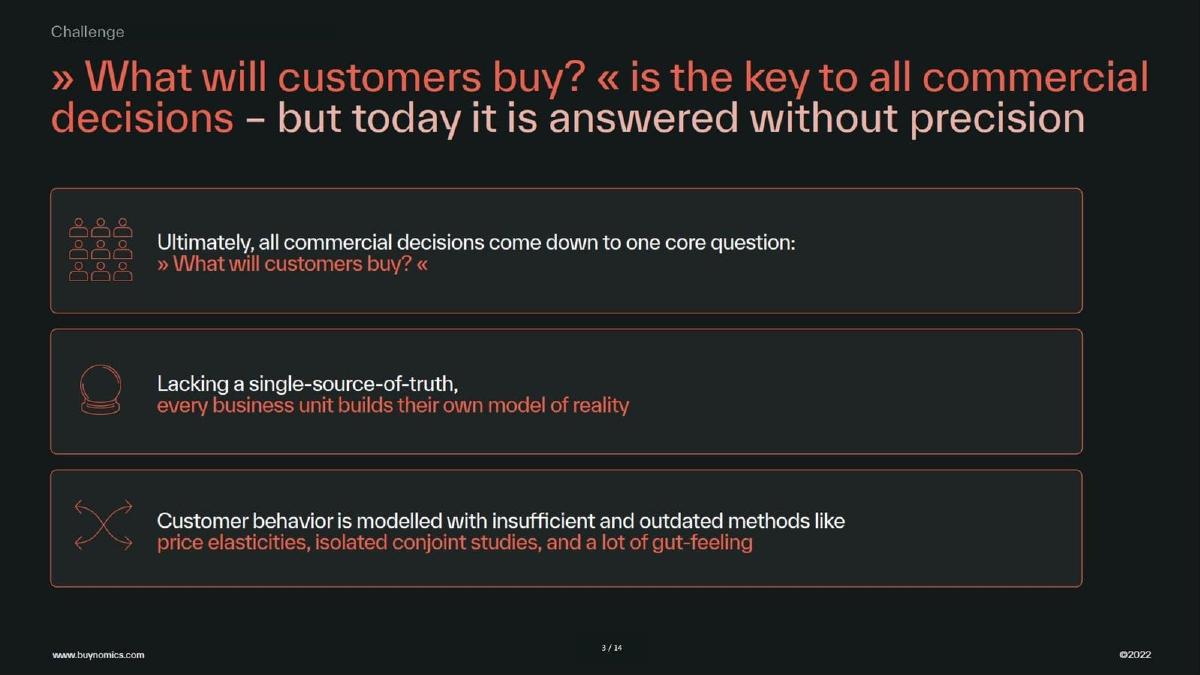
Slide 3 identifies the 'Challenge' by framing a single question: "What will customers buy?" The slide argues that this question is currently answered without precision. It highlights three specific pain points: the lack of a single source of truth across business units, the reliance on outdated methods like price elasticities and conjoint studies, and the prevalence of 'gut-feeling' in high-stakes decision-making. This is a classic 'villain' slide, setting up the status quo as inefficient and fragmented.
Slide 5: Quantifying Success and Social Proof
This is the 'money slide' of the deck. Buynomics presents three massive figures to validate their existence: "$17.8B Revenue under management," ">6,000 scenarios tested," and a very specific ROI metric: "$2.10 profit increase p.a. for every $100 revenue under management." By breaking down the profit increase to a per-$100 basis, they make the value proposition easy for a CFO to digest. The right side of the slide features testimonials from a Global Telco, a Software Provider, and a Top 20 FMCG company. The mention of a VP of Sales comparing the tool favorably to their 10 years at Coca-Cola provides significant industry credibility.
Slide 7: The Product Roadmap and Expansion
Slide 7 visualizes the transition from today's focus to tomorrow's 'Commercial Operating System.' The current focus is shown as Pricing, Promotions, and Revenue Optimization. The 'Adjacent' use cases include Portfolio Changes, Innovations, and Bundling. The future roadmap (highlighted in red) pushes into Supply Chain and Sales & Account Management. This slide is designed to show investors that while they are winning in pricing today, the platform has the potential to capture much more of the enterprise budget over time.
Slide 9: The Technical Workflow
Under the heading "How it works," slide 9 demystifies the platform. It emphasizes ease of integration, stating that only three things are required: sales data, product data, and promotional activity. The process is broken into four quadrants: Integrate data, Calibrate ML algorithm, Test hypotheses at no risk, and Make informed decisions. This addresses a common enterprise concern: that AI/ML tools require years of data cleaning and massive implementation projects before showing value.
Slide 11: The Comparative Case Study
Slide 11 provides a technical deep dive into a consumer goods case study. It compares the "Buynomics method" against the "Traditional method (elasticities)." The data is striking: for a 15% price increase, the traditional method predicted a 14% sales drop (leading to a forecast of ~10.2m units). Buynomics predicted a much sharper 64% drop (~4.3m units). The 'Actual' result was a drop to ~4.1m units. This slide proves that Buynomics isn't just different; it is significantly more accurate in predicting catastrophic sales drops that traditional models miss. It turns a theoretical advantage into a concrete, data-backed win.
Slide 13: The User Interface and Key Benefits
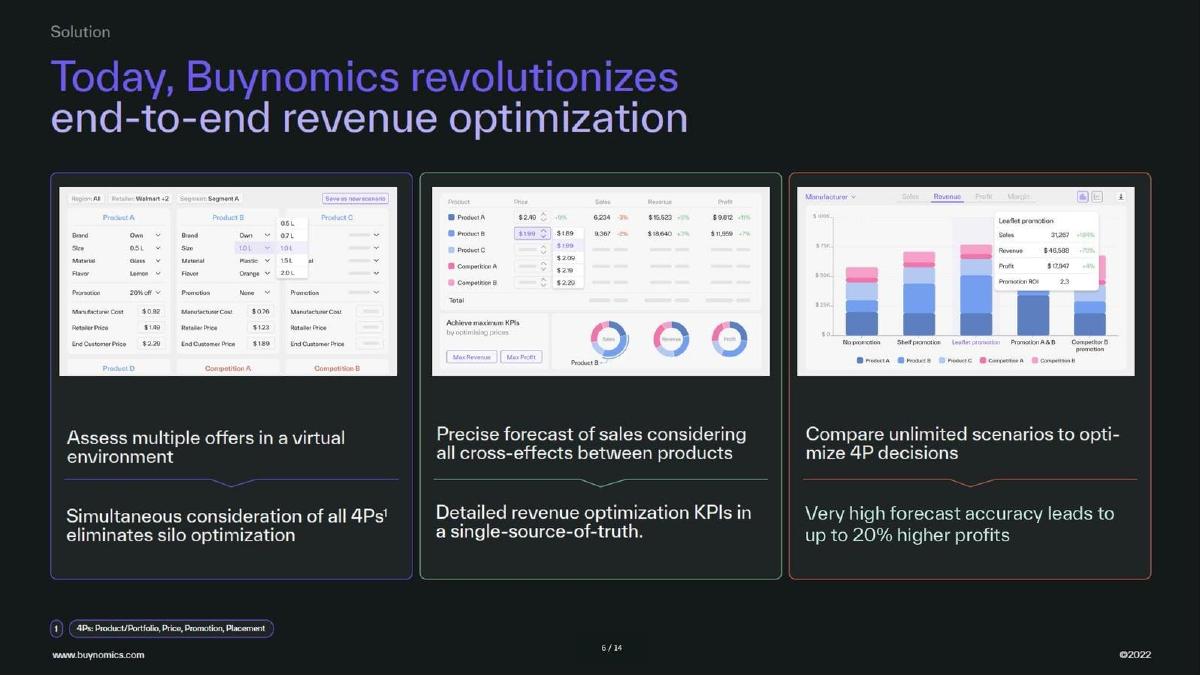
The final content slide shows a screenshot of the Buynomics dashboard. It looks like a modern SaaS platform, featuring 'Market alerts,' 'Improvement potential,' and 'Goals status.' The right side of the slide summarizes the four pillars of their value: Holistic approach , Predictive accuracy , Speed to Insight , and Better Profitability . It reiterates the claim of "4-7% higher profits" generally, and "up to 20% for telecoms & software."
What Works in the Buynomics Deck
The deck is exceptionally strong in its use of quantifiable proof . Many startups claim to increase profit, but few provide a specific dollar-for-dollar breakdown ($2.10 per $100) or a side-by-side accuracy comparison against actual market results. This level of detail is exactly what Series A investors look for to de-risk a technical product.
The narrow data requirement mentioned on Slide 9 is another highlight. By telling the investor (and the potential customer) that they only need three types of data, they remove the 'implementation friction' objection that kills many enterprise software deals.
Finally, the social proof is top-tier. Mentioning Coca-Cola and 'Top 20 FMCG' companies, even if the specific names are sometimes anonymized for privacy, suggests that the product has already passed the rigorous procurement and security hurdles of the world's largest organizations.
What is Missing from the Buynomics Deck
The provided slides lack a detailed Team slide . While the founders are named on the cover, there is no information regarding their specific backgrounds, previous exits, or the depth of the engineering and data science teams. For a Series A, the 'Why this team?' question is usually paramount.
There is also no Competition slide . While they mention 'traditional methods' and 'gut feeling,' they do not address other modern AI pricing competitors. Investors want to know how Buynomics wins against other well-funded startups in the pricing optimization space.
The Financials and 'The Ask' are also absent from these slides. There is no mention of current ARR (Annual Recurring Revenue), growth rates, or how the $13M will be allocated (e.g., hiring, geographic expansion, R&D). While these may have been in a separate document or a later section of the deck, their absence here leaves the narrative incomplete.
Founder Takeaways: How to Copy the Buynomics Strategy
Lead with the 'Villain': Don't just say your product is good; show why the current way of doing things is fundamentally broken. Buynomics does this by attacking the mathematical flaws of price elasticity. · Create a 'Unit of Value': If you can say 'For every X you spend/manage, we give you Y in profit,' you have won the ROI argument. Find your version of the '$2.10 per $100' metric. · Use 'Actual vs. Predicted' Data: If your product makes predictions, show a case study where you were right and the incumbent was wrong. Nothing builds trust faster than a graph showing your prediction hugging the 'Actual' line while the competitor misses by 50%. · Define the 'OS' Vision: Even if you are a single-feature tool today, show the map of how you become the 'Operating System' for your category. It expands your perceived TAM and makes you look like a platform rather than a feature. · Minimize Data Friction: Explicitly state the minimum data required to get started. It lowers the perceived cost of switching to your platform.
Frequently asked questions
- What is the core value proposition of Buynomics?
- Buynomics replaces traditional, often inaccurate pricing models like price elasticity and conjoint studies with a machine learning platform based on behavioral economics. It allows enterprises to simulate how customers will react to changes in price, bundling, or innovations before they are implemented, reducing the risk of commercial decisions.
- How much data does a company need to use Buynomics?
- According to slide 9, the platform is designed for low friction, requiring only three primary data points: sales data, product data, and promotional activity. While additional data can improve accuracy, these three are the only requirements for the tool to function.
- What kind of ROI does the deck claim?
- The deck provides a specific efficiency metric on slide 5: a $2.10 profit increase per annum for every $100 of revenue under management. On slide 13, it further specifies that telecoms and software providers can see profit gains of up to 20%.
- Who are the primary users of the platform?
- The deck includes testimonials from a Brand & Strategy Manager at a Global Telco, a Head of Global Customer Success Management at a software provider, and a VP of Sales at a top 20 FMCG (Fast-Moving Consumer Goods) company, indicating a focus on large-scale enterprise clients.
- What is the long-term vision for the product?
- Slide 7 outlines a roadmap to become the 'OS for all commercial decisions.' This involves expanding from current focuses like pricing and promotions into adjacent areas such as consumer insights, competitive intelligence, supply chain optimization, and sales/account management.