The August 2015 deck for Pyatt Broadmark Real Estate Lending Fund I (PBRELF I) serves as a comprehensive guide for potential limited partners interested in short-term real estate debt. The fund targets an annualized loan return of 18% to 20% by focusing on construction loans with an average life of just 8.5 months. Key to their pitch is a track record of minimal defaults—only three out of 359 loans across two funds—and a fee structure where investors receive 80% of interest income and 20% of origination fees. The deck is heavy on compliance and risk disclosures, reflecting the regulated natur…
Key takeaways
- The fund targets high-yield short-term debt with an average loan life of 8.5 months and an average interest rate of 12.2% (Slide 10).
- Investors are required to commit a minimum of $100,000, with the fund maintaining a capacity to accept up to $5M per month (Slide 7).
- The revenue split is structured as 80% of interest income and 20% of origination fees going to investors, with the remainder covering management costs (Slide 7).
- Risk mitigation is highlighted by a historical default rate of less than 1%, with only 3 foreclosures out of 359 loans written (Slide 10).
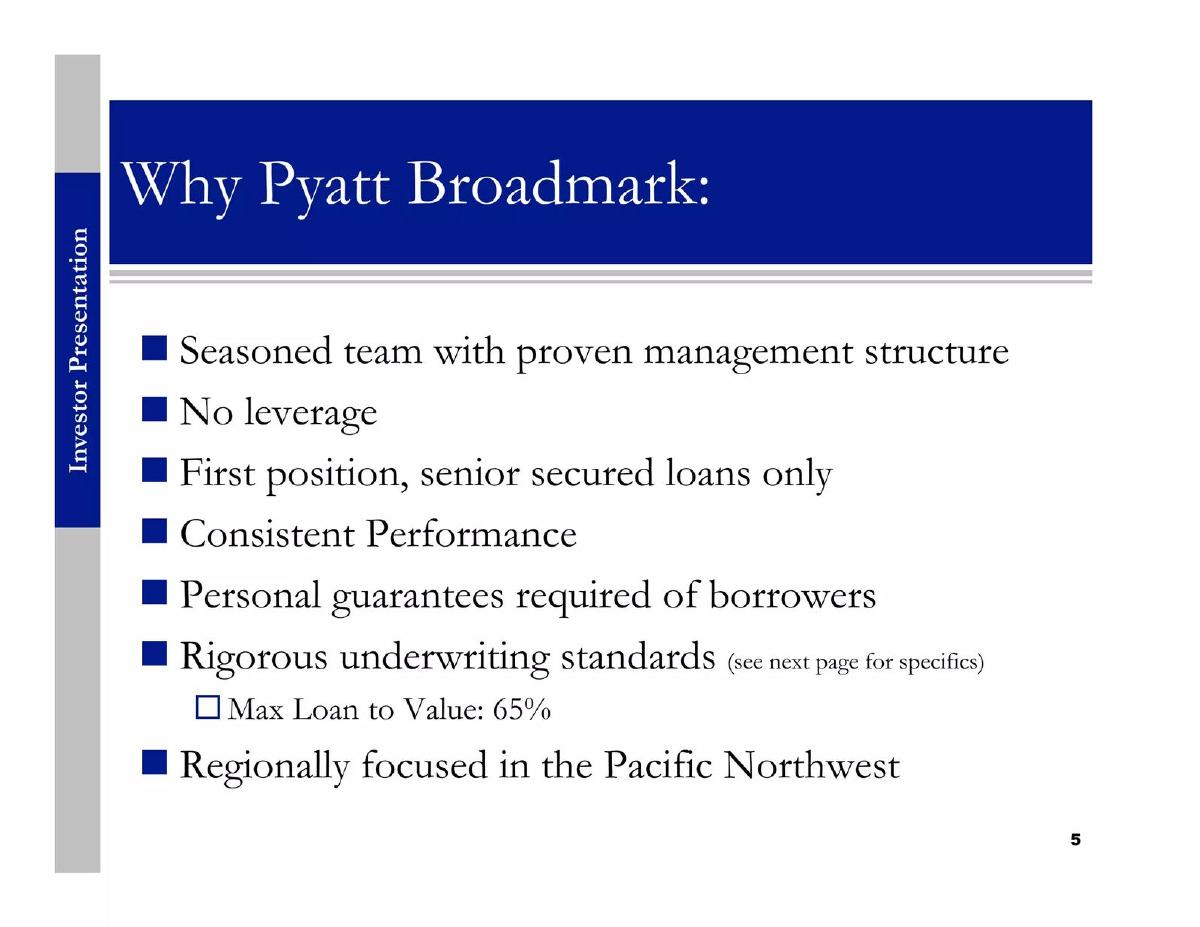
- The fund operates with a 65% loan-to-value (LTV) ratio on construction projects to ensure capital preservation (Slide 28).
- Liquidity is managed through a redemption option available after one year, followed by quarterly windows (Slide 7).
- The management team emphasizes deep regional expertise in the Pacific Northwest, specifically Washington state (Slides 19, 25, 28).
- Macroeconomic justification for the fund includes the impact of Dodd-Frank regulations on traditional bank lending (Slide 13).
Introduction and Fund Overview
The Pyatt Broadmark Real Estate Lending Fund I (PBRELF I) presentation, dated August 2015, is a professional investor deck designed to raise capital for a private debt vehicle. Unlike a typical startup pitch deck that focuses on growth and scale, this deck focuses on yield, security, and operational history. The branding is conservative, utilizing a blue and grey color palette consistent with financial services firms.
Slide 1: Title Slide
The title slide establishes the fund's name, Pyatt Broadmark Real Estate Lending Fund I, and the date of August 2015. It features the logos of Pyatt Broadmark Management, LLC and Broadmark Capital. The presentation is clearly marked as an "Investor Presentation," signaling its purpose for capital raising from accredited investors or institutions.
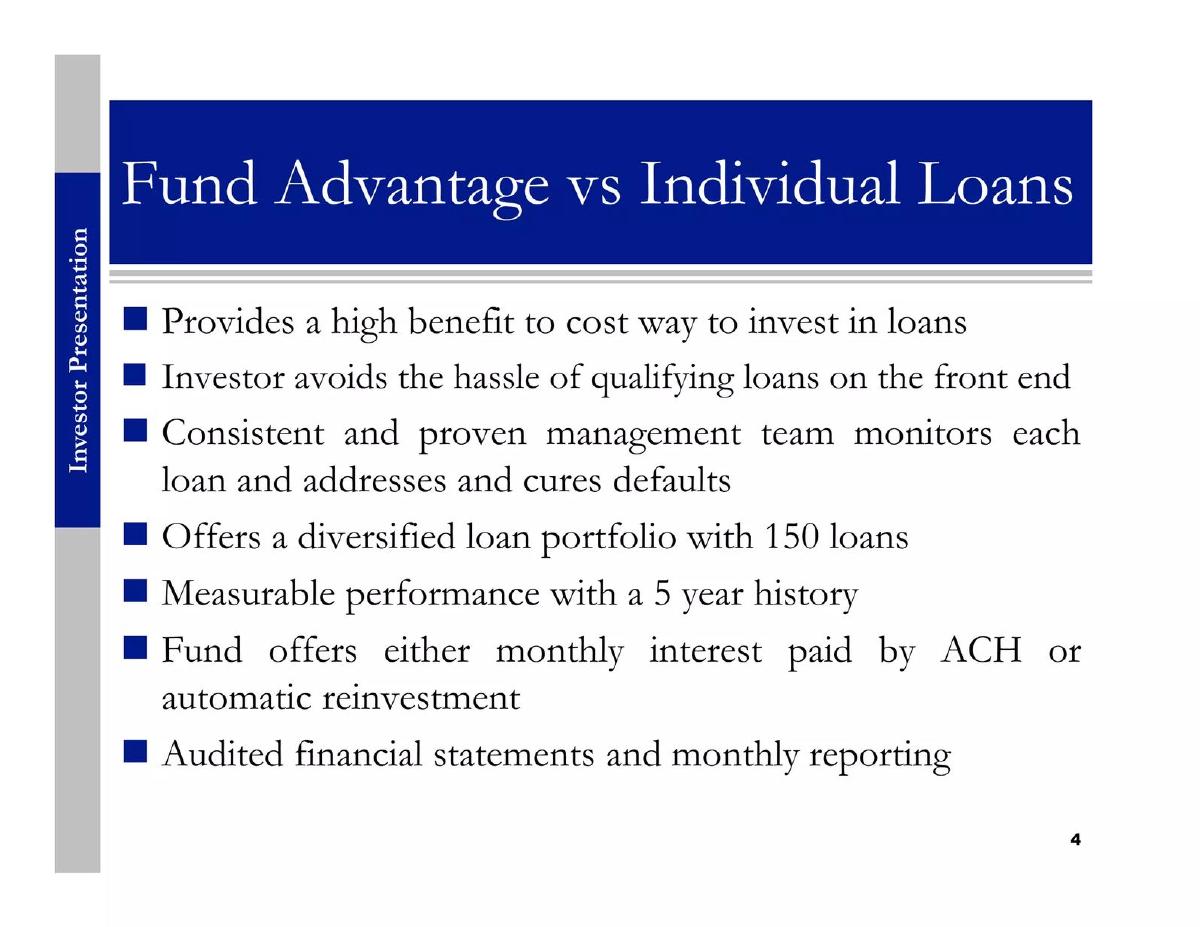
Slide 4: Fund Advantage vs. Individual Loans
This slide serves as the value proposition for the fund structure over direct trust deed investing. It highlights that the fund provides a "high benefit to cost way to invest in loans" and removes the "hassle of qualifying loans" for the individual investor. Key metrics mentioned include a diversified portfolio of 150 loans and a 5-year measurable performance history. The slide also emphasizes transparency through audited financial statements and monthly reporting, which are critical for building trust in the private lending space.
Slide 7: Investor Terms
Slide 7 outlines the mechanics of the investment. The fund is structured as a limited liability company (LLC) with a minimum investment of $100,000. It notes a capacity to accept up to $5M per month, suggesting a steady pipeline of loan opportunities. The return structure is specific: investors receive 20% of origination fee income and 80% of interest income. The remaining balance covers management fees and operating costs. Liquidity is addressed with a one-year lock-up followed by quarterly redemption options, and monthly cash distributions are standard.
Slide 10: Loan Economics and Performance
This is arguably the most important slide for a debt fund. It lists the average life of a loan at 8.5 months, an average origination fee of 3.4%, and average interest rates of 12.2%. The target annualized loan return is cited between 18% to 20%. Crucially, the slide addresses risk: out of 359 loans, only three have faced foreclosure. Two resulted in no loss of principal, and the third (a strip center in Spokane, WA) was real-estate owned (REO) with a principal-to-appraised-value ratio of 64.3%. This data point reinforces the fund's 65% LTV (Loan-to-Value) limit as a hard safety floor.
Slide 13: The Market Opportunity
To justify the high interest rates they charge borrowers, the fund explains why borrowers choose them over other options. They note that outside equity partners often demand 50% or more of profits, making high-interest debt a cheaper alternative for developers. Furthermore, they cite a Boston Consulting Group quote regarding Dodd-Frank regulatory burdens, which have forced traditional banks out of the construction lending market. Finally, they reference the American Institute of Architects to show a strong outlook for construction activity (predicted up 7.7% in 2015 and 8.2% in 2016).
Slide 16: Risk Factors & Disclaimers
This slide contains dense legal text typical of private placements. It explicitly labels the investment as "speculative" and involving a "high degree of risk." It identifies risks such as dependence on senior management, real estate valuation fluctuations, and the lack of a secondary market for the loans (Level III assets). It also mentions a 10% write-down policy for any loan in default, providing a clear accounting standard for how they handle non-performing assets.
Slides 19, 22, and 25: Team Bios
The deck devotes significant space to the management team, which is standard for "GP/LP" (General Partner/Limited Partner) structures where the track record of the individuals is the primary product. Jeffrey Pyatt (Founder) is highlighted on Slide 19 for his 22 years of experience leading Northwest companies and his history as an asset-based lender. Alan Seidner (Senior Consultant) is featured on Slide 22, showcasing his background at Merrill Lynch and Security Pacific Bank, as well as his authorship of financial reference works. Bryan Graf is profiled on Slide 25, focusing on his local ties to Washington State and his experience in leasing and real estate brokerage. The team is presented as having a mix of institutional finance background and local real estate expertise.
Slide 28: Sample Loan Profiles
The presentation concludes with a case study of a construction loan in Graham, WA (Loan 2015-060). The fund wrote a $165,000 loan for a single-family home with an appraised value of $254,000, hitting their 65% LTV target exactly. The slide notes that the home was presold, further de-risking the exit. It also mentions that the fund has funded 8 loans with this specific borrower, highlighting their ability to generate repeat business from reliable builders.
What Works in This Deck
The deck is highly effective at addressing the specific concerns of debt investors: yield, security, and process. By providing the exact average interest rate (12.2%) and origination fee (3.4%), they remove ambiguity about how the 18-20% target return is achieved. The inclusion of the foreclosure history (3 out of 359) is a powerful proof point for their underwriting rigor. Furthermore, the sample loan profile on Slide 28 makes the abstract strategy concrete by showing exactly what a "65% LTV construction loan" looks like in the real world.
What Is Missing
While the deck is thorough regarding the fund's mechanics, it lacks a clear visual representation of the overall portfolio composition. There is no chart showing the breakdown of loans by property type (e.g., residential vs. commercial) or specific geographic concentration beyond the mentions of Washington state. Additionally, while they mention 150 loans in the portfolio, a summary of the total Assets Under Management (AUM) at the time of the presentation is not explicitly stated on these slides. Finally, there is no slide detailing the specific "direct fund expenses" that are deducted before the 80/20 interest split, which could be a point of friction for sophisticated investors.
Founder Takeaways
For founders raising a fund or a fintech platform involving debt, this deck provides a masterclass in transparency. Be specific about your 'Why': Slide 13 does an excellent job of explaining why their high-interest product is actually a good deal for the borrower (cheaper than equity). Quantify your safety margins: Don't just say you are conservative; show the LTV and the outcome of your worst-performing loans. Structure the 'Ask' clearly: Slide 7 leaves no questions about the minimum check size, the lock-up period, or the distribution frequency. This clarity reduces the back-and-forth during due diligence and qualifies the right investors immediately.
Frequently asked questions
- What is the primary investment strategy of PBRELF I?
- The fund focuses on short-term real estate construction lending, primarily in the Pacific Northwest. According to slide 10, the average loan life is 8.5 months. They target an annualized return of 18% to 20% by charging an average interest rate of 12.2% and an average origination fee of 3.4%, while maintaining a conservative 65% loan-to-value ratio to protect principal.
- How are investor returns and fees structured?
- As detailed on slide 7, investors receive a majority share of the fund's revenue: 80% of the interest income (minus direct expenses like taxes and audit) and 20% of the origination fee income. The remaining 20% of interest and 80% of origination fees are retained by the management company to cover operating costs and management fees.
- What is the fund's track record regarding defaults?
- Slide 10 states that out of 359 loans written across their funds, only three have entered foreclosure. Of those three, two were completed with no loss of principal. The third was a strip center in Spokane, WA, where the principal owed was 64.3% of the appraised value, illustrating their commitment to the 65% LTV safety margin.
- What are the liquidity terms for investors?
- Investment in PBRELF I is not intended for short-term trading. Slide 7 notes a one-year lock-up period, after which investors have a redemption option on a quarterly basis. Distributions of income are made monthly, either directly to the investor's bank account via ACH or through automatic reinvestment.
- Why does the fund believe this market opportunity exists?
- Slide 13 attributes the opportunity to two factors: the high cost of equity partners (who often take 50% or more of profits) and regulatory pressure on banks. Specifically, they cite Dodd-Frank regulations as a driver that makes traditional banks less able to serve core economic demands in construction lending.