The 2012 investor presentation for Penn Virginia Corporation (NYSE: PVA) serves as a roadmap for a mid-tier energy company navigating a depressed natural gas market. The deck emphasizes a strategic pivot toward 'oily' drilling, specifically within the Eagle Ford Shale's volatile oil window. By highlighting a significant ramp-up in liquid volumes—reaching approximately 95% of Eagle Ford production by mid-2012—the company attempts to reassure investors of its adaptability. The presentation balances operational success, such as high initial production (IP) rates across multiple wells, with the h…
Key takeaways
- The company explicitly identifies diminished cash flows from natural gas as a primary challenge on slide 4.
- Strategic focus shifted to oil in mid-2010, resulting in significant EBITDAX growth through 2012 as shown on slide 7.
- Eagle Ford gross operating margins reached approximately $14 per Mcfe in 2Q12, according to slide 7.
- Slide 10 provides granular operational data, listing 26 specific wells with IP rates ranging from 827 to 1,921 BOEPD.
- Production volumes in the Eagle Ford ramped up from near zero in 1Q11 to over 600 MBOE in 2Q12, per slide 13.
- Liquids, primarily crude oil, accounted for approximately 95% of Eagle Ford volumes by mid-2012 as stated on slide 13.
- The company utilized natural gas hedges to lock in prices at $5.31 and $5.10 per MMBtu, well above the $2.59 and $2.85 forecasts for late 2012, shown on slide 19.
- The deck omits a formal management team slide and a specific capital request in the provided 8-slide selection.
Executive Summary: The Pivot to Liquids
The Penn Virginia Corporation (PVA) investor presentation from August 2012 is a textbook example of a public commodity-based company communicating a major strategic shift. At the time, the energy sector was grappling with a glut of natural gas, forcing companies with heavy gas footprints to either adapt or face insolvency. This deck focuses on the 'Catalysts' that the company believed would carry it through: a transition to oil-heavy production in the Eagle Ford Shale and a robust hedging program to protect legacy gas assets.
Slide 1: Title and Context
The cover slide establishes the professional and industrial nature of the business. It features high-resolution photography of drilling rigs and clearly states the venue: EnerCom’s The Oil & Gas Conference 17, held August 13-14, 2012. Crucially, it displays the NYSE ticker 'PVA,' signaling to the audience that this is a publicly traded entity with established reporting requirements and market oversight.
Slide 4: Catalysts and Challenges
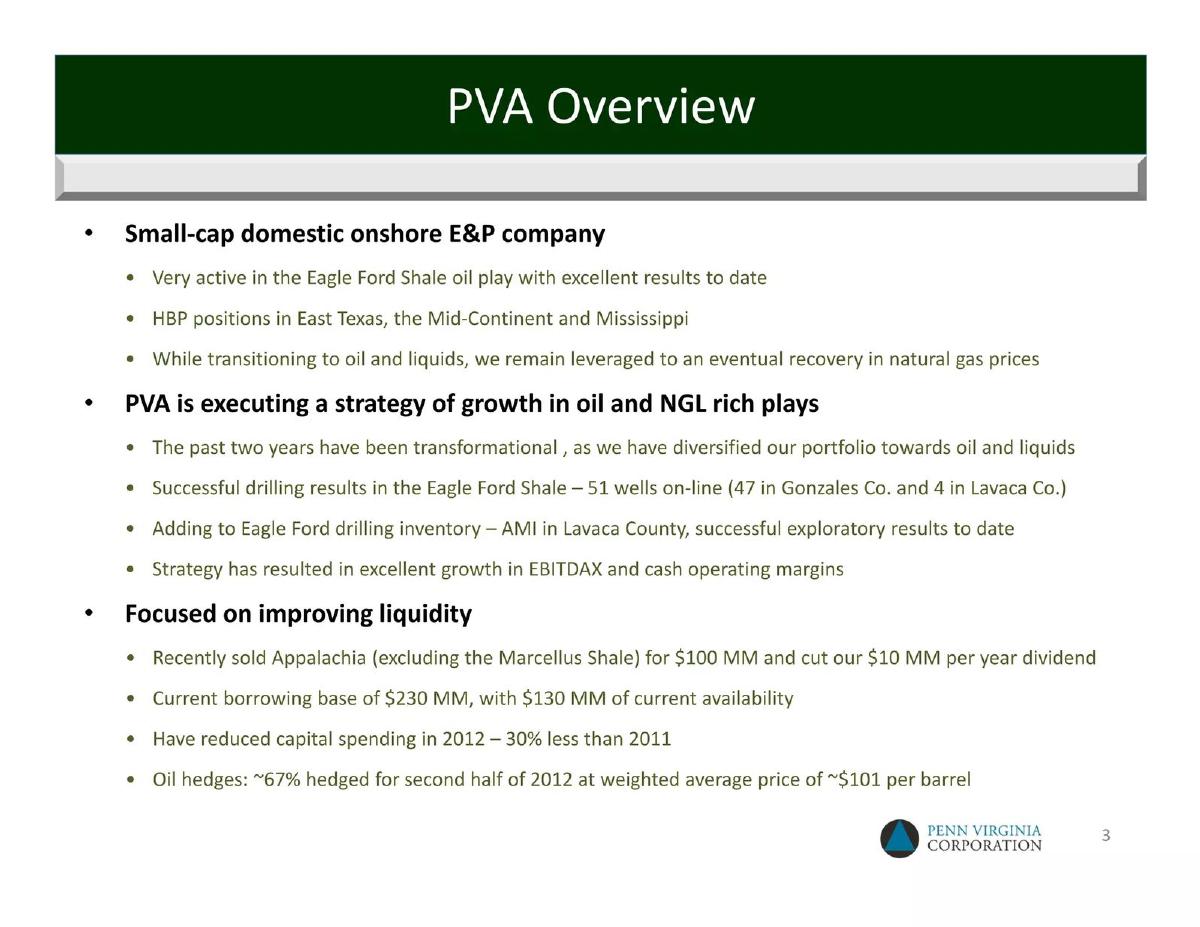
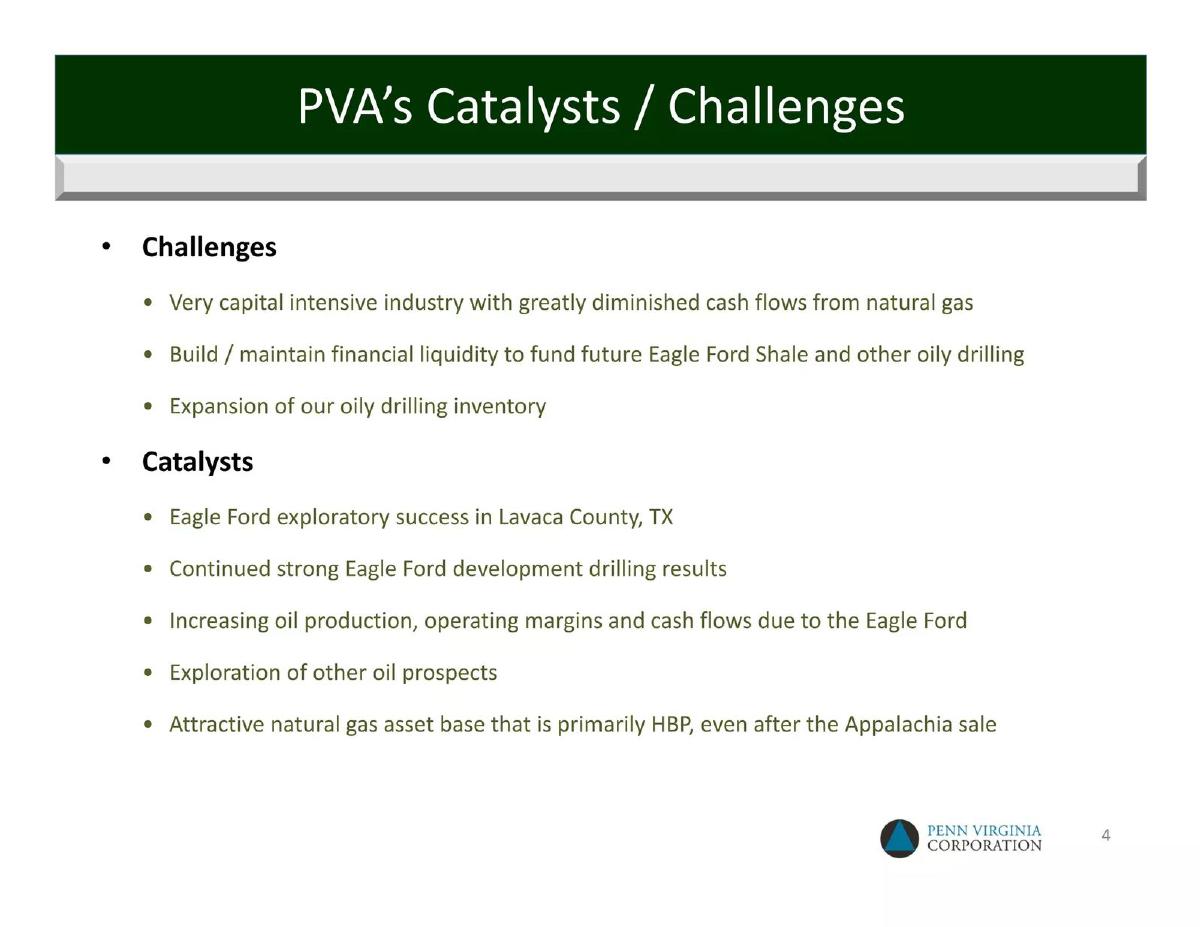
This slide serves as the 'Problem/Solution' framework for the deck. The company is remarkably candid about its 'Challenges,' listing a 'very capital intensive industry' and 'greatly diminished cash flows from natural gas.' By acknowledging these headwinds upfront, the 'Catalysts'—which focus on Eagle Ford exploratory success and increasing oil production—gain more credibility. The mention of 'Attractive natural gas asset base that is primarily HBP' (Held By Production) is a technical way of saying they own the assets without the immediate pressure to drill them to keep the leases.
Slide 7: EBITDAX and Cash Margin Growth
Financial performance is visualized through a bar and line chart covering 1Q10 through 2Q12. The chart tracks two metrics: Adjusted EBITDAX (in millions) and Gross Operating Margin per Mcfe. The data shows a clear dip in 2Q10, followed by a steady climb. The slide notes that EBITDAX increased 'significantly' since the mid-2010 strategy shift to oil. It also highlights that Eagle Ford margins were approximately $14 per Mcfe in 2Q12, providing a concrete unit economic figure to support the broader growth narrative.
Slide 10: Eagle Ford Shale Asset Mapping
This is the most data-dense slide in the deck. It combines a geological map of Gonzales and Lavaca Counties with a table of 'Notable PVA Results.' The map identifies the 'Volatile Oil Window' and the company's acreage relative to industry giants like EOG. The table lists 26 wells by name, providing Initial Production (IP) rates for each. The rates, measured in BOEPD (Barrels of Oil Equivalent Per Day), range from the Gardner 1H at 1,247 to the Munson Ranch 1H at 1,921. This level of transparency is designed to prove the quality of their acreage to sophisticated energy investors.
Slide 13: Sales Volumes by Commodity
Slide 13 visualizes the execution of the strategy mentioned on Slide 7. A stacked bar chart shows sales volumes from 1Q11 to 2Q12. The green portion of the bars (Net Oil Sales) grows exponentially, while Net Gas Sales (pink) remain relatively flat. The slide explicitly states that 'Approximately 95% of volumes are liquids,' which serves as the ultimate proof of their successful transition away from dry gas dependence.
Slide 16: Why PVA? Investment Highlights
This is the summary slide, acting as a recap of the company's value proposition. It lists seven bullet points, including a 'track record of low-cost, high-return operations' and 'current liquidity is sufficient.' It reiterates the 'successful transition from dry gas to oil' and the 'multi-year inventory' of drilling locations. This slide is designed to leave the investor with a sense of stability and future growth potential.
Slide 19: Natural Gas Hedges
In a volatile commodity market, risk mitigation is as important as production growth. Slide 19 uses a combination of bar and line charts to show how the company protected its cash flows. The 'Weighted Average Floor' for their hedges ($5.31 for 3Q12 and $5.10 for 4Q12) is shown to be significantly higher than the 'Forecast Price' ($2.59 and $2.85 respectively). This slide proves that management was proactive in protecting the balance sheet against the very gas price declines they identified as a challenge on Slide 4.
Slide 22: Contact Information
The final slide is a standard contact page, featuring the company's headquarters in Radnor, PA, a phone number, and the website. The background image of a lone drilling rig in a wooded area reinforces the company's operational focus.
What Works in This Deck
The deck is highly effective at data transparency . By listing specific well names and IP rates (Slide 10), the company moves beyond vague promises and provides verifiable operational data. The visual contrast on Slide 13, showing the growth of oil sales versus gas, is a powerful way to demonstrate that a strategy is actually being executed. Furthermore, the honesty regarding challenges (Slide 4) builds trust; the company isn't pretending the gas market is healthy, but rather explaining how they are navigating its sickness.
What Is Missing
The most notable omission in these slides is a Management Team slide . While this may have been included in the full 22-slide deck, its absence in this selection leaves a gap regarding who is actually steering the ship. There is also a lack of Unit Economics breakdown beyond the Eagle Ford margin; investors would typically want to see finding and development (F&D) costs or lease operating expenses (LOE) in more detail. Finally, there is no Environmental, Social, and Governance (ESG) mention, which, while less common in 2012, is now a staple of energy decks.
Founder Takeaways
Use 'Catalysts vs. Challenges' to frame your narrative. Founders often focus only on the positives, but acknowledging the hard truths of your industry makes your 'catalysts' feel like earned solutions rather than wishful thinking. Show, don't just tell, your pivot. If you claim to be moving from one market or product to another, use a chart like Slide 13 to show the actual volume shift over time. Granularity wins. If you have successful 'wells' (or customers, or pilots), list them. Specificity is the antidote to investor skepticism.
Frequently asked questions
- What was the primary strategic shift mentioned in the deck?
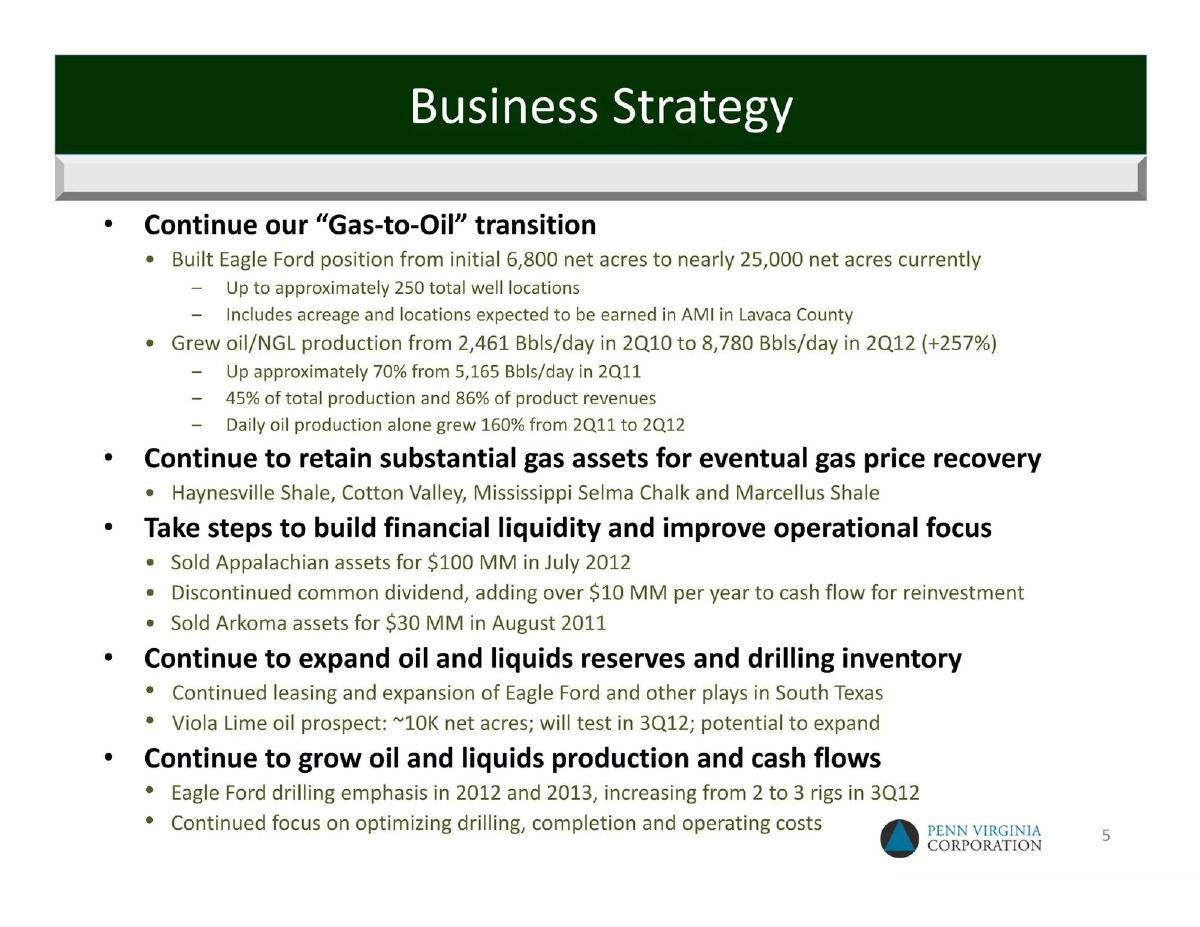
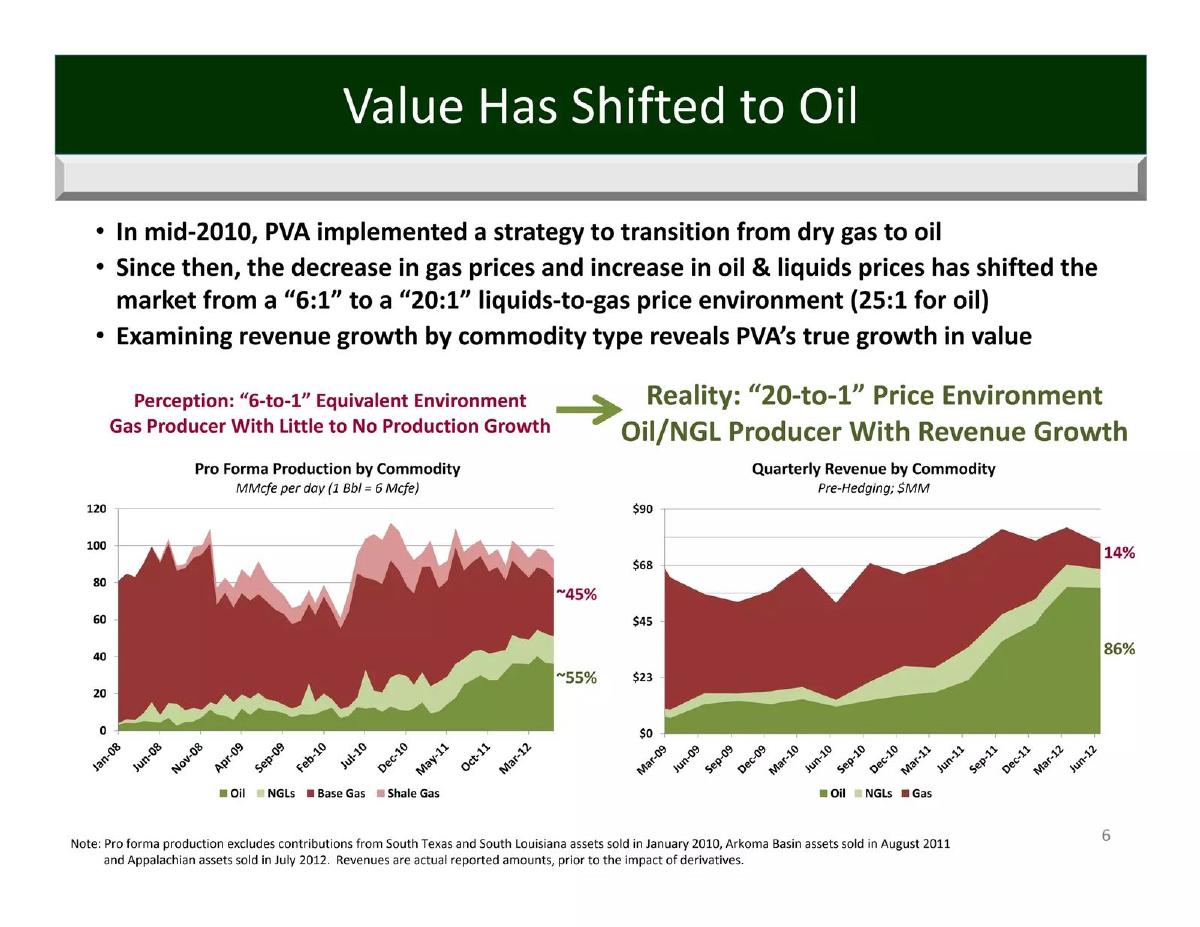
- The primary shift was a transition from 'dry gas' to 'oil and liquids.' Slide 7 notes this strategy change began in mid-2010. By 2012, the company was focusing its capital on the Eagle Ford Shale's volatile oil window to combat the greatly diminished cash flows resulting from low natural gas prices.
- How did the company handle the decline in natural gas prices?
- Penn Virginia used a two-pronged approach: halting new dry gas drilling and utilizing financial hedges. Slide 19 shows they locked in gas prices above $5.00 per MMBtu through swaps and collars, despite market forecasts sitting below $3.00, while slide 16 confirms they 'retained optionality' on gas assets without active drilling.
- What specific region drove the company's growth in 2012?
- The Eagle Ford Shale in Texas was the primary growth engine. Slide 10 highlights a 'premier acreage position' in Gonzales and Lavaca Counties. The company focused on the 'Volatile Oil Window' and reported consistent production increases in this region throughout 2011 and 2012.
- What financial metrics does the company use to show success?
- The deck relies heavily on Adjusted EBITDAX and Gross Operating Margin per Mcfe. Slide 7 demonstrates that EBITDAX increased significantly following the 2010 pivot, and Eagle Ford margins specifically reached $14 per Mcfe by the second quarter of 2012.
- Is there a clear investment 'ask' in this presentation?
- No, the provided slides do not include a specific funding request or 'ask' slide. As an NYSE-listed company (PVA) at the time, this was likely a general investor relations update intended to maintain market confidence and support liquidity rather than a venture-style pitch for a specific round of capital.