Loan Zing, an Indian school-finance startup, exported an 11-slide PowerPoint deck on 17 February 2020 and compressed it through ilovepdf.com before sending it as investordeck.pdf. Slide 1 prints the company's own logo rotated 180 degrees — upside down — which frames the deck's defining problem: nobody read it cover to cover before it went out. Slide 2 is an exploded pie chart used as a table of contents, listing a 'Budget' section that appears nowhere in the file; the deck contains no funding ask, round size, use of funds or valuation. Slide 10 is titled 'Cost & Revenue' and shows no costs —…
Key takeaways
- Loan Zing's 2020 investor deck is 11 slides built in PowerPoint 2016, compressed through ilovepdf.com and exported on 17 February 2020, pitching finance for India's private K-12 schools.
- The cover logo is printed upside down — rotated a full 180 degrees on slide 1 of a file named investordeck.pdf — which is the clearest possible evidence that nobody read the deck end to end before sending it.
- The index slide is an exploded pie chart with eight equal wedges that plots no quantity, and it promises a 'Budget' section that does not exist anywhere in the deck: there is no funding ask, round size, use of funds, valuation or runway.
- Slide 10 is titled 'Cost & Revenue' and contains no costs at all — no salaries, no cost of funds and no credit loss provision, meaning a lending business has modelled four years of revenue with a zero default rate.
- The projected economics are negative as presented: ₹53.46 Cr disbursed in year one against ₹4.5 Cr of gross revenue is an 8.4% yield, below what an unrated first-year Indian NBFC would pay for wholesale funding in 2020.
- The market slide contradicts itself twice — a ₹1,250 Cr Delhi NCR lending market against a ₹1,000 Cr NCR annual fee pool, and a $170m bottom-up figure sitting beside a $90bn all-India claim that is roughly 530 times larger and carries an asterisk with no footnote.
- The deck's strongest asset is real founder work: a 50-school primary survey in Delhi NCR, market data sourced to the Indian government's U-DISE census by report year, and three competitors named with founding years, state coverage and gross loan portfolios.
- Loan Zing never appears on its own competitor slide and never mentions NBFC licensing, RBI registration or a source of debt capital — the three questions any Indian fintech lending investor asks first.
What this deck actually is
Eleven slides, 720 x 540 points — 4:3 , built in Microsoft PowerPoint 2016 and then run through www.ilovepdf.com , whose name sits in the PDF's Producer field. Created 17 February 2020 at 09:37 UTC , filename investordeck . No author, no title, no subject in the metadata. Just under 1 MB after the compression pass, which is why the cover logo is soft at the edges.
Loan Zing is an Indian school-finance company. The pitch is that India's private K-12 schools — hundreds of thousands of them, most too small and too informal for a bank — cannot borrow, and that their annual fee receivables are a lendable asset. Around that core the deck bolts on teacher training and a student talent test. It is a genuine investor deck in intent: it has an index, a market section, a competitor section, and a four-year financial model with a total revenue line. It is the most quantitatively ambitious deck in this series in a while, and that is precisely what makes its failures instructive — this is not a founder who did no work, it is a founder who did the work and then presented it in a way that inverts its meaning.
Start with the cover, because the cover is the single most extraordinary thing in the file. Slide 1 is black, with the Loan Zing wordmark centred on it. The logo is upside down. Rotated a full 180 degrees, so the word reads backwards and inverted — you have to physically turn your screen to read the company's own name. It is not a stylistic choice; it is a placed image that was flipped and never checked. This deck was exported, compressed through an online tool, and sent to investors as investordeck.pdf with the brand upside down on page one, and nobody in the loop looked at page one.
Everything else in this teardown is a normal pitch-deck problem. This one is a different category: it is the evidence that nobody read the deck end to end before it went out , which is the same worry an investor will then carry into every number that follows.
Slide-by-slide walkthrough
Slide 1 — Cover
Black background. The LOAN ZING wordmark in orange and blue, rotated 180 degrees .
Beyond the rotation, the cover carries nothing else: no tagline, no descriptor, no date, no round, no location, no contact . A reader who receives this file does not learn what Loan Zing does until slide 5, and cannot read the company's name at all without tilting their head.
The compression tells its own small story. Running a deck through a free online PDF compressor is a sensible thing to do when a file is too big to email — but this file is under 1 MB and the pass has visibly degraded the one image on the cover. The logo is blurry and inverted. First impressions in fundraising are made by attachments, and this attachment opens on a soft, upside-down brand mark against black.
Slide 2 — Index
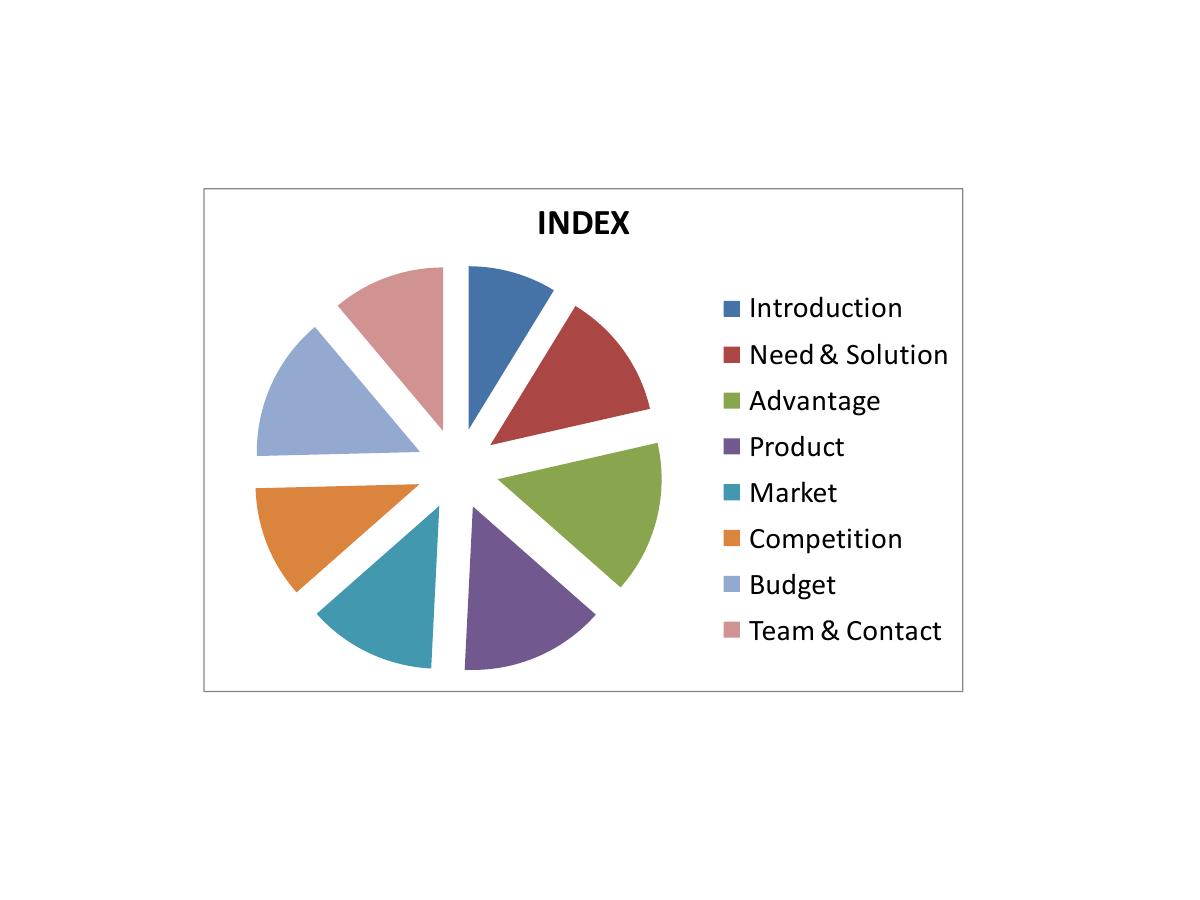
A table of contents rendered as an exploded pie chart . Eight equal wedges, colour-coded, with a legend: Introduction, Need & Solution, Advantage, Product, Market, Competition, Budget , Team & Contact.
This is a chart that plots nothing. Every wedge is the same size, so the pie encodes no proportion, no weight and no order; it is a bulleted list drawn as a circle. Charts in a deck exist to make a quantity visible at a glance, and a chart with no quantity teaches an investor to read your other charts more slowly.
The genuinely important detail is in the legend. The index promises a "Budget" section, and the deck does not contain one. There is no budget slide, no use of funds, no funding ask, no round size, no valuation, no runway — nowhere in the eleven pages. Slide 10 is titled "Cost & Revenue" and shows a revenue projection. The company published a contents page listing the one slide an investor is actually reading for, and then did not include it. That is not a design mistake; it is the deck failing at its only job.
Slide 3 — Introduction: India K-12 market
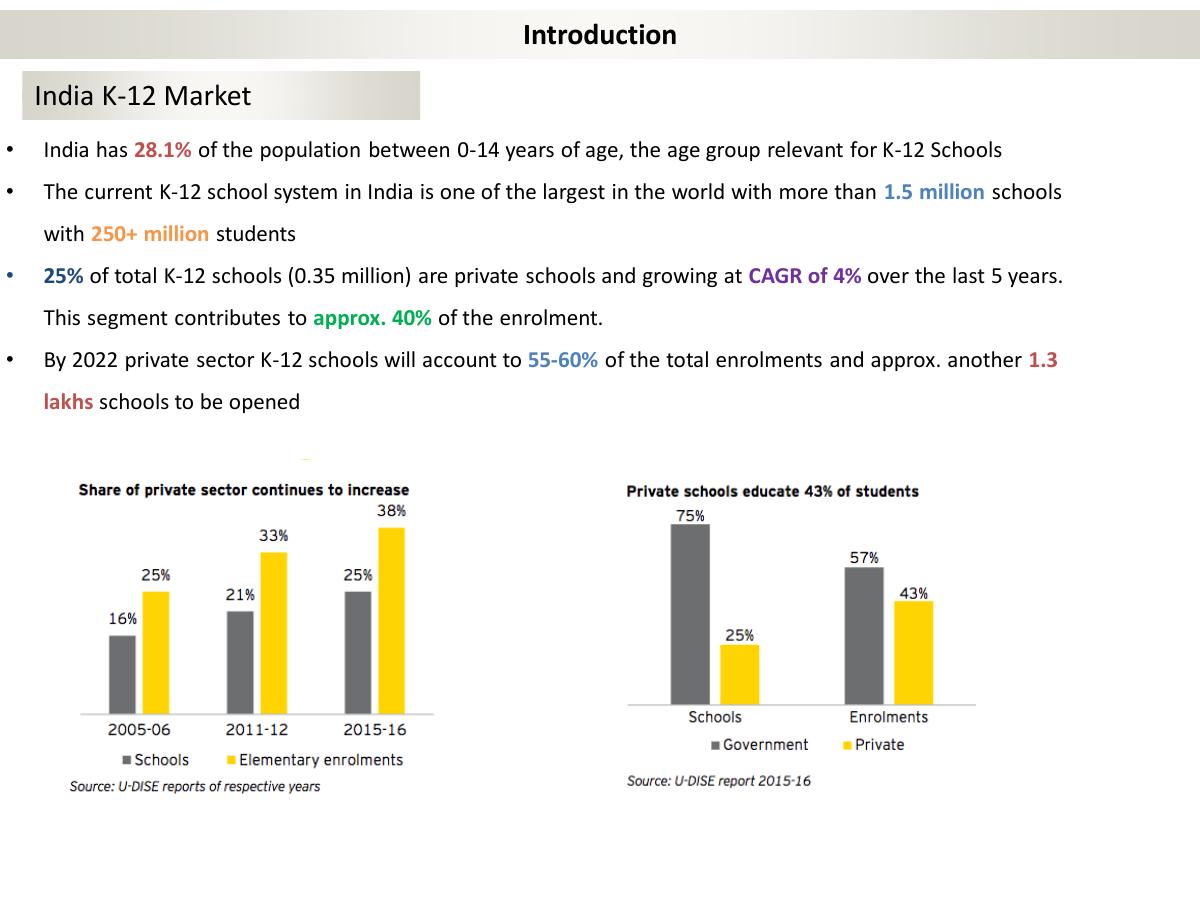
Four bullets plus two sourced charts. 28.1% of India's population is aged 0-14. More than 1.5 million schools and 250+ million students. 25% of K-12 schools (0.35 million) are private, growing at a 4% CAGR over five years, contributing about 40% of enrolment. By 2022, private schools will account for 55-60% of enrolments with another 1.3 lakh schools to open. The charts show the private share rising from 16% of schools and 25% of elementary enrolments in 2005-06 to 25% and 38% in 2015-16, and a split of 75/25 government/private schools against 57/43 enrolments — both sourced to U-DISE , the Indian government's own school census.
This is the best slide in the deck and it is genuinely strong. The figures are real, the source is named, the source is authoritative, and the two charts make one argument — the private sector is taking share — rather than decorating the page. Most decks in this series cite nothing; this one cites the national education statistics system by report year.
The flaw is that all of it is macro. Nothing here is about Loan Zing. Slide 3 would appear unchanged in a deck for a school ERP company, an edtech tutor, a uniform supplier or a chain of schools. It is the market context , and it is occupying the introduction slot where the company's own one-line thesis should be: India has 350,000 private schools that banks will not lend to, and their fee receivables are collateral. That sentence is nowhere in the deck.
Slide 4 — Introduction: spend and deficit
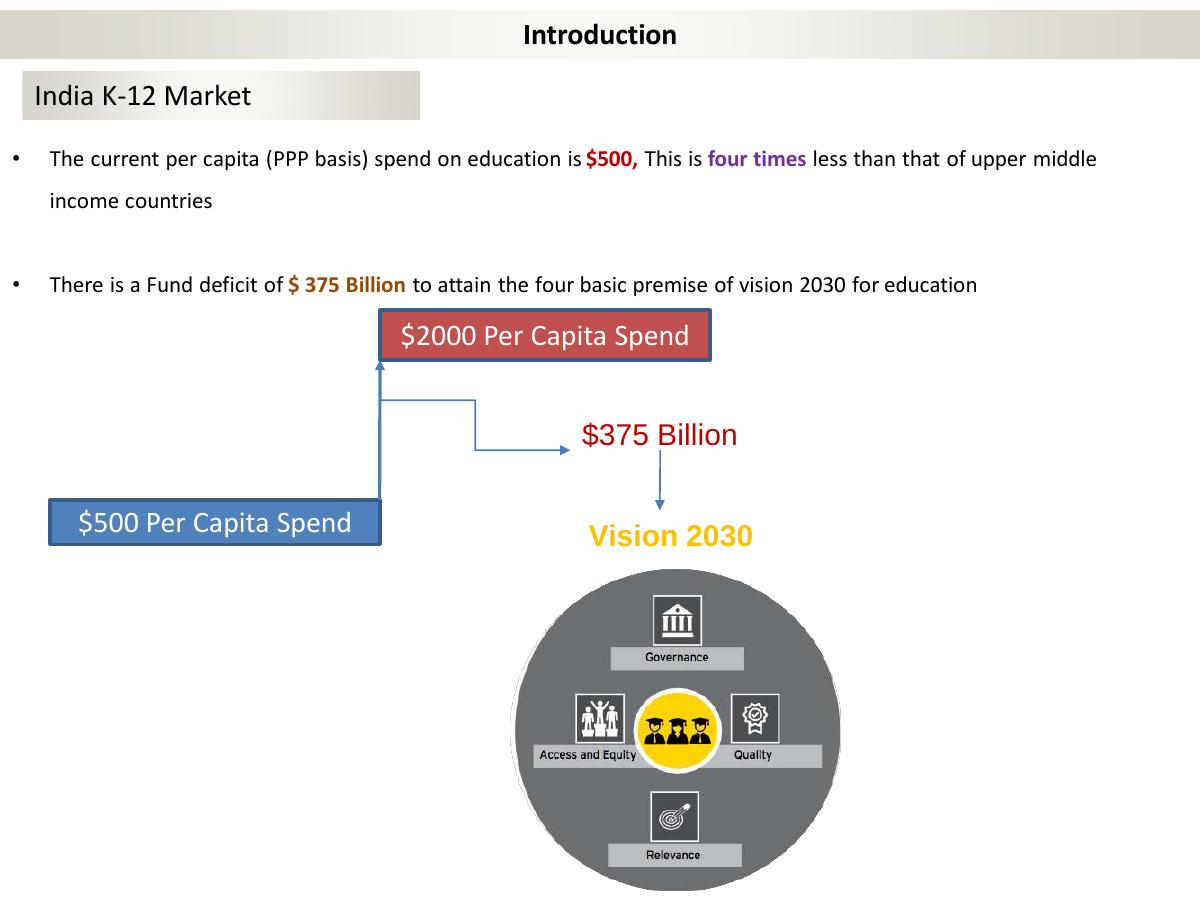
Two claims. Per-capita education spend in India (PPP) is $500, four times less than upper-middle-income countries at $2,000. And there is a $375 billion funding deficit to reach the four pillars of "Vision 2030": governance, access and equity, quality, relevance.
The $500-versus-$2,000 comparison is a clean, memorable framing and it does real work — it says the money in Indian education is thin, which is exactly the condition that creates demand for credit. But both figures here are unsourced , on the slide immediately after a slide that sourced everything to U-DISE. That inconsistency is worse than citing nothing throughout: it teaches the reader that the deck cites when it can and asserts when it cannot, and invites them to guess which is which.
The $375 billion deficit is a number that reads big and means nothing to an investor. It is a national policy gap, not an addressable market — Loan Zing is not going to lend $375 billion, and no part of that figure is revenue for anyone. Numbers of this size, used this way, have the opposite of the intended effect: an experienced reader treats them as a signal that the specific number is not available.
Slide 5 — Need, Solution and Impact
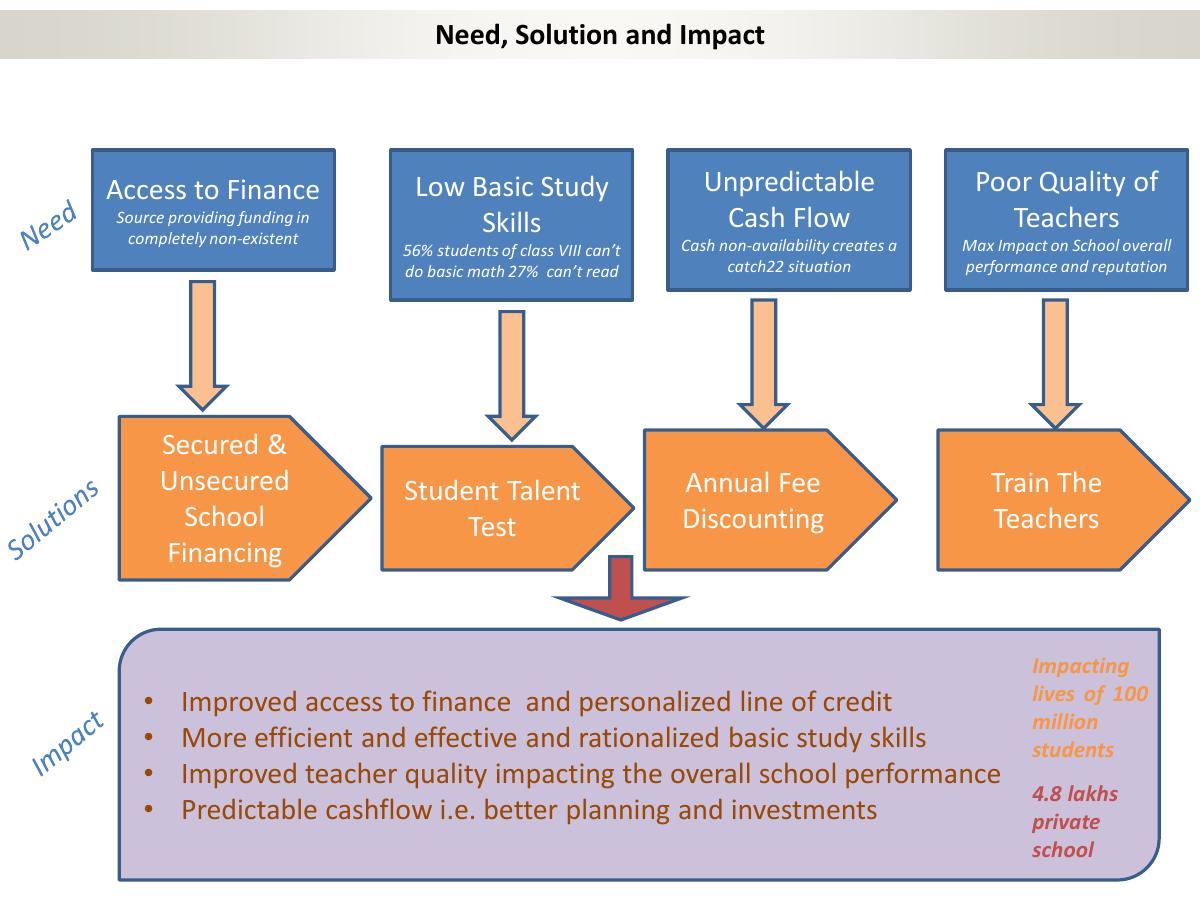
Four needs: access to finance ("sources providing funding completely non-existent"), low basic study skills (56% of class VIII students cannot do basic math, 27% cannot read), unpredictable cash flow, poor teacher quality . Four solutions: secured and unsecured school financing, student talent test, annual fee discounting, train the teachers . Then an impact list closing on "impacting lives of 100 million students" across "4.8 lakhs private school" .
The problem statement is the strongest in the deck and the learning-outcome figures are real and widely reported in India. Pairing each need with a named product is also good structure — the reader can trace the logic across the page.
But this slide is where the strategy gives itself away. Two of the four products are not financial products at all. Train The Teachers is a training business — people, curriculum, delivery. Student Talent Test is an assessment and events business. School financing is a balance-sheet business that requires capital, licensing, underwriting and collections. These are three companies with three different cost structures and three different investor profiles, and a pre-revenue team is proposing to run all of them at once. The "360° engagement" framing on the next slide presents this as a strength; an investor reads it as an absence of a decision .
The slide also contains the deck's first internal contradiction. Slide 3 states there are 0.35 million private schools . Slide 5 claims impact across 4.8 lakh — 480,000 — private schools . The same document, two slides apart, sizes its own customer base at two numbers that differ by 37%. And "impacting lives of 100 million students" against a national total of 250 million students is a claim of touching 40% of every schoolchild in India, made by a company with no customers.
Slide 6 — Advantage
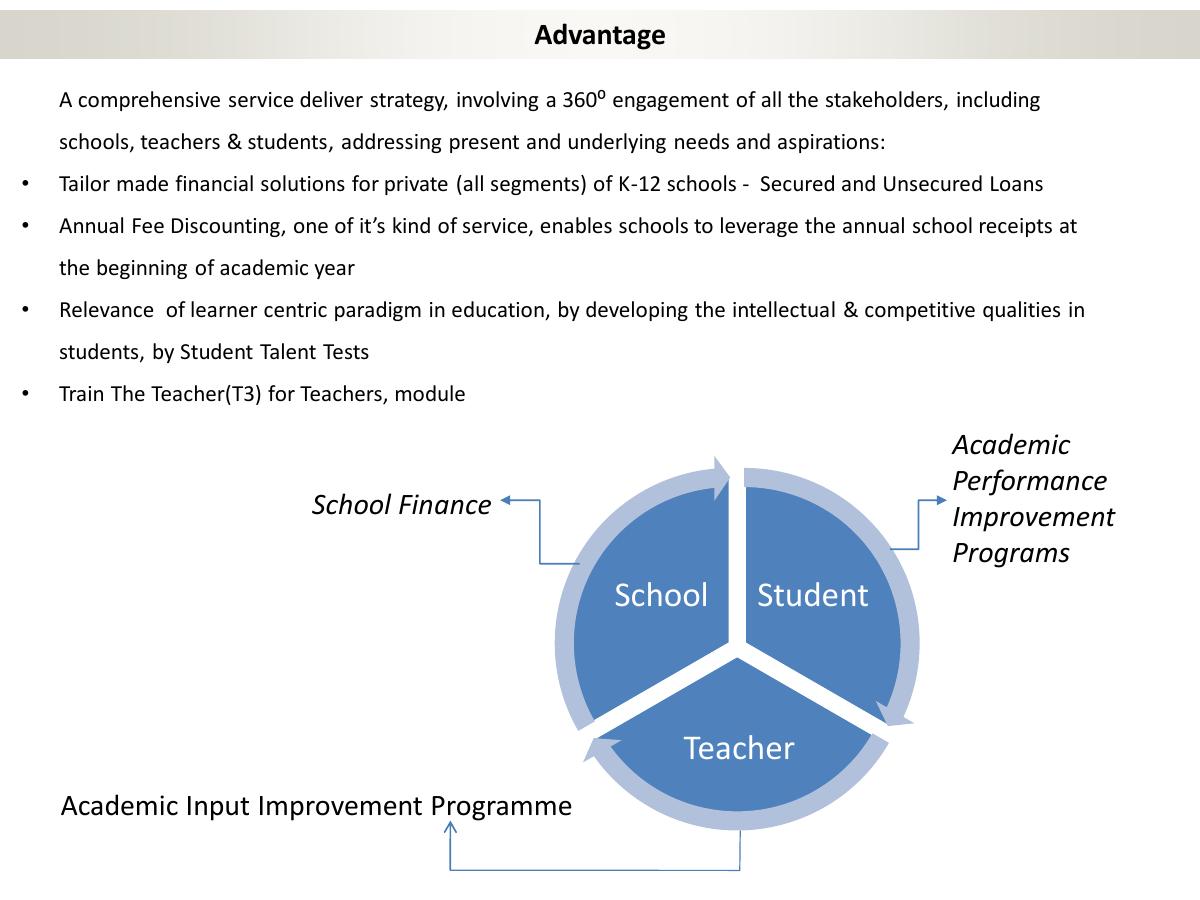
A "360° engagement of all the stakeholders" framing, four bullets, and a three-row table: School → School Finance; Student → Academic Performance Improvement Programs; Teacher → Academic Input Improvement Programme .
The one real idea on this page is Annual Fee Discounting , described as "one of its kind of service, enables schools to leverage the annual school receipts at the beginning of the academic year". That is a legitimately sharp product insight: Indian private schools collect fees in instalments across the year but incur their largest costs — salaries, infrastructure, admissions — at its start. Discounting the receivable to release cash at the beginning of the session is a real, specific, well-shaped credit product with a natural repayment source built in. It is the reason this company should exist.
The slide buries it as bullet two of four, wrapped in "comprehensive service delivery strategy" and "learner centric paradigm". The word "Advantage" heads a page that lists what the company sells rather than why it wins . Nothing here is a moat: not the products, which any NBFC can copy; not the 360° coverage, which is a burden rather than a barrier. The defensible answers were available — proprietary underwriting data on schools, fee-collection integration, a distribution channel into school owners — and none is claimed.
Slide 7 — Product
Five products defined in one line each: Annual Fee Discounting (AFD) , an 11-month unsecured working capital product against banked fee receivables; Unsecured School Financing (USF) , against both banked and cash receivables; Secured School Financing (SSF) , asset-backed; Train the Teachers (T3) ; and Student Talent Test (STT) . Illustrated with a stock photograph of pencils on a stack of coins.
The credit definitions are precise and professionally written. Distinguishing "banked" from "cash" receivables is an insider's distinction — it acknowledges that a large share of Indian private-school fee income never touches a bank account, which is exactly the underwriting problem in this sector, and the deck's product set is shaped around it. Whoever wrote these four lines understands lending.
And then the slide states no terms. No ticket size, no tenor beyond AFD's 11 months, no interest rate, no processing fee, no security cover, no eligibility criteria, no turnaround time. A lending product is its terms; without them these are category names. The pricing does exist — it appears on slide 10, three slides later, embedded in the columns of a financial model where nobody looks for it. It belonged here.
Slide 8 — Market
Primary research: 50 K-12 schools surveyed across Delhi NCR . Findings: nearly 60% need funds; 85% have existing financial commitments, majority secured; 80% of finance is at inception and provided by PSU banks . From this: the Delhi NCR market is INR 1,250 Cr across 1,200 private K-12 schools , and "the addressable market across India is approx. $90 billion" . Separately: about 25% of fees are not received on time, a cash-flow impact of about INR 250 Cr in Delhi NCR, against a total NCR school-fee market of about INR 1,000 Cr per annum.
Fifty founder-run interviews is real work and it deserves credit — most decks assert demand, this one went and measured it, in a defined geography, and reported the percentages. That is a better market slide than most seed decks contain.
Then it detonates three times. First : the NCR financing market is stated as INR 1,250 Cr while the entire annual fee pool of the same 1,200 schools is stated as INR 1,000 Cr . The lending opportunity is 125% of the revenue it would be lent against, on the same slide. One of those two numbers is wrong, and the deck does not notice.
Second : INR 1,250 Cr is roughly $170 million . The very next bullet puts the all-India addressable market at $90 billion — about 530 times the NCR figure, in a country where Delhi NCR is a single-digit percentage of private schools. The bottom-up number and the top-down number are not versions of the same estimate; they are irreconcilable, and the deck presents them consecutively as if one supports the other.
Third : the $90 billion carries an asterisk, and there is no footnote anywhere on the slide . So does the 25% fee-delay figure. Two asterisks, no sources — on the slide that opens by boasting about primary research.
The honest version of this page is much stronger and needs no new work: we surveyed 50 schools; 60% need funds; that implies roughly ₹X Cr of demand across 1,200 NCR schools; scaled by the U-DISE private-school count, the national opportunity is ₹Y . The survey is good enough to carry the slide on its own. The $90 billion is the only thing on it that an investor will remember, and it is the only thing on it that is not evidenced.
Slide 9 — Competitor ecosystem
Three named competitors with logos and figures. Varthana : Bangalore, affordable private schools, started 2013, gross loan portfolio $35 million. Indian School Finance Company : Delhi, lends across the education sector, started 2008, 15 states, $44 million portfolio. Shiksha Finance : Chennai, affordable schools and students, started 2016, 3 states, INR 32 Cr. Plus "others — very sporadic lending by banks and other NBFCs".
This is a properly researched competition slide, and it is rare. Three real firms, correctly described, with founding years, geographic footprints and portfolio sizes — the single most relevant metric in lending. No "we have no competitors", no self-scored grid of ticks. The founder went and found out what the field looks like.
The omission is Loan Zing. The company does not appear on its own competitor slide. There is no row for it, no differentiating axis, no statement of what it does that Varthana does not. Read as written, the page is an argument against the investment: here are three funded, licensed, multi-state incumbents with seven and eight-figure loan books, one of them operating in Delhi since 2008 — and no reason given why a new entrant with no book takes share from them.
The reason was available. Annual Fee Discounting is the wedge : the incumbents listed here lend against assets and infrastructure over multi-year tenors, while AFD is an 11-month working-capital product against receivables — a different tenor, a different risk, a different repayment source. One sentence stating that turns this slide from a threat list into a positioning argument.
Slide 10 — Cost & Revenue
A single dense table projecting the Annual Fee Discounting portfolio across FY2020-21 to FY2023-24 . Target schools grow 250 → 287 → 330 → 375 ; students at an average of 270 per school; average annual fee flat at INR 36,000 ; parents with delayed payments at 25% ; conversion for onboarding rising 40% → 43% → 47% → 50% ; schools onboarded 100 → 123 → 155 → 188 . Gross fee receivables reach INR 972,000,000 in year one, discounted at 55% RTV to INR 534,600,000 , earning 1.5% processing charges , 12% interest and commissions — for gross revenue of INR 45,005,549 in FY21, rising to INR 84,385,405 by FY24. Four-year total: INR 254,735,909 .
The model is internally traceable in places, and that deserves saying: 100 schools x 270 students x ₹36,000 does give ₹97.2 Cr of receivables, 55% of that is ₹53.46 Cr, and 1.5% of that is the ₹80.19 lakh processing line. A reader can follow the arithmetic. Most projection slides in this series cannot survive that test.
Now the four things an investor will find in about ninety seconds.
1. The slide is titled "Cost & Revenue" and contains no costs. Not one. No salaries, no branch or origination cost, no technology, no collections, no marketing — and, fatally for a lender, no cost of funds and no credit loss provision . There is no NPA assumption anywhere in the deck. A school-finance company projecting four years of revenue with a zero default rate is telling an investor it has not modelled the only risk in its business.
2. The economics are negative as presented. Year one disburses ₹53.46 Cr and earns ₹4.50 Cr — a gross yield of about 8.4% on the money lent. An unrated, first-year Indian NBFC in 2020 was borrowing wholesale in the low-to-mid teens. Before a single rupee of salary or a single default, the spread is negative . Either the intended cost of capital is far lower than the market would give this company, or the model has not been run against a funding cost at all — and because there is no cost line, the reader cannot tell which.
3. The stated interest rate does not reconcile. The column header says 12% , and 12% of ₹53.46 Cr over the product's own 11-month tenor is roughly ₹5.9 Cr . The table shows ₹3.54 Cr — an effective yield of about 6.6% . There may be a reducing-balance or part-year assumption behind it, but it is not stated, so the deck's headline rate and the deck's own revenue line disagree by nearly half.
4. The growth is not venture growth. Revenue rises from ₹4.5 Cr to ₹8.4 Cr over four years — roughly 23% a year , not quite doubling across the whole plan. Total four-year revenue is about $3.4 million . That is a sound small lending business and it is not a curve that clears an equity investor's return threshold; the founder appears not to have noticed that their own model says so. Two of the drivers are also unexamined: average annual fee is held flat at ₹36,000 for four years in an economy running 4-6% inflation, and school onboarding conversion improves from 40% to 50% with no reason given. Meanwhile the "% of parents with delayed fee payments" column sits in the table without feeding any calculation in it.
Slide 11 — Team & Contact
Two names: Ankit Shyam and Abhishek Srivastava . Under each, "Contact Information" and a LinkedIn URL. Then "Thank You!"
No photographs, no titles, no roles, no bios, no prior employers, no years of experience, no email address, no phone number, no company website, no office location. In a business whose entire risk is underwriting quality and access to debt capital, the team slide does not say whether either founder has ever underwritten a loan, worked at an NBFC, or raised a credit line. Lending is an experience business , and the deck offers no evidence of experience.
The two links are also not equivalent. The first is a personal profile. The second — linkedin.com/in/loan-zing-67b519171 — is the company presented as a personal profile, listed as an individual founder's contact information. Whatever the intent, the effect on a reader who clicks both is that only one of the two named people is actually reachable.
And the deck ends here, with no ask. The index promised a Budget. Slide 11 says "Thank You!"
What this deck does better than most startup pitch decks
It cites a government data source by report year. U-DISE, named twice, with the correct years. Almost no deck in this series sources its market data at all. · It contains real primary research. Fifty schools surveyed in a defined geography, with the findings reported as percentages. That is founder work you cannot fake. · The competitor slide is honest and specific. Three named lenders with founding years, state coverage and gross loan portfolios — including two that are larger and older than the company pitching. · The product definitions are written by someone who understands credit. Distinguishing banked from cash receivables, and secured from unsecured against them, is a genuine insider distinction. · Annual Fee Discounting is a real product insight. Schools collect fees across the year and spend at the start of it; financing that mismatch is a well-shaped credit product with its own repayment source. · The model is traceable. Schools x students x fee x discount rate x fee percentage reconciles. A reader can check the arithmetic, which is more than most projection slides allow. · The needs-to-products mapping is legible. Every stated need has a named product attached to it on the same page.
Where this deck would fail in an investor meeting
The logo on the cover is upside down. Page one, rotated 180 degrees, in a file named investordeck . · The index promises a "Budget" section that does not exist. No ask, no round size, no use of funds, no valuation, no runway anywhere in eleven slides. · The "Cost & Revenue" slide has no costs — including no cost of funds and no credit loss provision, in a lending business. · The unit economics are negative as shown : ₹53.46 Cr disbursed for ₹4.5 Cr of revenue is an 8.4% gross yield against a double-digit cost of capital. · The interest line contradicts the stated rate — a 12% header producing an effective 6.6%, unexplained. · The market numbers contradict each other : a ₹1,250 Cr NCR lending market against a ₹1,000 Cr NCR fee pool, and a $170m bottom-up figure beside a $90bn top-down one. · Two asterisks with no footnotes , on the slide that leads with primary research. · The private-school count contradicts itself : 0.35 million on slide 3, 4.8 lakh on slide 5. · Five products across three unrelated businesses — lending, teacher training and student assessment — before a single customer. · No traction of any kind. No schools onboarded, no loans disbursed, no pilot, no LOI, no repayment history. · No mention of an NBFC licence, RBI registration or lending partner — the regulatory gate the entire business must pass through in India. · No named source of debt capital. The deck never explains where the money it lends comes from. · The company is absent from its own competitor slide , leaving three funded incumbents unanswered. · The team slide has no roles, no backgrounds and no email , and one of its two contact links is a company profile.
What a lending deck needs that a software deck does not
Where does the lent capital come from? Never mentioned Named debt lines, cost of funds, leverage target
What is the spread? 8.4% gross yield, no funding cost shown Yield minus cost of funds minus credit cost = net interest margin
What happens when borrowers default? No NPA line anywhere Expected loss rate, provisioning policy, collateral recovery
Are you allowed to do this? No licence or regulator mentioned NBFC registration status, or the named partner lending on your behalf
How do you underwrite? Not described Data used, decision process, approval rate, why it beats a bank's
What does the book look like? No portfolio exists Disbursed to date, outstanding, tenor mix, vintage performance
What are the product terms? Category names only; pricing hidden in the model Ticket, tenor, rate, fees, security, eligibility — on the product slide
What is the ask? Listed in the index, absent from the deck Equity amount, what it buys, and the debt it unlocks
How you would rebuild this deck in an afternoon
Rotate the logo. Then add a tagline, a date and a city to the cover, and re-export without the compression pass. · Delete the pie chart. Replace slide 2 with the company's one-sentence thesis: India has ~350,000 private schools banks will not lend to, and their fee receivables are collateral. · Cut to one product. Lead with Annual Fee Discounting, state its terms on the product slide — ticket, tenor, rate, fee, security, turnaround — and move T3 and STT to a single "later" line, or out of the deck entirely. · Fix the market slide to one method. Keep the 50-school survey, build NCR bottom-up from it, then scale by the U-DISE private-school count for the national figure. Delete the $90 billion. Add the two missing footnotes. · Reconcile the school count — 0.35 million or 4.8 lakh — and use the same number everywhere. · Put Loan Zing on the competitor slide , with one axis it wins: tenor. Varthana and ISFC lend long against assets; AFD is 11-month working capital against receivables. · Rebuild slide 10 as a real P&L. Add cost of funds, opex, and an explicit NPA assumption, and show net interest margin per rupee lent. If the spread is negative at a realistic cost of capital, the pricing changes before the deck goes out. · Fix the 12% interest line so the header rate and the modelled amount agree, or state the tenor assumption in the column. · Add a regulatory slide. NBFC status, application stage, or the licensed partner whose balance sheet the loans sit on. This is the first question a fintech investor asks in India and the deck cannot answer it. · Add the Budget slide the index already promises. Equity amount, use of funds, the debt line it unlocks, months of runway — plus an email address on the team slide.
The transferable lesson
Loan Zing's deck is a study in how real work gets destroyed by presentation . This founder surveyed fifty schools by hand. They pulled the national education census and cited it by report year. They researched three competitors down to their gross loan portfolios. They built a four-year model whose arithmetic actually reconciles. That is more genuine diligence than most seed decks contain — and an investor's overwhelming impression of the file is a logo printed upside down, a contents page promising a Budget that never arrives, a market slide whose two numbers differ by 530 times, and a slide called "Cost & Revenue" with no costs on it.
The pattern beneath every one of those is the same: nobody read the deck as a stranger would . Every error here is visible on a single cover-to-cover pass by someone who did not build it. The upside-down logo takes one second to catch. The missing Budget takes comparing the index to the page count. The ₹1,250 Cr against ₹1,000 Cr takes reading one slide twice. The negative spread takes dividing two numbers the founder already typed.
So the lesson for your own deck is not about design or storytelling. It is procedural. Before you send it, read it once as an outsider, in order, with a pen — and once more asking, of every number, does this agree with the other numbers in this file? Investors do not have your context, they will not reconcile your figures for you, and they will not turn the page upside down to read your name. A deck with real work behind it and no final read-through is the most expensive kind of deck there is, because the reader never learns the work was done.
Frequently asked questions
- What is Loan Zing?
- Loan Zing is an Indian school-finance startup whose February 2020 investor deck pitches secured and unsecured lending to private K-12 schools, plus an Annual Fee Discounting product that advances cash against a school's annual fee receivables. The deck also proposes a teacher-training programme and a student talent test, and reports no customers, loans disbursed or revenue to date.
- Is the Loan Zing deck a good pitch deck for investors?
- It contains unusually good research and presents it badly. The market data is sourced to India's U-DISE census, the founder surveyed 50 schools, and three competitors are named with their loan-book sizes. But the cover logo is upside down, the index promises a Budget section the deck never delivers, the 'Cost & Revenue' slide has no costs, and there is no funding ask anywhere.
- Which slides from the Loan Zing deck should founders copy?
- The competitor slide and the primary research. Naming Varthana, Indian School Finance Company and Shiksha Finance with their founding years, state coverage and gross loan portfolios is far more credible than a checkbox grid. So is opening a market slide with 'we surveyed 50 K-12 schools across Delhi NCR' and reporting the actual percentages that came back.
- What is the biggest mistake in the Loan Zing pitch deck?
- Beyond the upside-down cover, it is the slide titled 'Cost & Revenue' that shows no costs — no operating expense, no cost of funds and no credit loss provision. For a lender, the spread between what you pay for capital and what you earn on it is the business, and the deck's own numbers imply an 8.4% gross yield against a double-digit funding cost.
- What should a fintech lending pitch deck include that a software deck does not?
- Where the lent capital comes from and what it costs, the expected credit loss rate and provisioning policy, the resulting net interest margin, the regulatory position (an NBFC licence in India, or a named licensed lending partner), the underwriting method, and portfolio metrics such as amount disbursed, outstanding book and vintage repayment performance.
- What would make an investor reject the Loan Zing deck?
- No traction, no funding ask, no costs in the financial model, no default assumption, no licensing or capital source for a lending business, market figures that contradict each other by a factor of 530, a private-school count that differs between slide 3 and slide 5, five products spanning three unrelated businesses, and a team slide with no roles, no experience and no email address.