Apollo Medical Holdings (ApolloMed) utilized this August 2015 investor presentation to signal a major transition from the OTC market to a pending NASDAQ uplisting. The deck centers on a 'full-risk' integrated healthcare model, leveraging an Accountable Care Organization (ACO) and Independent Physician Association (IPA) to manage over 40,000 patients. By focusing on the rapidly expanding Medicare and Medicaid demographics, ApolloMed demonstrated a 200% year-over-year revenue jump, reaching $33 million in FY2015. The core value proposition rests on superior utilization metrics, such as a 543 ho…
Key takeaways
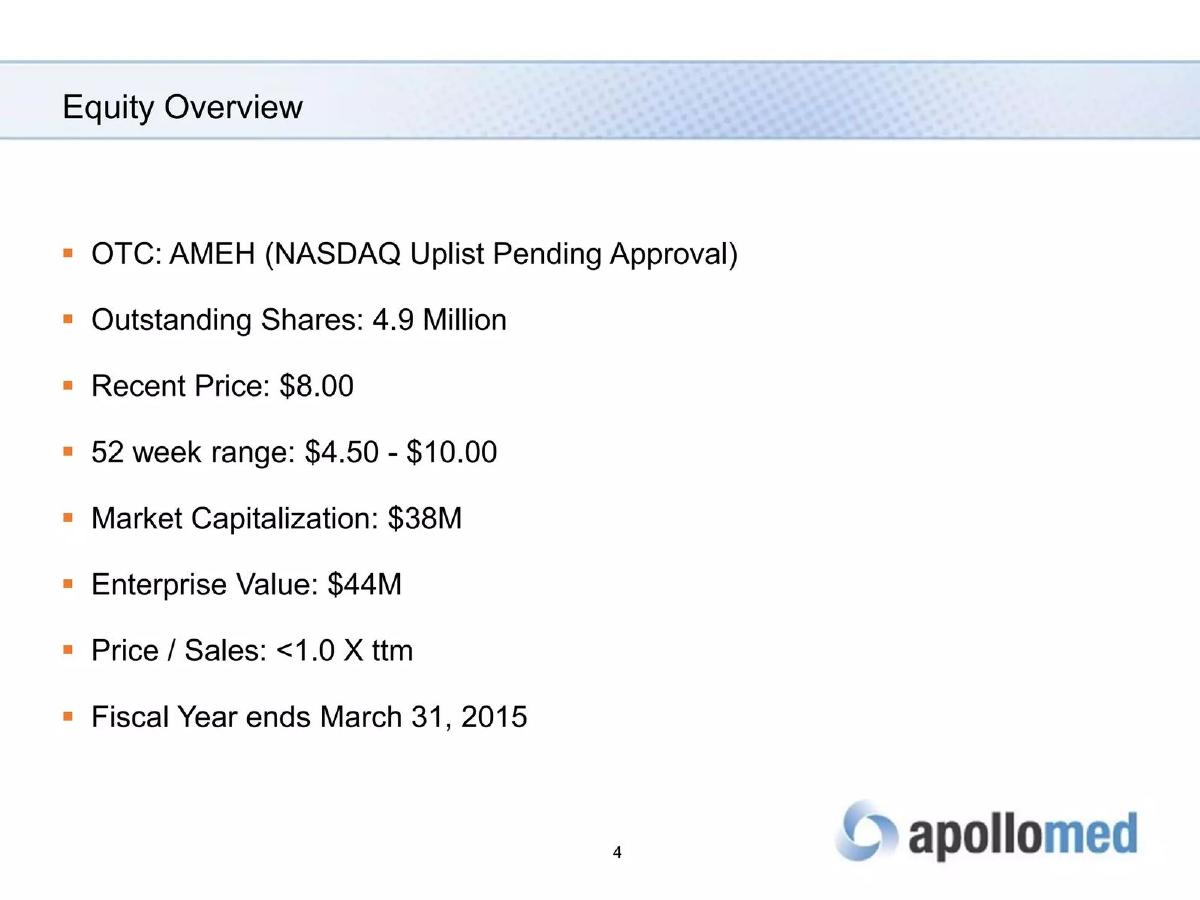
- The company was trading on the OTC under ticker AMEH with a pending NASDAQ uplist as of August 2015 (Slide 4).
- ApolloMed operates a multi-faceted model including an ACO with 709 physicians and an IPA with 150+ primary care physicians (Slide 7).
- The business targets the 'Baby Boomer' demographic, citing a combined Medicare and Medicaid spend of $322 billion for dual-eligible members (Slide 10).
- ApolloMed claims significant outperformance in hospital utilization, reporting 733 senior inpatient bed days per 1,000 patients versus 1,706 for Medicare FFS (Slide 13).
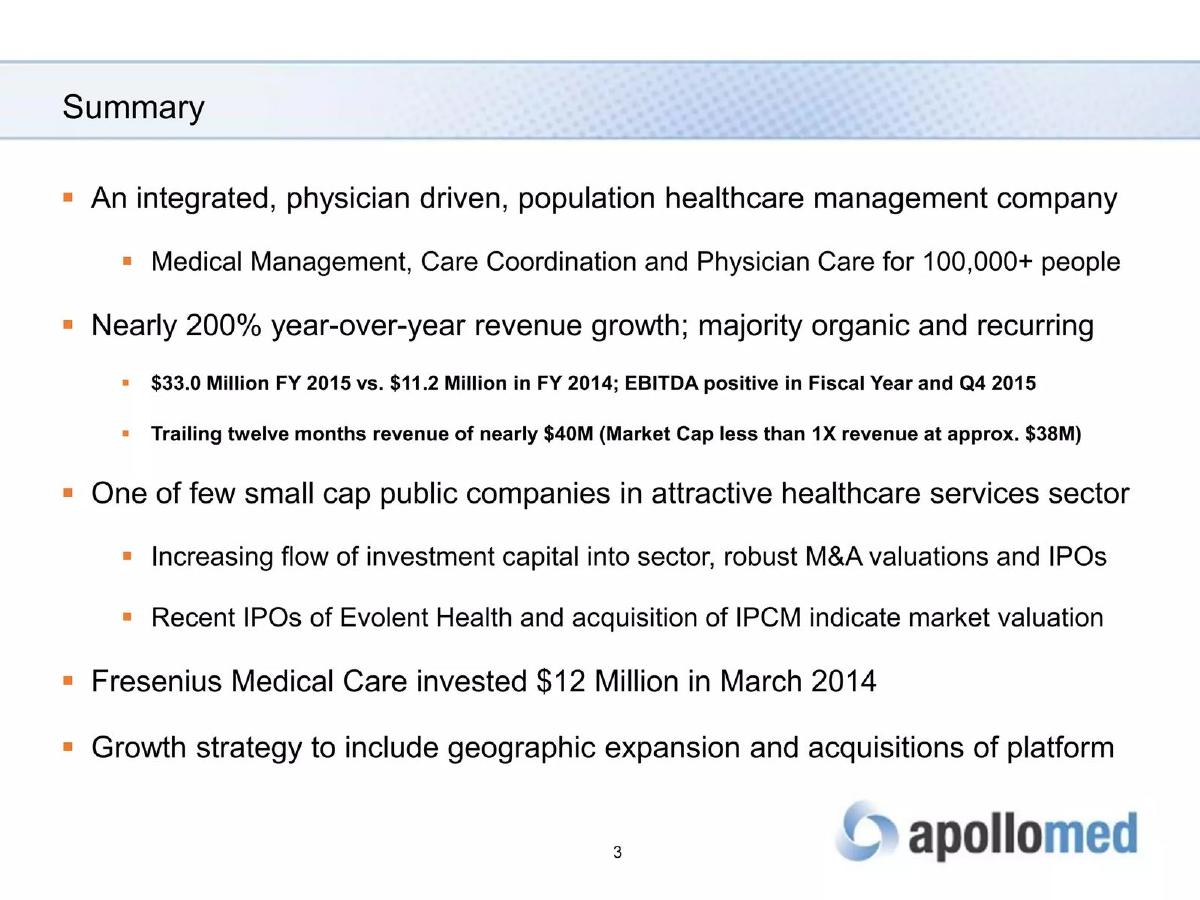
- Revenue grew from approximately $12 million in FY2014 to $33 million in FY2015, a nearly 200% increase (Slide 16).
- The leadership team features deep institutional experience, including a CFO who previously served as CEO of USC University Hospital (Slide 19).
- The company reported a market capitalization of $38M and an enterprise value of $44M at the time of the presentation (Slide 22).
- The deck omits a clear 'Ask' or funding requirement, focusing instead on shareholder overview and public market metrics (Slide 22).
Apollo Medical Holdings: A Public Market Transition Deck
The August 2015 investor presentation for Apollo Medical Holdings (ApolloMed) serves as a bridge between its status as an OTC-traded company and its ambitions for a NASDAQ uplisting. Unlike a seed-stage startup deck that focuses on a single product, this presentation outlines a complex, integrated healthcare ecosystem already operating at significant scale. The narrative is built on three pillars: the massive tailwinds of the aging U.S. population, the clinical efficiency of their 'full-risk' model, and a sharp upward inflection in revenue.
Slide 1: Title Slide
The deck opens with a standard corporate title slide. It identifies the company as Apollo Medical Holdings, Inc. and dates the presentation to August 2015. The tagline, "Integrated Healthcare for Better Patient Outcomes," immediately establishes the company's value proposition as a clinical-first organization rather than just a financial vehicle.
Slide 4: Equity Overview
This slide functions as a snapshot for public market investors. It lists the OTC ticker (AMEH) and explicitly mentions that a NASDAQ uplisting is pending approval. Key metrics provided include 4.9 million outstanding shares, a recent price of $8.00, and a market capitalization of $38M. The Enterprise Value is stated at $44M. Notably, the slide highlights a Price/Sales ratio of less than 1.0x TTM, suggesting to investors that the company may be undervalued relative to its revenue growth.
Slide 7: The ApolloMed Model
Slide 7 is the core operational slide. It illustrates how the company integrates various healthcare components. On the left, it details the ApolloMed ACO (709 physicians, 30,000 Medicare patients) and the Maverick Medical Group IPA (150+ PCPs, 400+ specialists, 10,000+ patients). On the right, it lists hospital physician services serving 28+ facilities, care clinics, and palliative care (home health and hospice). The central graphic emphasizes that the patient is at the heart of this "Clinical Expertise" circle, showing a flow between hospitals, physicians, and payers.
Slide 10: Senior Market Growth
This slide provides the macro-economic justification for the business. Using two charts, it shows the projected growth in spending and population for both Medicare and Medicaid through 2022. It notes that Baby Boomers started reaching age 65 in 2010, making this the "fastest growing demographic segment." The slide also highlights a specific high-value niche: the 9 million dual-eligible members (those qualifying for both Medicare and Medicaid) who account for $322 billion in spending.
Slide 13: Hospitalization Utilization Metrics
To prove their model works, ApolloMed presents comparative data on slide 13. The bar charts show a clear advantage in efficiency. Their "Senior Inpatient Bed Days/1,000 Patients" stands at 733, compared to 864 for DaVita HCP and a staggering 1,706 for Medicare Fee-For-Service. They also show a Medicare Average Length of Stay (LOS) of 3.3 days versus a 6.8-day benchmark. These metrics are critical for a company operating in a capitated or 'full-risk' environment where lower utilization directly correlates to higher margins.
Slide 16: Annual Revenue Growth
Slide 16 is the "hockey stick" moment of the deck. It shows annual revenue for FY2013, FY2014, and FY2015. The jump from FY2014 to FY2015 is the most dramatic, rising from approximately $12 million to $33 million. The slide header claims a "nearly 200% Y/Y" jump. This visual evidence of scaling is intended to validate the company's aggressive expansion and the effectiveness of its integrated model in capturing market share.
Slide 19: Leadership Team
The leadership slide focuses on medical and administrative pedigree. CEO Warren Hosseinion, M.D., and CMO Adrian Vazquez, M.D., are both co-founders with medical degrees from Georgetown and UC Irvine, respectively. The inclusion of Mitchell Creem as CFO is a significant signal of institutional readiness, given his past roles as CEO and CFO of major university hospital systems (USC and UCLA). The team is rounded out by veterans from HealthCare Partners and Cigna, suggesting a balance of clinical knowledge and managed care experience.
Slide 22: Shareholder Overview
The final slide in this selection repeats the data from Slide 4. In a 22-slide deck, repeating the equity overview at the end reinforces the investment opportunity for public market participants. It restates the $38M market cap and the pending NASDAQ uplist, serving as a final reminder of the company's current valuation and upcoming liquidity event.
What ApolloMed Does Well
The deck excels at demonstrating comparative efficiency . In the healthcare space, claiming to be "better" is insufficient; you must prove it with utilization data. Slide 13 is the strongest slide in the deck because it uses industry-standard benchmarks (Medicare FFS and DaVita HCP) to show that ApolloMed’s model actually reduces bed days and length of stay. This is the primary driver of profitability in value-based care.
Furthermore, the revenue transparency on slide 16 is compelling. By showing three years of data, they demonstrate that the 2015 surge wasn't a fluke but an acceleration of an existing trend. The leadership slide also does a heavy lift in establishing institutional credibility . For a company managing tens of thousands of lives and millions in revenue, having a CFO who has run major university hospitals is a significant de-risking factor for investors.
What is Missing from the Deck
The most glaring omission for a fundraising teardown is the specific 'Ask' and Use of Funds . Because this is an investor presentation for a company already trading publicly (OTC), it functions more as a general update than a targeted pitch for a specific round of capital. There is no mention of how much money they are looking to raise or exactly how that capital will be deployed to further the NASDAQ uplisting or geographic expansion.
Additionally, the deck lacks unit economics . While we see total revenue growth and utilization efficiency, we don't see the margin per patient or the cost of acquisition for new physician groups. In a capitated model, understanding the spread between the per-member-per-month (PMPM) payment and the cost of care is vital for assessing long-term sustainability. The deck also omits a competitive landscape slide beyond the utilization benchmarks; it does not address other emerging ACOs or IPAs that might be vying for the same physician groups.
What Founders Should Copy
Founders in the healthcare or enterprise space should emulate ApolloMed’s use of third-party benchmarks . Comparing your internal metrics to a well-known industry standard (like Medicare FFS) provides instant context that a standalone number cannot. If you say your "utilization is low," it means nothing. If you show it is 50% lower than the national average, you have a compelling story.
Another takeaway is the clear segmentation of the business model . Slide 7 does a great job of breaking down a complex organization into digestible parts (ACO, IPA, Hospitalists, Clinics). For founders building multi-sided platforms or complex service-plus-software businesses, using a flow chart that centers on the customer (or patient) while showing how various business units interact is a highly effective way to communicate scale without causing confusion.
Final Thoughts
Apollo Medical Holdings' 2015 deck is a professional, data-driven presentation that successfully argues for the company's readiness for a major exchange. It leans heavily on the "Value-Based Care" trend before that term became a common buzzword, focusing on the hard metrics of utilization and revenue growth. While it lacks the narrative flair of a Silicon Valley venture deck, its reliance on clinical outcomes and audited-style financial growth makes it a strong example of a late-stage or public-market investor communication tool.
Frequently asked questions
- What is ApolloMed's core business model according to the deck?
- ApolloMed uses an integrated healthcare model that combines an Accountable Care Organization (ACO), an Independent Physician Association (IPA), and hospitalist services. According to slide 7, they manage nearly 30,000 Medicare patients through their ACO and over 10,000 patients through their IPA (Maverick Medical Group). This allows them to manage clinical expertise across primary care, specialty care, and palliative services.
- How does ApolloMed demonstrate its clinical effectiveness?
- The company uses hospitalization utilization metrics to prove efficiency. Slide 13 shows that ApolloMed hospitalists achieve 733 senior inpatient bed days per 1,000 patients, which is significantly lower than the Medicare Fee-For-Service (FFS) average of 1,706. They also report a lower Medicare average length of stay (3.3 days) compared to the medical staff average (6.8 days).
- What market trends is the company capitalizing on?
- ApolloMed is targeting the aging U.S. population. Slide 10 highlights that Baby Boomers began reaching age 65 in 2010, driving growth in the Medicare and Medicaid markets. They specifically point to the 9 million 'dual eligible' members who represent a combined spend of $322 billion, suggesting a massive total addressable market for integrated care.
- What are the key financial highlights mentioned in the presentation?
- The primary financial highlight is the revenue trajectory shown on slide 16. Annual revenue jumped from roughly $12 million in FY2014 to $33 million in FY2015. Additionally, slide 4 notes a Price/Sales ratio of less than 1.0x TTM, with a market capitalization of $38 million and 4.9 million shares outstanding.
- Who leads the company and what is their background?
- The leadership team, detailed on slide 19, includes Co-founder and CEO Warren Hosseinion, M.D., and CFO Mitchell Creem. Creem’s background is particularly notable, having served as the CEO of USC University Hospital and CFO of UCLA Medical Center. Other leaders bring experience from HealthCare Partners and Cigna Health Plan.