One Mobility is a Finnish startup tackling the inefficiencies of the kids' bicycle market—specifically high costs, storage issues, and the frequency with which children outgrow their equipment. Their solution is a subscription-based platform offering premium bikes (like Frog and Woom) with flexible 3, 6, or 12-month plans that include maintenance and swaps. The deck is notable for its transparency, including a detailed breakdown of unit economics and a three-year revenue projection that scales from €5,506 in 2023 to nearly €2 million by 2026. While the business is asset-heavy, requiring signi…
Key takeaways
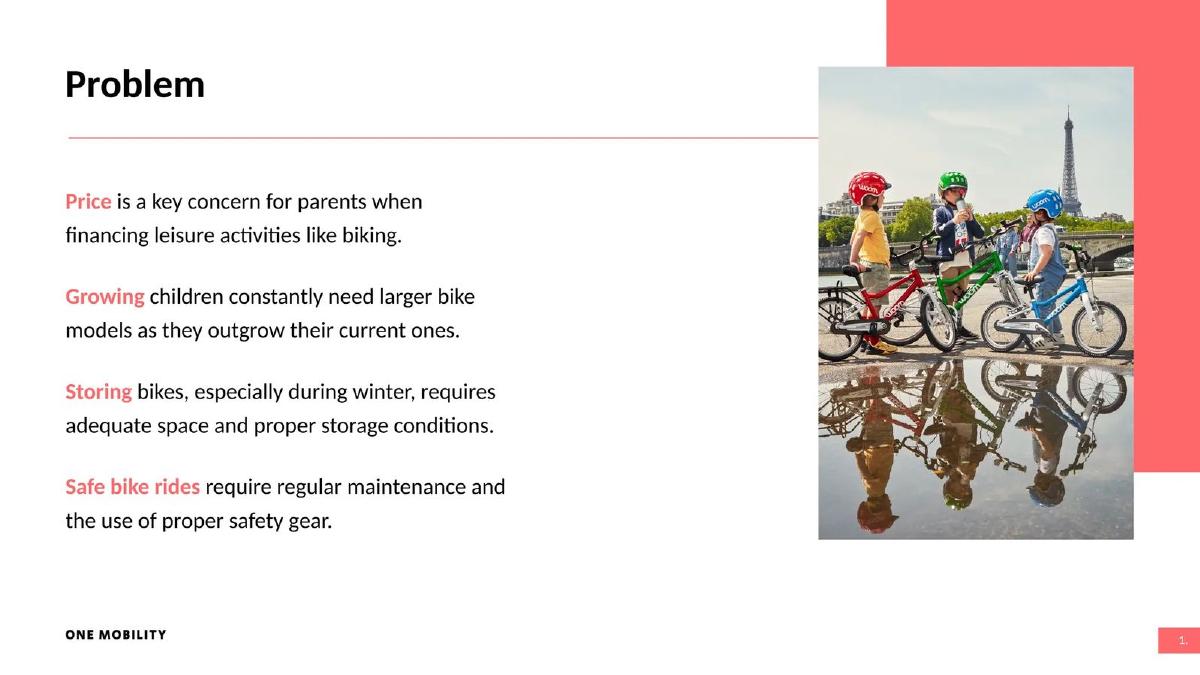
- The company identifies four primary pain points: price, outgrowing models, storage, and maintenance (Slide 1).
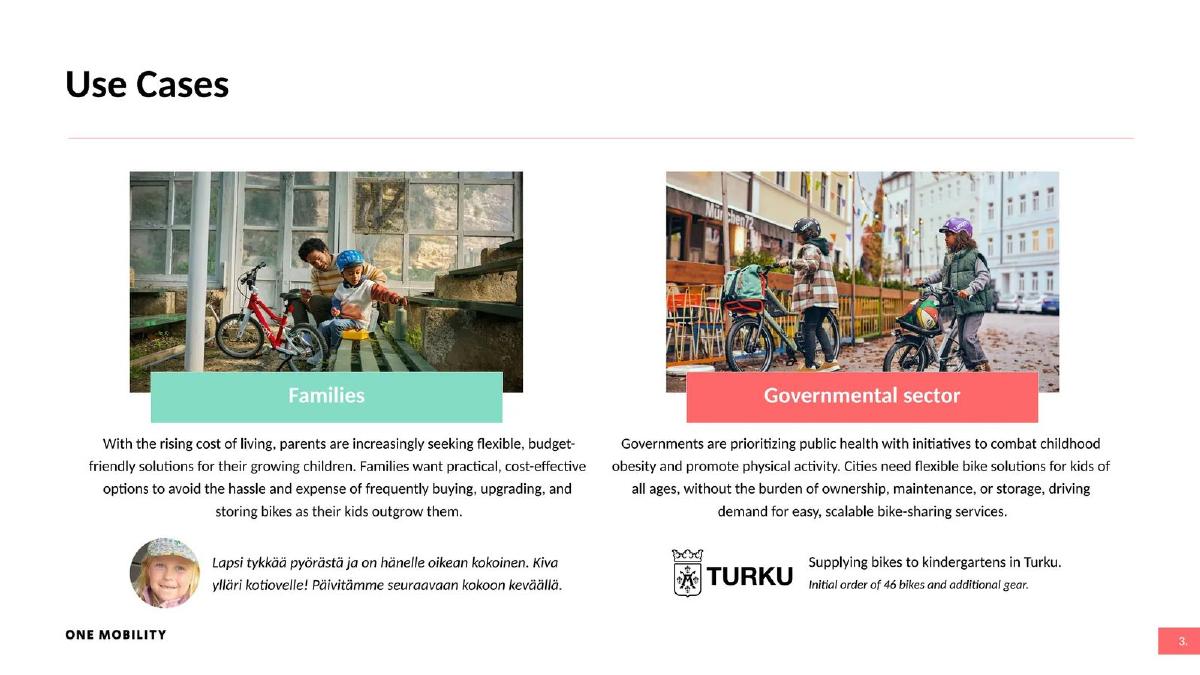
- One Mobility has secured a B2G contract with the City of Turku, supplying 46 bikes to kindergartens (Slide 3).
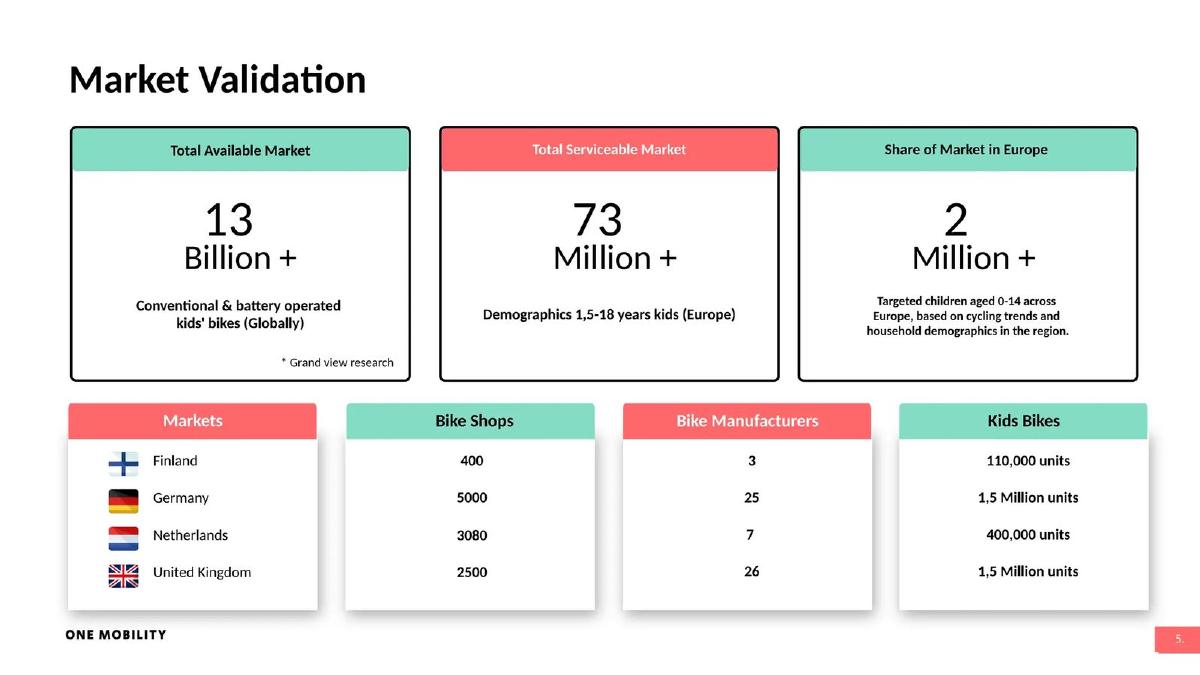
- Market validation estimates a global kids' bike market of over 13 billion, with a targeted European segment of 2 million children (Slide 5).
- Subscription pricing for 12-month plans ranges from 17.50 €/month for balance bikes to 39.90 €/month for mountain and e-bikes (Slide 7).
- Traction data shows a churn rate of 1.3% and a Customer Acquisition Cost (CAC) of 67.19 € over the last 12 months (Slide 9).
- Financial projections forecast a fleet growth from 80 bikes in 2023 to 3,000 bikes by 2026 (Slide 15).
- The unit economics slide reveals that non-recurring revenue (deliveries, gear sales) is expected to contribute 549,764 € by 2026 (Slide 15).
- The ask is for 700,000 € in seed capital, with 300,000 € allocated specifically to equipment investment (Slide 17).
Executive Summary and Problem Definition
Slides 1-2: The Hook and the Hurdle
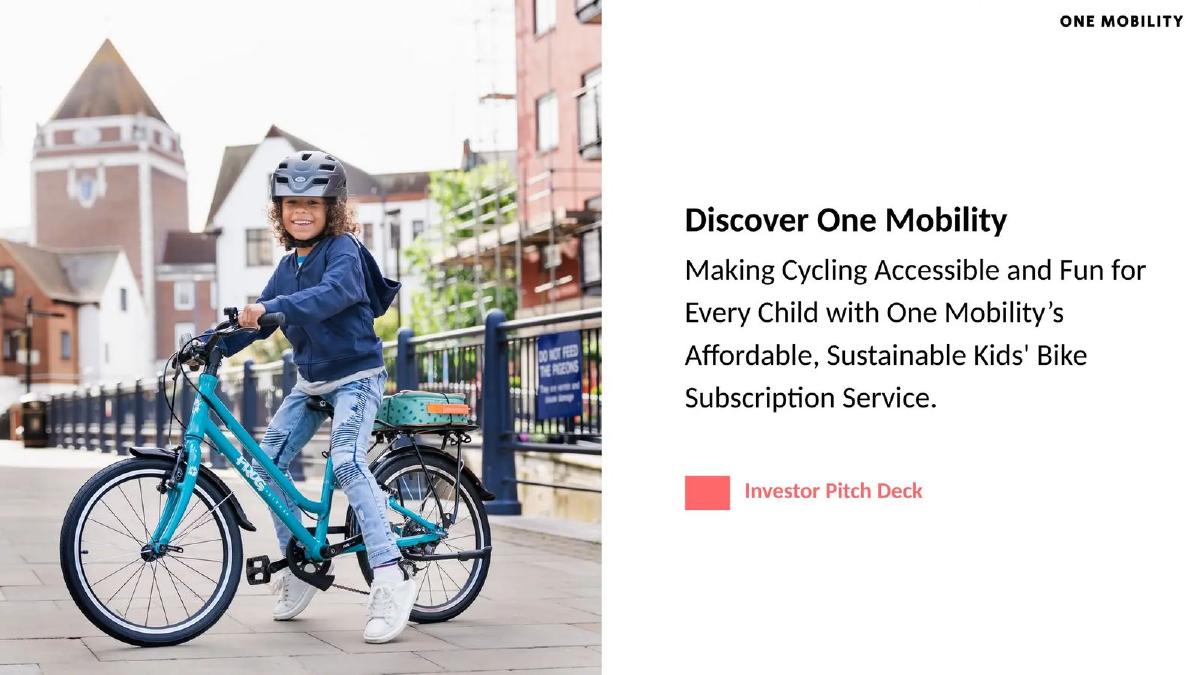
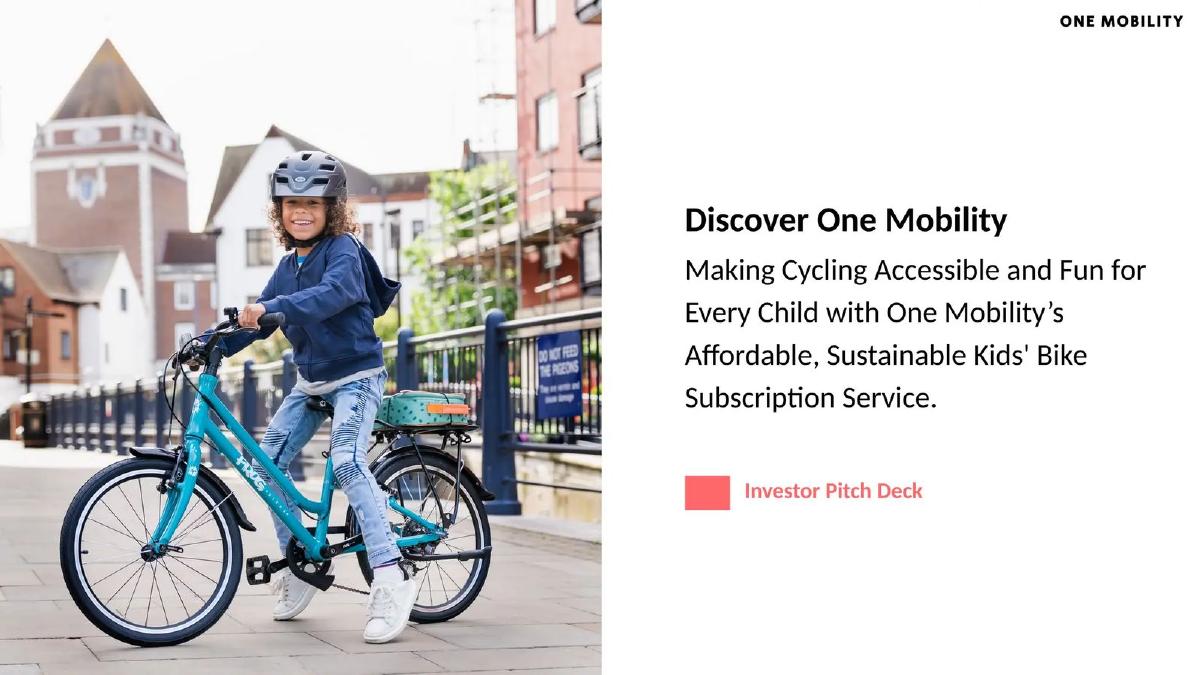
One Mobility opens with a clear value proposition: making cycling accessible through a sustainable subscription service. Slide 1 uses high-quality lifestyle imagery to establish the brand's focus on premium equipment (specifically Frog bikes). Slide 2 defines the problem space through four pillars: Price (high upfront costs), Growth (kids outgrowing bikes), Storage (winter space constraints), and Safety (maintenance needs). By framing the problem around these logistical and financial friction points, the company sets the stage for a service-based solution rather than a retail one.
Slides 3-4: The Solution and Use Cases
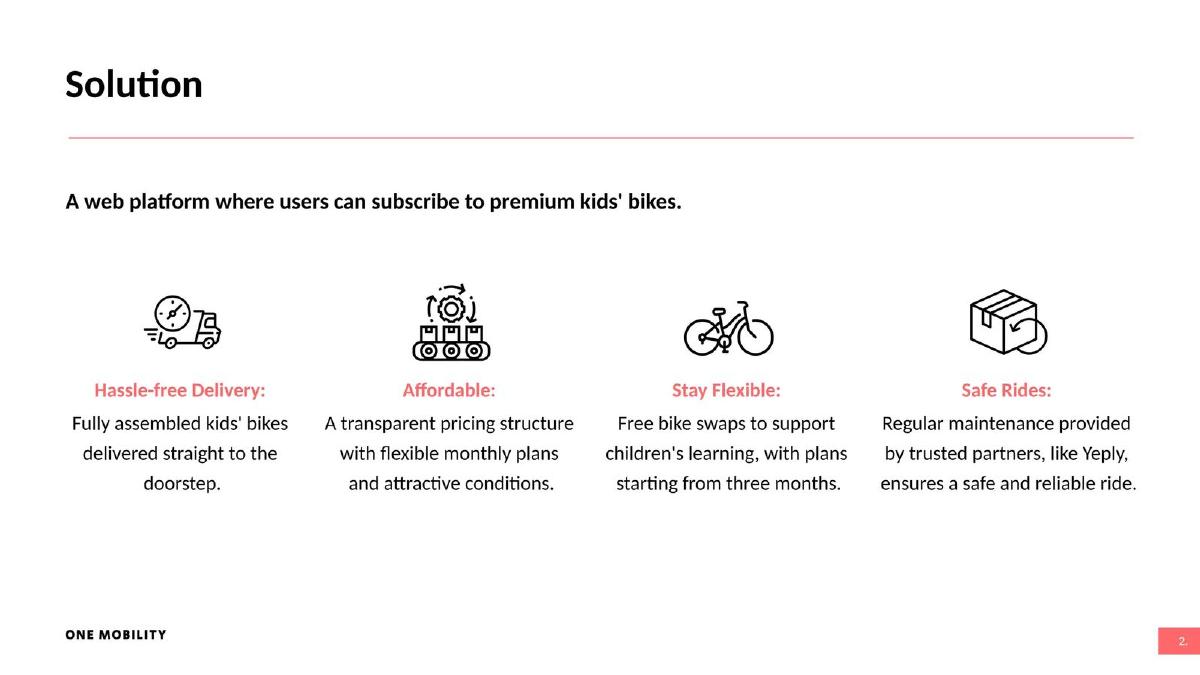
Slide 3 introduces the 'web platform' solution, highlighting hassle-free delivery, affordability, flexibility (swaps after 3 months), and safe rides via a partnership with Yeply . Slide 4 is particularly strong as it validates the model beyond the B2C market. It highlights a 'Governmental sector' use case, citing an initial order of 46 bikes for kindergartens in Turku, Finland . This B2G traction is a significant de-risking factor, suggesting a diversified revenue stream and a lower cost of acquisition for bulk orders.
Market Validation and Product Experience
Slides 5-6: Market Size and Interface
Slide 5 provides a standard TAM/SAM/SOM breakdown. The Total Available Market is cited at 13 Billion + globally (sourced from Grand View Research), while the targeted European market is 2 million children aged 0-14. The slide also breaks down the number of bike shops and manufacturers in Finland, Germany, Netherlands, and the UK, providing context for their expansion strategy. Slide 6 shows the product interface, which appears to be a localized Finnish website, emphasizing that the platform is already live and operational.
Slides 7-8: Pricing and Service Attributes
Slide 7 details the 12-month subscription pricing tiers: 17,50 € for balance bikes, 23,00 € for beginner pedal bikes, and up to 39,90 € for e-bikes. This transparency is helpful for investors to calculate potential ARPU. Slide 8 reinforces the 'Service Attributes,' focusing on environmental friendliness through reuse and the convenience of door-to-door delivery within three days. The 'Always The Right Size' promise is the core retention hook of the business model.
Traction and Competitive Landscape
Slides 9-11: Performance Metrics and Positioning
Slide 9 is a data-dense 'Traction Metrics' table. Key figures include an Average MRR of 6,904.32 € , a Churn rate of 1.3% , and a CAC of 67.19 € . The total income for the last 12 months (08/2023-08/2024) is stated as 41,595.38 € . Slide 10 uses a standard 2x2 matrix to position One Mobility as the leader in 'Affordability' and 'Consumer Convenience' against Bike Club and Kleta . Slide 11 provides a feature-by-feature comparison, claiming One Mobility is the only player offering the full suite of unlimited maintenance, storage solutions, and trend-based upgrades.
Future Roadmap and Financial Depth
Slides 12-14: The Path to 2026
Slide 12 outlines a three-stage roadmap. Stage 1 (2024) focuses on doubling storage and securing a 1,000,000 € seed round (including 300k from public funding). Stage 2 (2025) aims for a 700-bike fleet and expansion into European markets. Stage 3 (2026) targets the DACH region with a larger 1.3 million seed round and a 3,000-bike fleet. Slides 13 and 14 visualize this growth, showing a steep revenue curve that relies heavily on the transition from hundreds to thousands of active subscriptions.
Slides 15-16: Granular Unit Economics
These slides are the most detailed in the deck. Slide 15 forecasts unit economics through 2026, projecting total recurring revenue to grow from 4,960 € in 2023 to 1,285,001 € in 2026 . It also accounts for 'non-recurring' revenue like delivery fees and gear sales, which are expected to hit 549,764 € by 2026. Slide 16 provides a full 'Revenue Projection' table including COGS for bike acquisitions ( 820,000 € in 2026 ), salaries, and marketing. It also lists existing finance resources, including a 50,000 € share issue to Oivia Ltd. and 65,000 € in capital loans .
The Ask and The Team
Slides 17-21: Investment and Leadership
Slide 17 clarifies the funding request: 700,000 € sought to complete a 1,000,000 € round. The 'Use of Funds' chart shows that the largest portion (300,000 €) goes directly into 'Equipment investment,' which is logical for an asset-heavy model. Slide 18 introduces the team, led by Jaana Ylikoski , who has 18+ years in business development. Slide 19 lists strategic advisors and partners, including the CEOs of Yeply and Frog Bikes , which adds significant industry credibility. The deck concludes with contact information for their Helsinki headquarters.
What One Mobility Does Well
Financial Transparency: The inclusion of Slide 15 and 16 is rare for a seed deck. Providing a full breakdown of COGS, bike acquisition costs, and non-recurring revenue streams shows a high level of operational maturity. · B2G Validation: Mentioning the City of Turku contract (Slide 3) proves the model works for institutional clients, not just individual parents. · Strategic Partnerships: Having the CEO of their primary maintenance provider (Yeply) and their primary bike supplier (Frog Bikes) as advisors/partners (Slide 19) creates a 'moat' around their supply chain.
What is Missing from the Deck
Asset Financing Strategy: While they ask for equity to buy bikes, there is no mention of debt facilities or asset-backed lending. Scaling a fleet to 3,000 bikes solely on equity is dilutive; a plan for future debt financing would be a strong addition. · Logistics Detail: The deck mentions 'door-to-door delivery' but doesn't explain if they own the vans or use third-party logistics (3PL). Given the 'fully assembled' requirement, this is a major cost driver. · Exit Strategy: There is no mention of potential acquirers (e.g., major bike manufacturers like Trek/Specialized or mobility platforms like Uber/Bolt).
Founder's Guide: What to Copy
The Traction Table (Slide 9): Instead of vague charts, use a clear table with MRR, CAC, and Churn. It forces honesty and gives investors the exact numbers they need for their models. · Use Case Diversification (Slide 4): Showing that your product works for both families and governments demonstrates a larger, more resilient market. · The Partner Quote Slide (Slide 19): Using quotes from your suppliers and service partners proves that your ecosystem is healthy and that you aren't just a middleman, but a valued partner in the industry.
Frequently asked questions
- What is the core business model of One Mobility?
- One Mobility operates a subscription-based 'Bike-as-a-Service' platform. Parents or governmental entities pay a monthly fee (starting at 17.50 €) for high-quality kids' bikes. The service includes door-to-door delivery of assembled bikes, unlimited maintenance through partners like Yeply, and the ability to swap bikes as the child grows, eliminating the need for parents to buy and resell equipment frequently.
- How does the company plan to use the 700,000 € investment?
- According to slide 17, the funds are split across several categories: 300,000 € for equipment investment (buying bikes), 233,000 € for personnel, 180,000 € for operating expenses, 160,000 € for marketing, 77,000 € for product development, and 50,000 € for additional products. This reflects the capital-intensive nature of a hardware-subscription business.
- What is the current traction and growth trajectory?
- The company reported 41,595.38 € in total income for the period between 08/2023 and 08/2024 (Slide 9). They currently manage a fleet of 300 bikes (Slide 9) and project scaling this to 1,000 bikes in 2025 and 3,000 bikes in 2026, aiming for a total revenue of 1,974,954 € by the end of 2026 (Slide 15).
- Who are the primary competitors identified in the deck?
- Slide 10 and 11 compare One Mobility against Bike Club, Kleta, and Decathlon. One Mobility positions itself as more affordable and convenient than Bike Club and Kleta, while offering lower 'consumer complexity' than Decathlon. They claim a competitive advantage by offering unlimited maintenance and flexible upgrades which competitors allegedly lack in full combination.
- What are the specific unit economics for the bike fleet?
- Slide 15 provides a detailed breakdown. In 2024, they expect 36,311 € from leasing subscriptions and 7,000 € from non-recurring revenue (deliveries and gear). By 2026, they project the 'Bike profit (lifetime value)' to reach 1,020 € per unit, with a churn rate maintained at approximately 1.3%.