The Wolt acquisition deck is a masterclass in justifying a high-premium transaction through operational excellence and market expansion. Dated November 2021, the presentation illustrates how Wolt scaled from a single city in Helsinki to 23 countries by 2020. The deck prioritizes hard data over visionary fluff, showcasing a 130%+ YoY GOV growth rate and a weighted average customer retention that stabilizes at 40% by Month 36. By emphasizing that 65% of Wolt's Gross Order Value (GOV) was already generating positive contribution profit at the time of the deal, the narrative shifts from a risky i…
Key takeaways
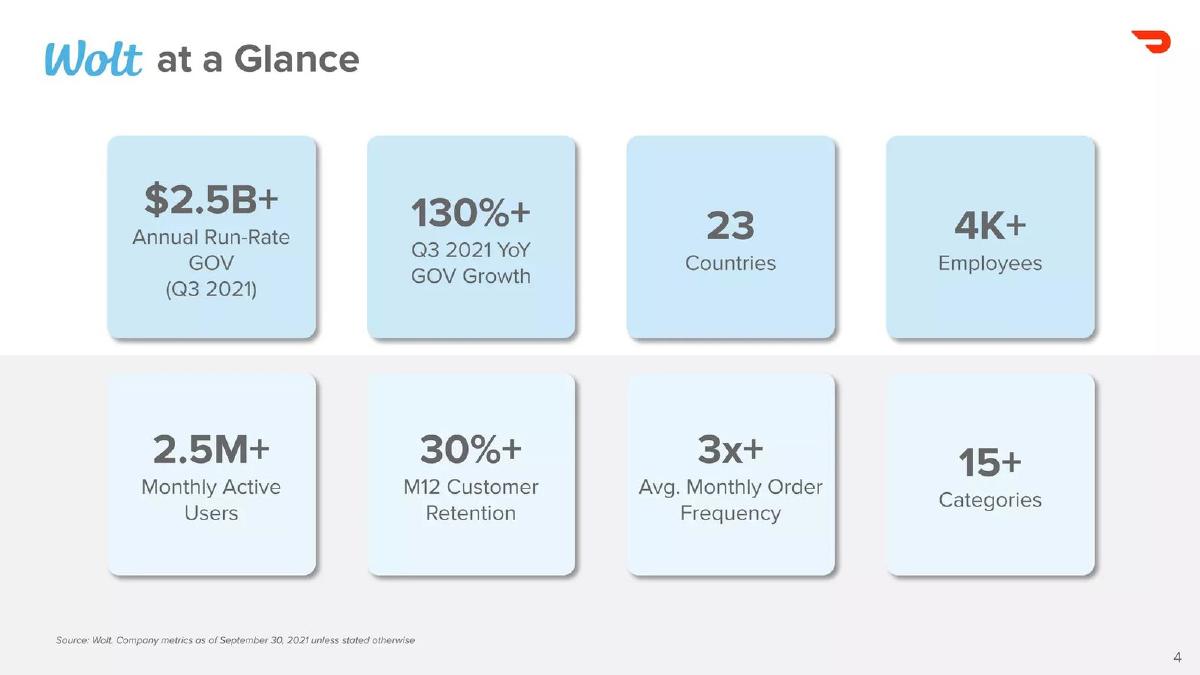
- Wolt reported an annual run-rate GOV of over $2.5 billion as of Q3 2021 on slide 4.
- The company demonstrated a 130%+ year-over-year GOV growth rate for Q3 2021 on slide 4.
- Customer retention is shown to be exceptionally stable, reaching 40% by Month 36 according to the cohort chart on slide 9.
- Logistics efficiency is a core pillar, with average delivery times trending downward toward 30 minutes while deliveries per hour increased to approximately 2.4 on slide 10.
- Slide 11 reveals that 65% of Wolt GOV generates positive contribution profit, a key metric for a late-stage acquisition.
- The combined company market opportunity covers over 700 million people across North America, Europe, and Japan as shown on slide 13.
- The transaction was structured as an all-stock deal valued at approximately $8.1 billion (US) on slide 14.
- Miki Kuusi, Wolt CEO, was designated to run DoorDash International following the close, reporting to Tony Xu, as stated on slide 14.
The Narrative of a Multi-Billion Dollar Exit
The Wolt pitch deck, presented in November 2021, is not a traditional startup pitch for seed funding. Instead, it serves as a strategic document for the acquisition of Wolt by DoorDash. With 14 slides, the deck focuses on proving that Wolt is not just another food delivery app, but a highly efficient logistics machine with superior unit economics and a proven ability to scale across diverse international markets. The deck is characterized by clean design, heavy reliance on cohort data, and a clear emphasis on the 'common culture' between the two companies.
Introduction and Legal Framework
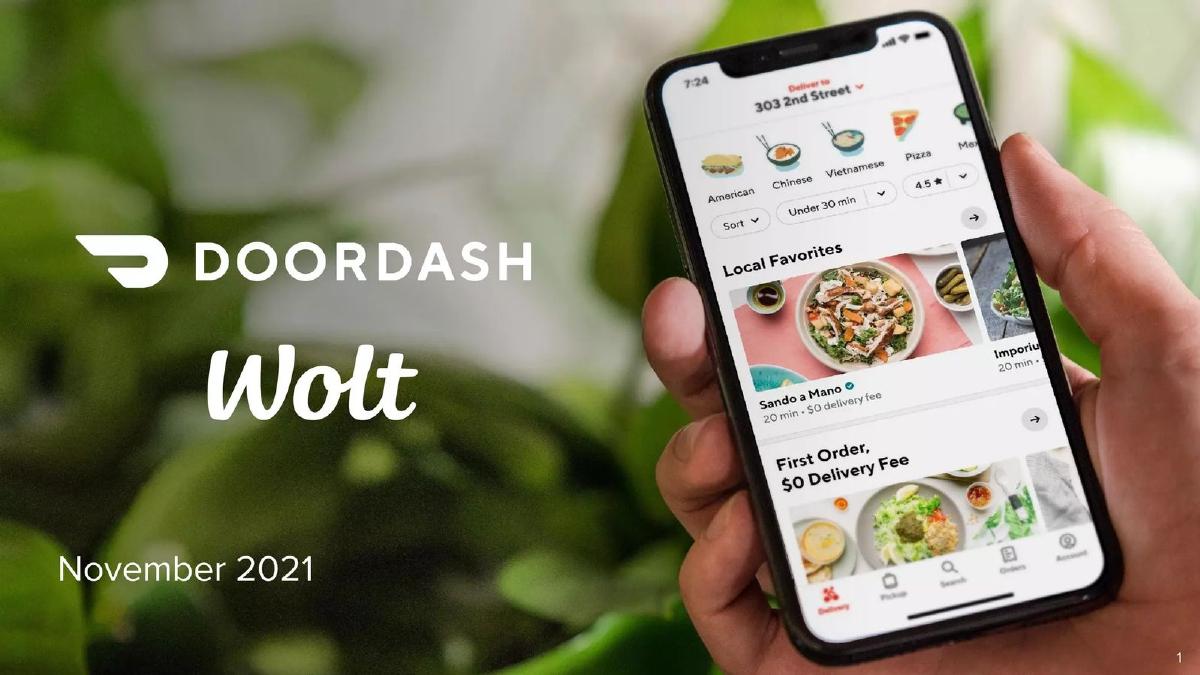
Slide 1: Title Slide The deck opens with a simple co-branded slide featuring the DoorDash and Wolt logos. A hand holds a smartphone displaying the DoorDash interface, signaling the integration of the two brands. The date is clearly marked as November 2021.
Slide 2 and 3: Disclaimers As this is a document related to a transaction involving a publicly traded company (DoorDash), these slides contain standard 'Forward Looking Statements' and 'Additional Information' disclaimers. They reference Section 27A of the Securities Act of 1933 and mention that DoorDash will file a Form S-4 with the SEC. These slides are essential for legal compliance but contain no business metrics.
The Performance Snapshot
Slide 4: Wolt at a Glance This is the 'money slide' for high-level metrics. It lists eight key data points as of September 30, 2021:
$2.5B+ Annual Run-Rate GOV (Gross Order Value). · 130%+ Q3 2021 YoY GOV Growth. · 23 Countries of operation. · 4K+ Employees. · 2.5M+ Monthly Active Users. · 30%+ M12 Customer Retention. · 3x+ Avg. Monthly Order Frequency. · 15+ Categories of goods delivered.
This slide establishes Wolt as a massive, fast-growing entity that has already diversified beyond just restaurant delivery.
Strategic Rationale
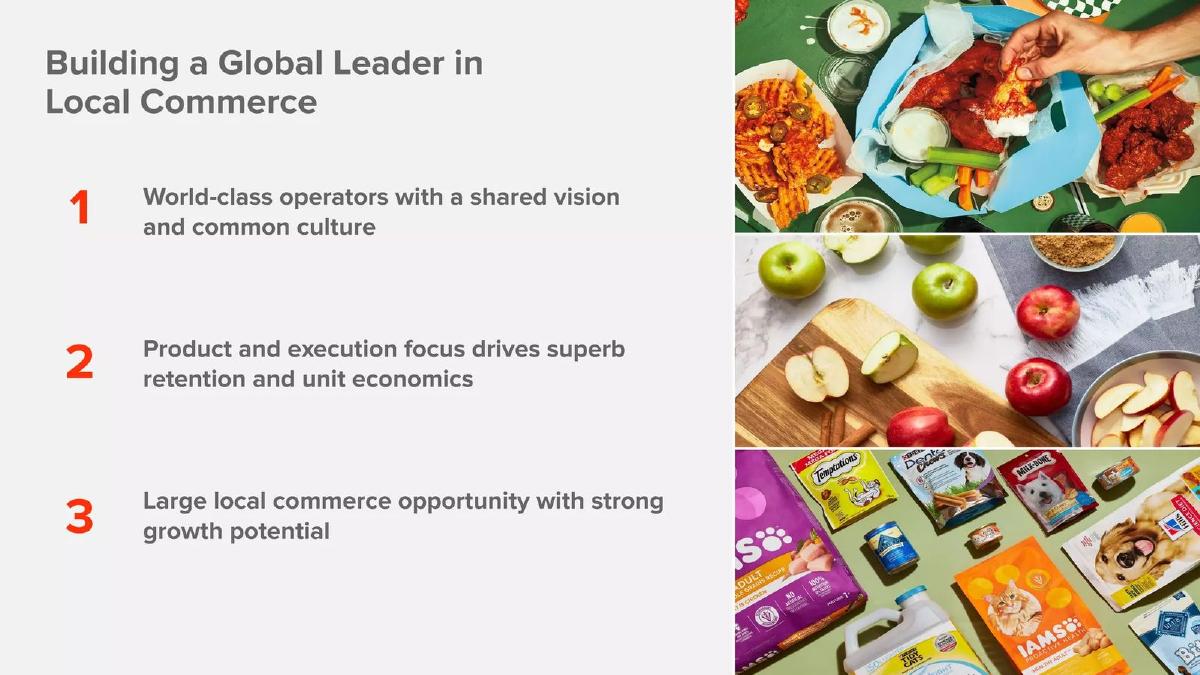
Slide 5: Building a Global Leader in Local Commerce This slide outlines the three pillars of the acquisition: world-class operators with a shared vision, a focus on product and execution driving unit economics, and a large local commerce opportunity. The imagery on the right shows food, groceries, and pet supplies, reinforcing the 'beyond food' strategy.
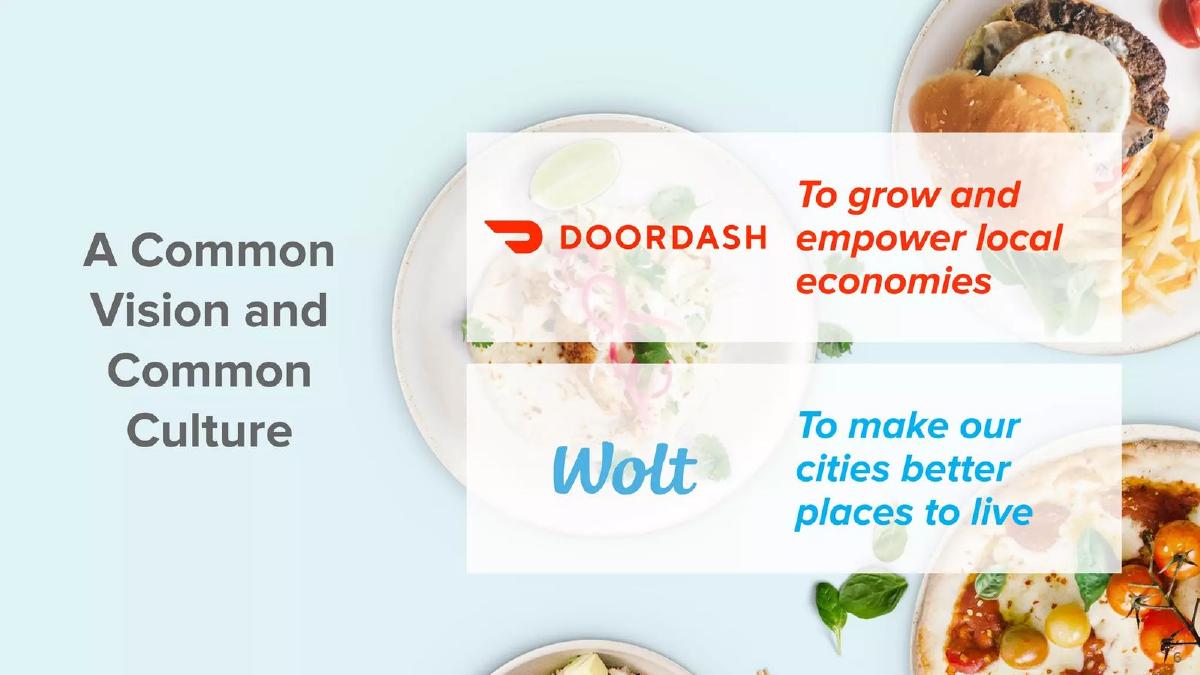
Slide 6: A Common Vision and Common Culture This slide compares the mission statements of both companies. DoorDash aims 'To grow and empower local economies,' while Wolt aims 'To make our cities better places to live.' The alignment of these 'soft' factors is used to justify the organizational fit of the merger.
Operational Excellence and Scaling
Slide 7: World Class Operators with Proven Ability to Scale This slide features photos of Miki Kuusi (CEO) and Riku Mäkelä (COO) alongside a timeline of expansion. It tracks the company from its 2014 founding in Helsinki to its first delivery in 2015, and then a rapid acceleration: 3 countries in 2016, 6 in 2017, 14 in 2018, 19 in 2019, and 23 in 2020. The timeline highlights specific launches in difficult markets like Japan and Germany.
Slide 8: Built for International Expansion Wolt argues that starting in Finland—a market they describe as 'one of the most difficult' for last-mile logistics—forced them to build a superior model. They highlight an 'App Store Editors’ Choice Award' and a case study in Israel where Wolt achieved a 7.7 customer satisfaction rating compared to 7.1 for 'Competitor A.'
The Data Deep Dive
Slide 9: Consumer Obsession Drives Superb Retention This slide presents a cohort retention chart from January 2018 to September 2021. The 'Weighted Average Customer Retention' starts at 100% (M0), drops to 34% (M1), and then remarkably climbs back up to 40% by Month 36. This indicates that long-term users become more active over time, a key indicator of high Lifetime Value (LTV).
Slide 10: Obsessive Focus On Logistics Efficiency Two charts demonstrate Wolt's technical edge. The first shows 'Average Delivery Time' dropping from nearly 40 minutes to approximately 32 minutes over three years. The second shows 'Deliveries Per Hour' increasing from 1.8 to 2.4. The slide notes that their ability to drive efficiency in 'low density cities' is a core differentiator.
Slide 11: Demonstrated Ability To Drive Strong Unit Economics This slide is critical for proving profitability. It states that 65% of Wolt GOV generates positive contribution profit. A bar chart compares Wolt's positive contribution profit countries against DoorDash's US Restaurant Marketplace, showing that Wolt's top markets are performing at a high level. It also notes 100%+ YoY GOV growth in these profitable countries.
Market Opportunity and Transaction Details
Slide 12: Delivering Local Commerce This slide uses three smartphone mockups to show the breadth of the platform: Restaurants (sushi, shawarma), Grocery (Carrefour), and 'Stores' (electronics like Apple resellers and pet supplies). It visualizes the transition from a food delivery app to a 'local commerce' platform.
Slide 13: Large Local Commerce Opportunity A map highlights the combined footprint of DoorDash (red) and Wolt (blue), covering over 700 million people. The charts on the right estimate the 2021 Food & Grocery market at $1.8T in the USA and $1.2T in Wolt markets, with online penetration still low (6% to 11%), suggesting massive room for growth.
Slide 14: Transaction Overview The final slide details the deal terms:
Approximately €7.0B ($8.1B) consideration. · All stock transaction. · DoorDash equity valued at $206.45 per share. · €500M retention pool for Wolt employees. · Miki Kuusi to run DoorDash International. · Expected to close in 1H 2022.
What Works in This Deck
The 'Smiling' Retention Curve: Slide 9 is the strongest evidence of product-market fit. Most apps see retention decay indefinitely; Wolt shows retention that actually improves for older cohorts. This is a powerful way to prove that the service becomes a habit for its users.
Efficiency Metrics: By showing delivery times going down while deliveries per hour go up (Slide 10), Wolt proves that their growth is not just 'buying' market share with subsidies, but is supported by actual algorithmic improvements in logistics.
Geographic Breadth: The timeline on Slide 7 is a visual testament to execution. Scaling to 23 countries in six years is an immense operational feat, and listing the specific years of entry for each country builds credibility.
What Is Missing
Detailed P&L: While 'Contribution Profit' is mentioned, the deck omits a full P&L. We do not see net income, marketing spend as a percentage of revenue, or corporate overhead. This is common in acquisition decks where the focus is on the 'core' unit economics rather than the consolidated bottom line.
Competitor Names: Slide 8 refers to 'Competitor A.' While common in public filings to avoid litigation or direct attacks, it leaves the reader to guess whether they are outperforming Uber Eats, Deliveroo, or a local incumbent.
Specific Tech Details: The deck claims 'real-time logistics optimization' but never explains how their tech differs from competitors. It relies on the results of the tech (delivery times) rather than the tech itself.
What a Founder Should Copy
The 'At a Glance' Slide: Slide 4 is a perfect template for any late-stage founder. It combines scale (GOV, Users), growth (YoY %), and efficiency (Frequency, Retention) in one easy-to-digest view.
Focus on Unit Economics: Slide 11 shows that the company knows exactly which parts of its business are profitable. Founders should always be able to segment their revenue by 'Contribution Profit' to show that the business model works at scale, even if the overall company is still burning cash for growth.
Visualizing the TAM: Slide 13 does an excellent job of breaking down the Total Addressable Market (TAM) by segment (Food vs. Total Retail) and by geography. It makes a multi-trillion dollar opportunity feel grounded in specific, regional data points.
Conclusion The Wolt deck is a clinical, data-driven argument for a massive exit. It avoids the hyperbole often found in early-stage decks and instead focuses on the relentless improvement of operational metrics. For any founder looking to be acquired, this deck serves as a blueprint for how to prove that your company is an 'engine' that will accelerate the acquirer's existing business.
Frequently asked questions
- What was the primary valuation and structure of the Wolt acquisition?
- According to slide 14, the transaction was valued at approximately €7.0 billion, which converted to roughly $8.1 billion USD at the time. The deal was structured as an all-stock transaction. DoorDash equity issued for the deal was valued at $206.45 per share, based on a 30-day volume-weighted average price (VWAP) as of November 3, 2021.
- How did Wolt demonstrate its operational efficiency in the deck?
- Wolt used two primary charts on slide 10 to prove efficiency: Average Delivery Time and Deliveries Per Hour. The data shows delivery times dropping from near 40 minutes in 2018 to approximately 32 minutes in 2021. Simultaneously, deliveries per hour rose from 1.8 to roughly 2.4, indicating that the platform became more productive as it scaled.
- What do the retention cohorts look like for Wolt?
- Slide 9 shows a weighted average customer retention curve. While there is an initial drop-off after Month 0, the curve flattens significantly. It hits 34% at Month 1 and actually trends upward over time, reaching 40% by Month 36. This 'smiling' retention curve is highly prized in SaaS and marketplace businesses as it indicates high long-term user value.
- Which markets did Wolt operate in at the time of the acquisition?
- Slide 7 provides a timeline of expansion. By 2020, Wolt had launched in 23 countries. Key regions mentioned include the Nordics (Finland, Sweden, Norway, Denmark), the Baltics (Estonia, Latvia, Lithuania), Central and Eastern Europe (Poland, Czech Republic, Slovakia, Hungary), and international outliers like Israel, Japan, and Germany.
- What was the financial impact expected for the combined entity?
- On slide 14, the deck states that the transaction was expected to be accretive to GOV growth in 2022. Furthermore, the pro forma combined Adjusted EBITDA was projected to be between $0 and $500 million for the year 2022, suggesting the acquisition would not be a significant drag on DoorDash's path to profitability.