HomeCooks (Juno Food Ltd) is a UK two-sided marketplace for pre-prepped meals from independent food creators. Its 25-slide November 2023 Seedrs crowdfunding deck leads with six quarters of real revenue growth, 129 active chefs against a 900+ waiting list, and a founder who previously sold Eatstudent to Just Eat. But the deck has no ask, never states its take rate (recoverable only by dividing two columns of the projection table, at 38-41%), and its traction, roadmap and five-year projection slides describe three incompatible versions of 2024.
Key takeaways
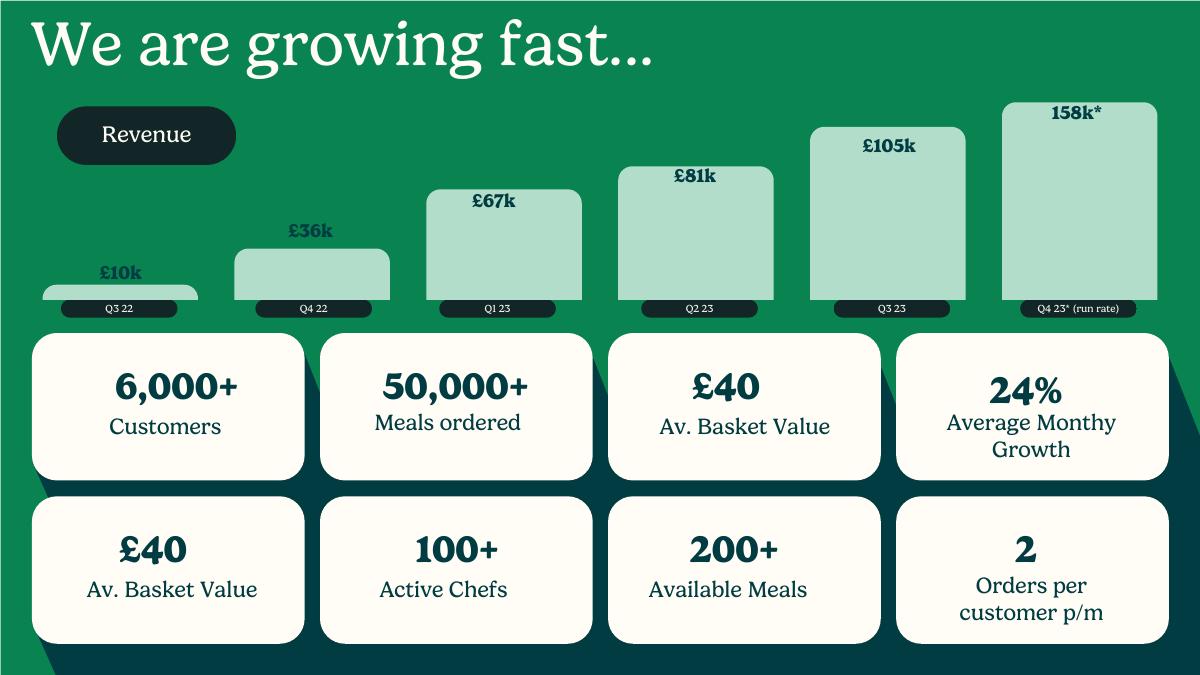
- HomeCooks' 2023 Seedrs deck reports quarterly revenue growing from GBP 10k in Q3 2022 to a GBP 158k Q4 2023 run rate, but never labels whether the figures are monthly or quarterly, which changes the meaning of three separate slides.
- The deck's traction grid wastes one of its eight metric tiles on a duplicate: average basket value of GBP 40 appears twice, in space that could have carried gross margin or take rate.
- HomeCooks never states its commission anywhere in 25 slides; dividing revenue by transaction value in its own five-year projection implies a take rate of 38-41%, far above the Etsy comparison the deck opens with.
- Slide 21 sets a twelve-month goal of GBP 150k monthly revenue while slide 6 already reports a GBP 158k Q4 2023 run rate, and slide 22 projects full-year 2024 revenue of only GBP 682k.
- The strongest fact in the deck - 129 active chefs against 900+ food brands on the waiting list - is buried as a caption inside a decorative shape rather than used as a headline.
- Acquisition percentages of exactly 33.3% and 14.3% twice indicate a very small denominator, and the slide claims 'quick user payback' without printing a payback period, CAC or LTV.
- The team slide is top-decile for the stage - a founder who sold Eatstudent to Just Eat, plus SpeedInvest, Love Ventures and Deliveroo and Just Eat advisors - but lists the CTO as non-executive against a roadmap of an app and a social feed.
- Crowdfunding decks legitimately omit the ask because the campaign page carries it, but once the PDF circulates alone, a reader learns the amount, valuation and use of funds nowhere.
What this deck actually is
This is a 25-slide equity crowdfunding deck for HomeCooks, a UK two-sided marketplace for pre-prepped meals cooked by independent food creators. The file's internal title is "Seedrs Deck — HomeCooks" , it was produced in Canva, the author metadata reads Joshua Magidson (the founder and CEO), and the creation date is 16 November 2023. The cover slide gives the registered company name as Juno Food Ltd. So the brand is HomeCooks and the legal entity is Juno Food.
That "Seedrs" label in the file name matters more than anything else in this teardown, because it explains both the deck's biggest strength and its biggest structural gap. A Seedrs deck is a retail crowdfunding artifact. It is read by hundreds of small cheque writers on a campaign page that already displays the raise amount, the pre-money valuation, the share class, the tax relief status and the use of funds in a standardised box next to it. The deck's job in that context is narrative and credibility, not terms.
Which is why this deck has no ask slide, no valuation, no use of funds, no runway and no cap table — and why judging it as a straight VC seed deck would be unfair. But it is now circulating as a standalone PDF, detached from that campaign page, and as a standalone PDF it ends on a contact email after a slide that says "This is Feel Good Food." A reader who finds this file on its own never learns how much money the company wants or what it will do with it.
Everything else about the deck is unusually strong. Real revenue, real cohort counts, real chef economics, a named team with a genuine exit, named investors and advisors. This is a company with a business, not a concept deck. Which makes the internal contradictions between its traction slide, its roadmap slide and its projection slide much more damaging than they would be in a deck with nothing to contradict.
Slide-by-slide walkthrough
Slide 1 — Cover
"Eat Well, Support Small." Underneath: "Registered Company Name: Juno Food Ltd." The tagline is good — it names both sides of the marketplace in four words, the eater benefit and the creator benefit. Putting the registered entity on the cover is a crowdfunding compliance habit rather than a pitch choice, and it is the first signal that this file was built for Seedrs rather than for a partner meeting.
Slide 2 — Mission
"To keep human connection at the heart of food commerce." One sentence, full slide, no decoration. It is a mission statement rather than a claim you can test, but it earns its place because it sets up the social-impact argument that closes the deck twenty-two slides later.
Slide 3 — The one-liner
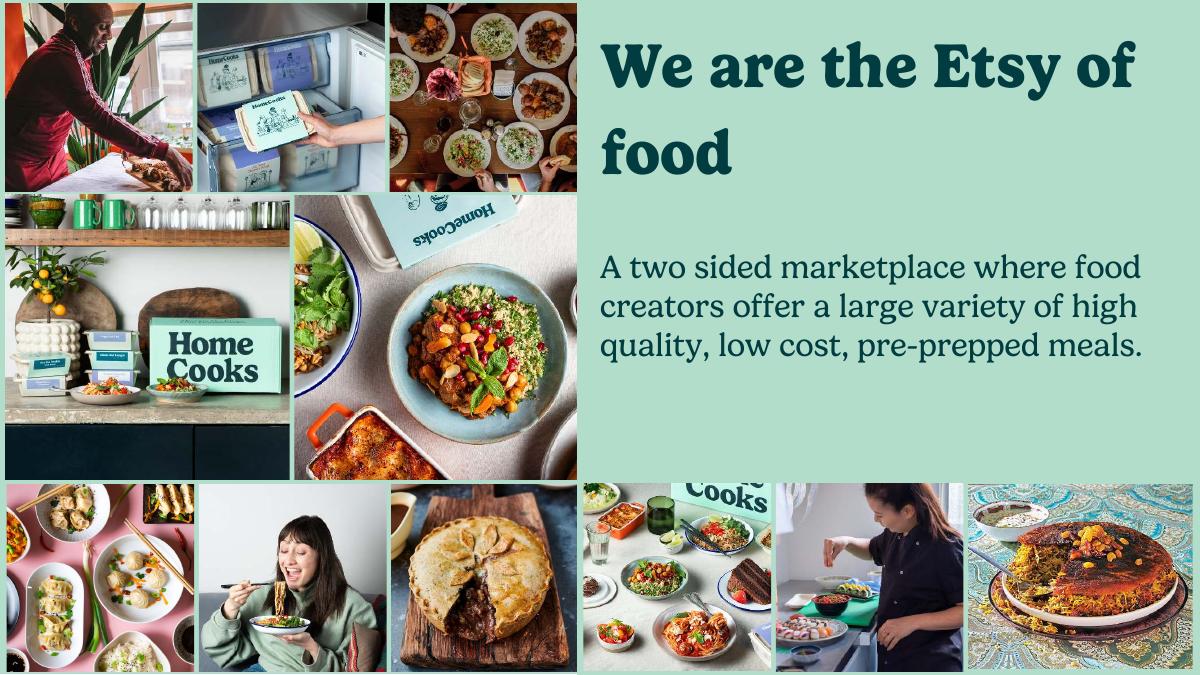
"We are the Etsy of food. A two sided marketplace where food creators offer a large variety of high quality, low cost, pre-prepped meals." This is the single best slide in the deck for comprehension. An investor knows what Etsy is, knows Etsy is a supply-constrained long-tail marketplace, and can now hold the whole business in their head. Hold on to the Etsy comparison though — slide 22 quietly contradicts it.
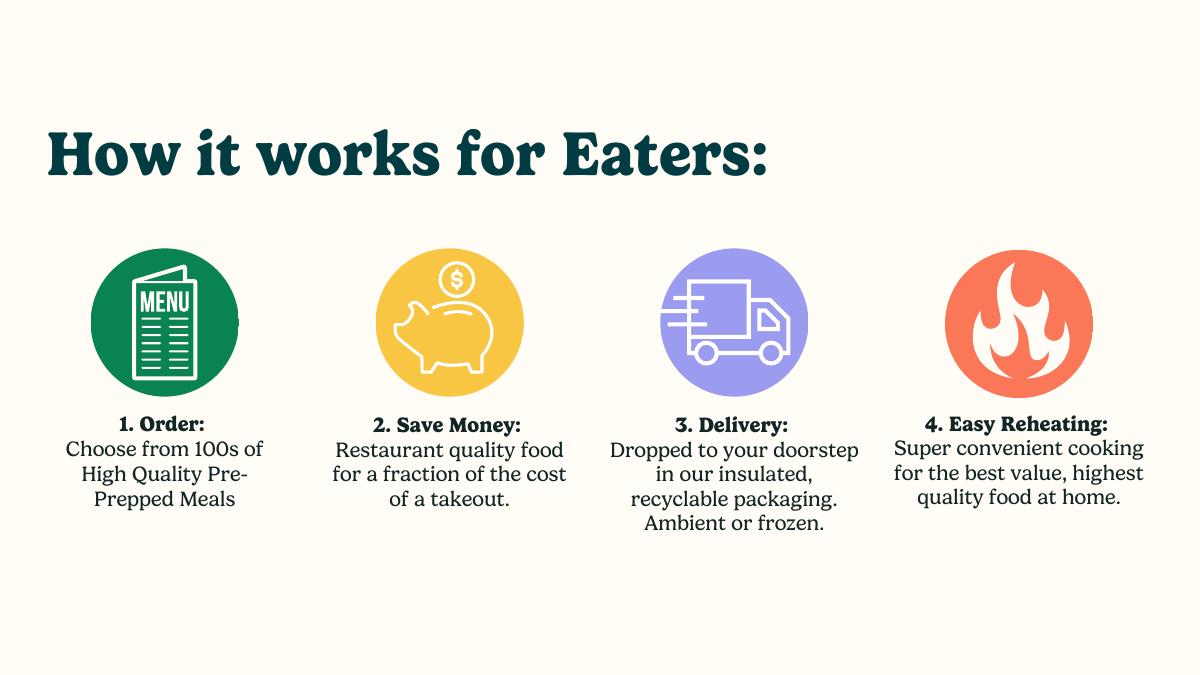
Slide 4 — How it works for eaters
Four steps: order from hundreds of pre-prepped meals; save money at "a fraction of the cost of a takeout"; delivery to your doorstep in insulated recyclable packaging, ambient or frozen; easy reheating. The "ambient or frozen" detail is the most valuable thing on the slide, because it is the answer to the obvious operational objection about a national food marketplace without a chilled last-mile network.
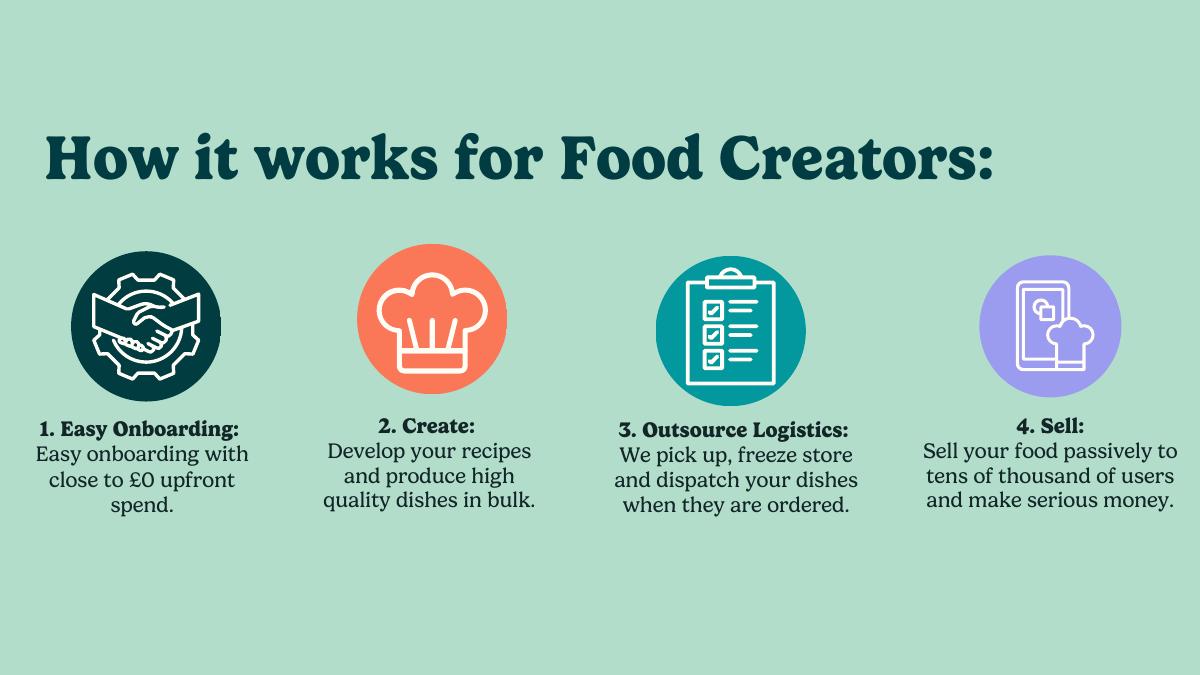
Slide 5 — How it works for food creators
Onboarding at "close to £0 upfront spend", develop recipes and produce in bulk, HomeCooks picks up, freezes, stores and dispatches, and the chef sells "passively to tens of thousand of users." Two things. First, the supply-side pitch is genuinely differentiated: the platform absorbs logistics and storage, which is the part that kills independent food brands. Second, there is a typo — "tens of thousand of users" — on one of the two slides that define the product. In a deck this polished, that is the sort of thing a final read-aloud catches.
Slide 6 — Traction
The most important slide in the deck, and the most revealing. A quarterly revenue bar chart: £10k in Q3 2022, £36k in Q4 2022, £67k in Q1 2023, £81k in Q2 2023, £105k in Q3 2023, and £158k marked with an asterisk for Q4 2023 run rate. Below it, a grid of metrics: 6,000+ customers, 50,000+ meals ordered, £40 average basket value, 24% average monthly growth, £40 average basket value again, 100+ active chefs, 200+ available meals, 2 orders per customer per month.
Yes — average basket value appears twice in an eight-tile grid. One of the eight most valuable rectangles in the entire deck is a duplicate. That is a free slot for gross margin, take rate, repeat rate or contribution per order, and it was spent on a copy-paste error.
Now the arithmetic. Five quarters from £10k to £158k is roughly 74% growth per quarter, which is about 20% compounded monthly, so "24% average monthly growth" is at the optimistic edge of what the chart supports but is not fabricated. The harder problem is the customer maths: 6,000 customers at 2 orders per month and a £40 basket would be £480k of monthly revenue, against a stated quarterly run rate of £158k. The two figures can only both be true if the 6,000 is cumulative all-time customers while the 2 orders per month applies to a much smaller active cohort. The deck never says which, and an investor will ask inside ninety seconds.
The asterisk is also doing quiet work. Five of the six bars are actuals and the sixth is a run rate, plotted on the same axis in the same colour. If the final bar is the one your growth story rests on, label it in a different shade and put the definition on the slide.
Slide 7 — The thesis
"The 'at home' food service industry is broken." A single line on a slide. Fine as a hinge between traction and problem, though placing it after traction rather than before is a deliberate choice that works here: earn attention with numbers, then explain the market.
Slide 8 — The problem for eaters
A two-column comparison. Eating at home is expensive (Deliveroo, Uber Eats), inconvenient (cooking from scratch, HelloFresh) and depressing (ready meals). Ordering from HomeCooks is low cost (60% less than the price of a takeout), convenient (reheat in under 10 minutes) and vibrant (hundreds of restaurant-quality meals). Naming the actual competitors instead of abstract categories is the right call. "60% less" is a strong, falsifiable claim and it is supported later on slide 12 by the £9–£15 versus £5–£8 price comparison.
Slide 9 — The problem for food creators
"Starting and operating a food brand is expensive and borderline impossible," supported by "60% of food brands fail in their first year and 80% in their first five years," and a note that energy prices, recession and staff costs will make it worse. The failure statistics are unsourced and undated, which is the single most common credibility leak in pitch decks. Two of these numbers with a named source and a year would cost one line of small type.
Slide 10 — The solution for food creators
Three points — start in a week with £0 CapEx, bulk cooking makes staff, food, energy and property costs efficient, sell in the background while focusing on creation — with a pull-quote: "It's why we have 900+ food brands on our waiting list." That waiting list number is the strongest supply-side proof point in the deck, and it is set in small text inside a decorative shape instead of being a headline. 900 waiting suppliers against 129 active ones is the whole scaling argument.
Slide 11 — Market
UK home food service as the TAM: £10bn in 2015 growing to £18bn in 2021, broken into takeaway delivery £11bn, ready meals £4bn and meal kits £2bn. Then the global eat-at-home market at £250bn, and three US comparables described only by round: a $20m Series A backed by Andreessen Horowitz, a $47m Series B and a $100m Series B.
Two problems. The components add to £17bn, not the £18bn in the headline — a rounding artefact, but on a market slide any arithmetic that does not reconcile invites the reader to check everything else. And the three funding comparables are unnamed. An investor cannot verify a logo-free "$47m Series B", and naming the US food-creator marketplaces would have made the "this category is being validated" argument concrete rather than decorative. There is also no SAM or SOM anywhere: the deck jumps from an £18bn TAM to company projections with nothing in between.
Slide 12 — Versus food delivery platforms
Two 2×2 quadrant charts, one for metropolitan hubs and one for non-metropolitan hubs, on price and quality axes, with the punchline that Deliveroo's average meal price is £9–£15 against HomeCooks' £5–£8, and that HomeCooks delivers to the whole of the UK. The geographic argument is the real one: a nationally shippable frozen and ambient product structurally beats a courier network outside city centres. That deserved to be the headline instead of a self-drawn quadrant where the company sits in the empty corner by construction. Every 2×2 in every deck puts the company in the top-right; investors discount them automatically. The postcode-coverage argument, they cannot discount.
Slide 13 — Versus meal kits
A variety-and-convenience comparison: HomeCooks with 200+ dishes at 5–10 minutes prep, a competitor tier at 75+ dishes and 10–45 minutes, another at 50+ dishes and 20–45 minutes, plus "we're just getting started — 500+ by the end of 2023." Prep time is the correct axis to compete on against meal kits and this is a clean, honest slide. Note the "500+ dishes by end of 2023" commitment; slide 21 restates the same target as Q4 2024.
Slide 14 — Food waste
Four supply-chain mechanics: orders in advance, smart ordering that scales chefs up slowly, frozen storage extending shelf life, and small-batch cooking of one to two dishes at a time. Context at the bottom: £1bn+ of food wasted per year in UK food service, 5% of a typical restaurant's food costs lost to operational inefficiency. This is a good operational slide. The headline claim — a supply chain "designed to produce zero food waste" — is an overclaim that the deck itself softens on slide 24 to "much less food is wasted." Pick the defensible version and use it in both places.
Slide 15 — Chef economics
Three creator archetypes with monthly revenue and volume: amateurs and hobbyists at £0.6k–£0.8k on 100 dishes, professional chefs at £3k–£4.8k on 500 dishes, micro brands at £6.5k–£8.5k on 1,000+ dishes. A pie chart splits the current base into micro brands 39%, professional chefs 29%, amateurs 23% and other 9%. A note claims 500,000 food creators in the UK across the three types.
The dish-level maths is internally consistent at roughly £6–£9 per dish across all three tiers, which is a good sign that these are observed numbers rather than invented ones. But this slide quantifies exactly one side of the economics. Nowhere in 25 slides does the deck state HomeCooks' commission, take rate, gross margin, CAC, contribution per order or burn. A marketplace deck that tells you precisely what the supply side earns and nothing about what the platform keeps has answered the wrong question.
Slide 16 — Supply growth
Active food creators by quarter: 28, 45, 56, 85, 129. Alongside it, a low-churn claim with an honest caveat — chefs rarely churn by choice, and HomeCooks occasionally removes chefs whose quality scores fall below 4 out of 5. Volunteering that you cull suppliers on quality is a credibility gain and it explains the churn number instead of hiding it. The gap between 129 active and 900+ waiting is the most investable fact in the deck.
Slide 17 — Network effects
A loop diagram: new food creators and new dishes bring their own user bases, which increases engagement and conversion, which drives more orders, which encourages existing chefs to develop new dishes. The claim is that this makes the model defensible and fast-scaling. The supply-brings-demand mechanic is real for creator marketplaces, but the deck asserts it rather than evidencing it. One number — the share of new eaters who arrive through a chef's own audience — would turn the diagram into proof. That number exists, incidentally, on slide 19.
Slide 18 — Social features
Roadmap product: chef profiles and menus, eater discovery, direct messaging between eaters and chefs, and community feeds showing what neighbours are ordering. Positioned as increasing defensibility, engagement and virality. This is the weakest slide in the deck — four unbuilt features presented with the same visual weight as the traction slide. In a marketplace still at 129 suppliers, social feeds are a 2025 problem.
Slide 19 — Acquisition mix
A pie chart of channels: eater referral 33.3%, paid online 19%, creator referral 14.3%, influencer 14.3%, social 11.4%, offline direct 7.6%. The narrative is that chefs are incentivised to bring their own customers, which subsidises CPA and makes the model healthier than traditional meal-kit companies.
Nearly half of acquisition being referral is a genuinely strong result and it is the evidence slide 17 needed. But look at those percentages: 33.3% is exactly one third, and 14.3% is exactly one seventh, twice. Numbers like that come from a very small denominator — the pattern is consistent with a sample in the low tens, most likely a survey rather than tracked attribution. The deck also claims "a quick user payback" in the slide headline and then never states the payback period, the CPA or the LTV. If you claim payback, print the number of months.
Slide 20 — Team, investors and advisors
Josh Magidson, founder and CEO, previously founded the online takeout marketplace Eatstudent, which was acquired by Just Eat, and then Zing Zing, described as the largest Chinese food delivery chain in the UK. Six named team members: Alex Waddingham (Partner Growth, ex Abel & Cole), Nick Collins (Operations Lead, ex Yo! Sushi), Selin Erkut (Community), Charlotte Litman (Product), Dusan Koutny (CTO, non-exec) and Miao Chen (Head of Growth). Investors and advisors: SpeedInvest, Love Ventures, Daniel Murray-Serter (founder, Heights), Laurens Groenendijk (founder, Just Eat), Leonard Picardo (founding team, Deliveroo) and Islington Council.
This is a top-decile team slide for a company at this revenue: a founder with a marketplace exit in exactly this category, operators from relevant food businesses, institutional investors already on the register and advisors from Just Eat and Deliveroo. One flag, and it is a real one — the CTO is marked non-executive. The next twelve months on slide 21 are an app release and a social feed. A part-time technical leader against a technical roadmap is the question this slide invites, and it is better answered on the slide than in the room.
Slide 21 — Next 12 months
Three focus areas: UK growth to £150k monthly revenue by Q2 2024 and 500 active meals by Q4 2024; new tech releases with a social feed in Q3 2024 and an app in Q2 2024; and a team build of five key hires in growth, tech and product, "ready for Series A."
Here is where the deck damages itself. Slide 6 already reports a Q4 2023 run rate of £158k. If a reader takes that as monthly, the headline twelve-month goal was beaten before the deck was made. If they take it as quarterly — which the chart's shape supports — then the Q2 2024 target implies tripling monthly revenue in two quarters, a far more aggressive plan than the slide's calm presentation suggests. The deck never defines which, so the single most important goal in it is ambiguous. Meanwhile "500 active meals by Q4 2024" restates as a 2024 target the same 500+ dishes that slide 13 promised by the end of 2023.
Slide 22 — Five-year projection
A route to a "£500m revenue business": 2024 at £682k revenue, 400 active chefs, 59k orders, £1.8m transaction value; 2025 at £5.6m, 1.3k chefs, 459k orders, £14.2m TV; 2026 at £36m, 2.4k chefs, 2.7m orders, £87m TV; 2027 at £161m, 23k chefs, 11.8m orders, £388m TV; 2028 at £556m, 57k chefs, 40m orders, £1.35b TV.
Three observations. First, the projections contradict the traction. Full-year 2024 revenue of £682k is below the annualised run rate implied by the Q4 2023 bar on slide 6 under either reading, and it sits awkwardly beside a slide-21 target of £150k per month. Second, and much more interesting: divide revenue by transaction value in every single year and you get an implied take rate of 38–41%. That number appears nowhere in words. A deck that opens by calling itself "the Etsy of food" — Etsy's take rate is high single digits — is modelling a rate at the top of what Deliveroo charges restaurants. Either the model is really a food business with cost of goods inside revenue, in which case say so, or the positioning and the spreadsheet disagree. Third, 57k active chefs in 2028 is 11% of the 500,000 UK food creators counted on slide 15, while the same slide-22 column also promises global expansion. The population and the plan are not reconciled.
Slides 23–25 — Feel Good Food, social impact, contact
A statement slide ("This is Feel Good Food"), then a dense text slide on social impact: chefs earning more than minimum-wage delivery work, 70% of HomeCooks chefs female against an ONS figure of 17% of professional chefs, equal opportunity for food entrepreneurs with almost no upfront cost, community initiatives, compostable packaging supplied through a deal with BioPack, and reduced food waste. Then a contact slide: "For further information, get in touch at josh@homecooks.app."
The 70% versus 17% comparison is the strongest fact on the impact slide because it is a measured internal number against a named external source — the only citation in the entire deck. For a crowdfunding audience this section is not decoration; retail investors buy the mission. But the deck ends on an email address. No ask, no valuation, no use of funds, no round structure.
What this deck does better than most startup pitch decks
It leads with revenue. Slide 6 of 25, six quarters of actual numbers, before any problem or market framing. Most decks at this stage bury traction at slide 14. · The one-liner is instantly legible. "We are the Etsy of food" plus one clarifying sentence does more work than three slides of description. · Both sides of the marketplace get a how-it-works slide. Slides 4 and 5 are symmetric, four steps each, and together they remove almost every basic operational question. · Supply economics are quantified by segment. Slide 15 gives three creator archetypes with revenue and volume ranges that reconcile to a consistent per-dish figure. · It volunteers unflattering operational detail. Admitting on slide 16 that chefs are removed when quality scores drop below 4/5 makes the low-churn claim believable instead of suspicious. · The competitor set is named. Deliveroo, Uber Eats, HelloFresh, ready meals — with an actual price comparison, not an abstract quadrant alone. · The team slide earns trust in one glance. A founder who sold a marketplace to Just Eat, plus named institutional investors and Deliveroo and Just Eat advisors, is credibility you cannot manufacture. · The waiting list is a real asset. 900+ food brands queued behind 129 active ones tells an investor the growth constraint is operational, not demand-side.
Where this deck would fail in an investor meeting
No ask, anywhere. Understandable for a Seedrs campaign page, fatal for the PDF as it now travels. Add one slide: amount, valuation, use of funds, milestone it buys. · No platform economics. Chef revenue is on the slide; take rate, gross margin, CAC, payback and burn are not. The 38–41% take rate is only recoverable by dividing two numbers on slide 22. · Revenue units are undefined. Whether £158k is a quarter or a month changes the interpretation of slides 6, 21 and 22, and the deck never says. · Slide 21 contradicts slide 6. A twelve-month revenue goal that sits at or below the current run rate reads as either an error or a lack of ambition. · Slide 22 contradicts slide 21. £682k of 2024 revenue against a £150k monthly target for Q2 2024 cannot both be the plan. · The dish target slipped silently. 500+ dishes by end of 2023 on slide 13 becomes 500 by Q4 2024 on slide 21, with no acknowledgement. · The acquisition percentages suggest a tiny sample. Exact thirds and sevenths need a denominator printed next to them. · Nothing is sourced. The 60%/80% failure rates, the £18bn market, the £1bn waste figure and three unnamed US funding rounds all arrive without a citation. The ONS reference on slide 24 proves the team knows how to cite. · The £18bn market components add to £17bn. Small, but it is the first thing a numbers-minded reader checks. · A duplicate tile on the traction grid. Average basket value twice, in eight of the most valuable rectangles in the deck. · Non-exec CTO against a technical roadmap. An app in Q2 2024 and a social feed in Q3 2024 need a full-time technical owner named on the slide. · Unbuilt social features get a full slide. Slide 18 spends prime real estate on 2025 features while gross margin has no slide at all.
Crowdfunding deck versus VC seed deck
The ask Absent — lives on the campaign page Explicit slide: amount, valuation, use of funds
Unit economics Chef-side only Take rate, gross margin, CAC, payback, contribution
Mission and impact Three slides, closes the deck One line, usually on the cover
Traction Slide 6, six quarters, strong Same — this part already works
Projections Five years to £556m, decoupled from current run rate Three years, reconciled to the last actual quarter
Sources One (ONS), on slide 24 Footnoted on every external number
Roadmap Feature-led (app, social feed) Milestone-led (what this round proves)
Reader Hundreds of £100–£5,000 cheques One partner who will model it in a spreadsheet
How you would rebuild this deck in a weekend
Define the revenue unit on slide 6. Write "quarterly revenue, £" on the axis and give the run-rate bar its own colour and a footnote defining the calculation. This single fix removes the ambiguity that undermines two later slides. · Replace the duplicate basket-value tile with take rate or gross margin. You already have the number — it is implied at 38–41% on slide 22. Print it. · Reconcile 6, 21 and 22 on one page. Last actual quarter, next twelve months, then the five-year path, in the same units, in the same place. If 2024 lands at £682k, show why the run rate does not simply annualise. · Add an ask slide before contact. Amount, instrument, valuation, four use-of-funds buckets and the specific milestone the money buys — for example, chefs from 129 to 400 and the Q2 2024 app release. · Promote the waiting list to a headline. "129 active chefs. 900+ waiting." is a full slide, not a caption inside a shape. · Replace the 2×2 on slide 12 with the coverage map. "We deliver to the whole of the UK; they cover metropolitan postcodes" is the defensible claim. A self-drawn quadrant is not. · Cut slide 18 or shrink it to a roadmap bullet. Unbuilt social features do not deserve equal weight with six quarters of revenue. · Footnote every external number. Source and year for the failure rates, the £18bn market, the £1bn waste figure, and names for the three US funding comparables. Fix the £17bn/£18bn discrepancy while you are in there. · Print the denominator on slide 19. "Attribution across n new customers, Q3 2023" turns a suspicious pie chart into evidence, and add the payback period you already claim. · Resolve the CTO question on the team slide. Either make the technical hire one of the five named roles on slide 21 or explain the non-exec arrangement in a line.
The transferable lesson
HomeCooks has the hardest thing to get: a real two-sided business with six quarters of compounding revenue, a supply queue seven times bigger than its active base, and a founder who has sold a marketplace in this exact category before. Almost nothing in this teardown is about the business. It is about the fact that three different slides in the same 25-slide file describe three different futures, and that the number an investor most wants — what the platform keeps on each order — is only obtainable by dividing one column of a projection table by another.
That is the most common failure mode in decks built by companies that are actually working. The traction slide is written by whoever pulled the dashboard, the roadmap slide by whoever runs planning, and the projection slide by whoever built the model. Each is defensible alone. Read end to end by a stranger, they disagree, and disagreement between your own slides costs more credibility than a weak number ever does — because a weak number is a fact about the market, while a contradiction is a fact about you.
Before you send your deck anywhere, do the thing HomeCooks did not: read it as one document, in one sitting, out loud, and check that every number on every slide can be reconciled with every other number. Then check what an investor learns about your economics if they only have the PDF and no campaign page beside it.
Frequently asked questions
- What is HomeCooks?
- HomeCooks, operated by Juno Food Ltd, is a UK two-sided marketplace where independent food creators cook pre-prepped meals in bulk and the platform handles pickup, frozen storage and dispatch to customers nationwide. The deck positions it as 'the Etsy of food', with meals at GBP 5-8 versus GBP 9-15 on delivery apps, shipped ambient or frozen so it can serve the whole of the UK rather than metropolitan postcodes only.
- Is the HomeCooks deck a pitch deck for investors?
- It is an equity crowdfunding deck. The PDF's internal title is 'Seedrs Deck - HomeCooks', created in Canva in November 2023 by founder Josh Magidson. That means it was designed to sit next to a Seedrs campaign page that already displayed the raise amount, valuation and use of funds, which is why the deck itself contains no ask slide and ends on a contact email.
- How much traction did HomeCooks show in its deck?
- The traction slide reports revenue growing across six quarters from GBP 10k in Q3 2022 to a GBP 158k run rate in Q4 2023, plus 6,000+ customers, 50,000+ meals ordered, a GBP 40 average basket, 100+ active chefs, 200+ available meals and a claimed 24% average monthly growth. A separate slide shows active food creators rising from 28 to 129 over five quarters, with 900+ food brands on the waiting list.
- What is wrong with the HomeCooks pitch deck?
- Three structural problems. There is no ask, valuation or use of funds anywhere in the 25 slides. There are no platform economics - no take rate, gross margin, CAC or payback - only chef-side revenue. And the traction, twelve-month roadmap and five-year projection slides imply three different versions of 2024, because the revenue chart never states whether its figures are monthly or quarterly.
- Which HomeCooks slides should founders copy?
- Slide 3, which explains the whole business in one analogy plus one sentence. Slides 4 and 5, symmetric four-step explanations of how the marketplace works for each side. Slide 6, which puts real revenue at position six rather than burying it. And slide 16, which volunteers that HomeCooks removes chefs scoring below 4/5 - unflattering detail that makes the low-churn claim believable.
- What take rate does the HomeCooks deck imply?
- The deck never states one. But the five-year projection lists both revenue and transaction value for every year: GBP 682k on GBP 1.8m in 2024, GBP 5.6m on GBP 14.2m in 2025, and GBP 556m on GBP 1.35b in 2028. Dividing one by the other gives an implied take rate of 38-41% throughout - roughly what Deliveroo charges restaurants, and several times Etsy's rate, despite the Etsy positioning on slide 3.