ACV, ARPU and Average Order Value in a Pitch Deck: 12 Real
How to state revenue per customer on a pitch deck: ACV, average deal size, ARPU or average order value, averaged over which customers, for which period.
ACV, ARPU and Average Order Value in a Pitch Deck: Say What Is Averaged, Over Whom, and For What Period
Pitch decks often give one figure for how much each customer pays: "173k ACV", "Deal size $10K → $30K", "335€ ARPU", "$80 average order value". Each of these is an average, and a reader needs to know what was added up, what it was divided by, and over what period. This guide compares twelve real slides on those points and checks each figure against the other numbers on the same slide.
TL;DR
Name the measure (annual contract value, average revenue per user, average order value), the customers it averages over, the period, and whether it is money the customer pays or revenue you keep. Humaans' template shows average ACV by customer size, which is the clearest structure here. Cardinal Analytx gives an average annual price per customer for each product. DivvyCloud's "173k ACV" and Cirrus Identity's "$10K → $30K" don't say whether they average all customers, new deals or a recent period. Angeleno Artistry and ArtCorgi quote average order value, which is what the customer pays, not the company's revenue per order. On HealthJoy's and HomeCooks' slides the per-customer figures can't be reconciled with the revenue shown without a missing definition.
Revenue-per-customer figures on real pitch deck slides
Each example shows the exact stored slide above its analysis and links to the full teardown. Most fully defined first. Figures are quoted as shown; calculations are ours.
Humaans traction slide — slide 3
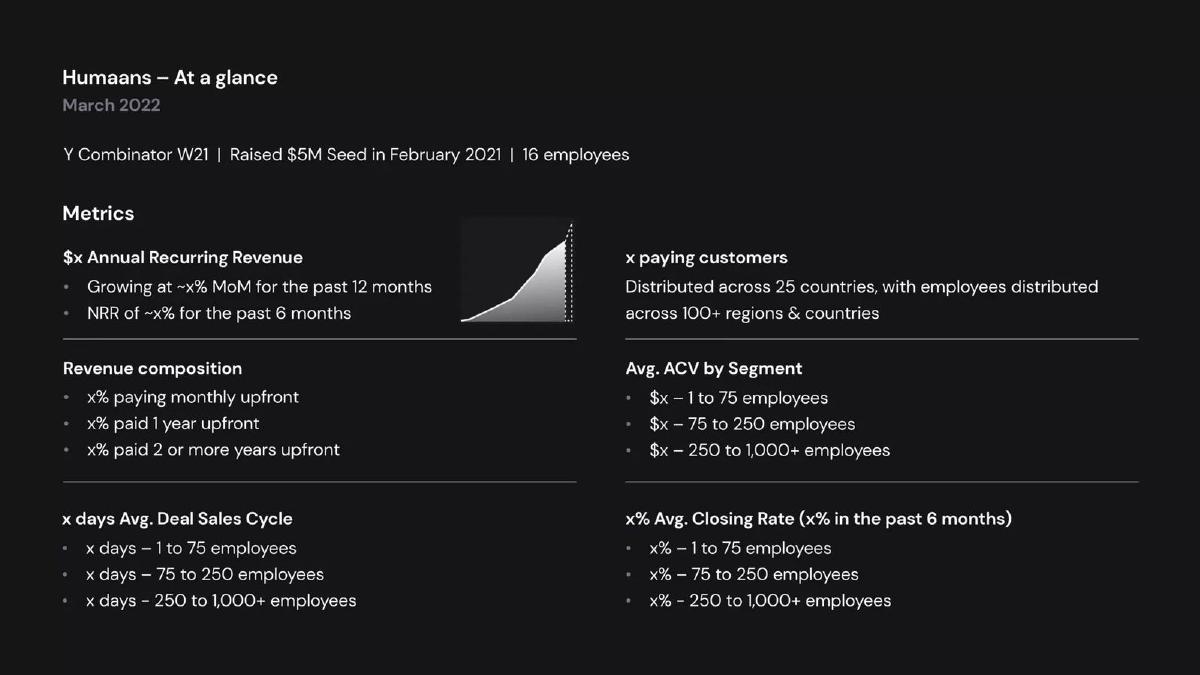
HR software, seed-stage company. An "At a glance" metrics slide dated "March 2022", circulated with figures replaced by x.
Humaans deck, slide 3. Exact stored slide matched to this analysis.
Our analysis: The clearest structure in this set: an average broken down by segment, with the slide dated.
Evidence and limitation: The figures are redacted, so only the structure can be assessed. ACV is split by customer size, and the same three segments are used for sales cycle and closing rate, so a reader could connect deal size with how long each size takes to close. The payment-term split tells the reader how much of the contract value has been collected upfront.
What a founder can adapt: Give ACV by segment with the customer count in each, and the date.
Supporting analysis
What the deck claims: "Avg. ACV by Segment: $x – 1 to 75 employees; $x – 75 to 250 employees; $x – 250 to 1,000+ employees." "Revenue composition: x% paying monthly upfront; x% paid 1 year upfront; x% paid 2 or more years upfront." Also ARR, paying customers, MoM growth, NRR, sales cycle and closing rate by the same segments.
Presentation choice: A single average across 10-person and 1,000-person customers could describe almost any mix. Segment averages show where revenue actually comes from.
When it does not fit: Don't present a single blended ACV when customer sizes differ widely.
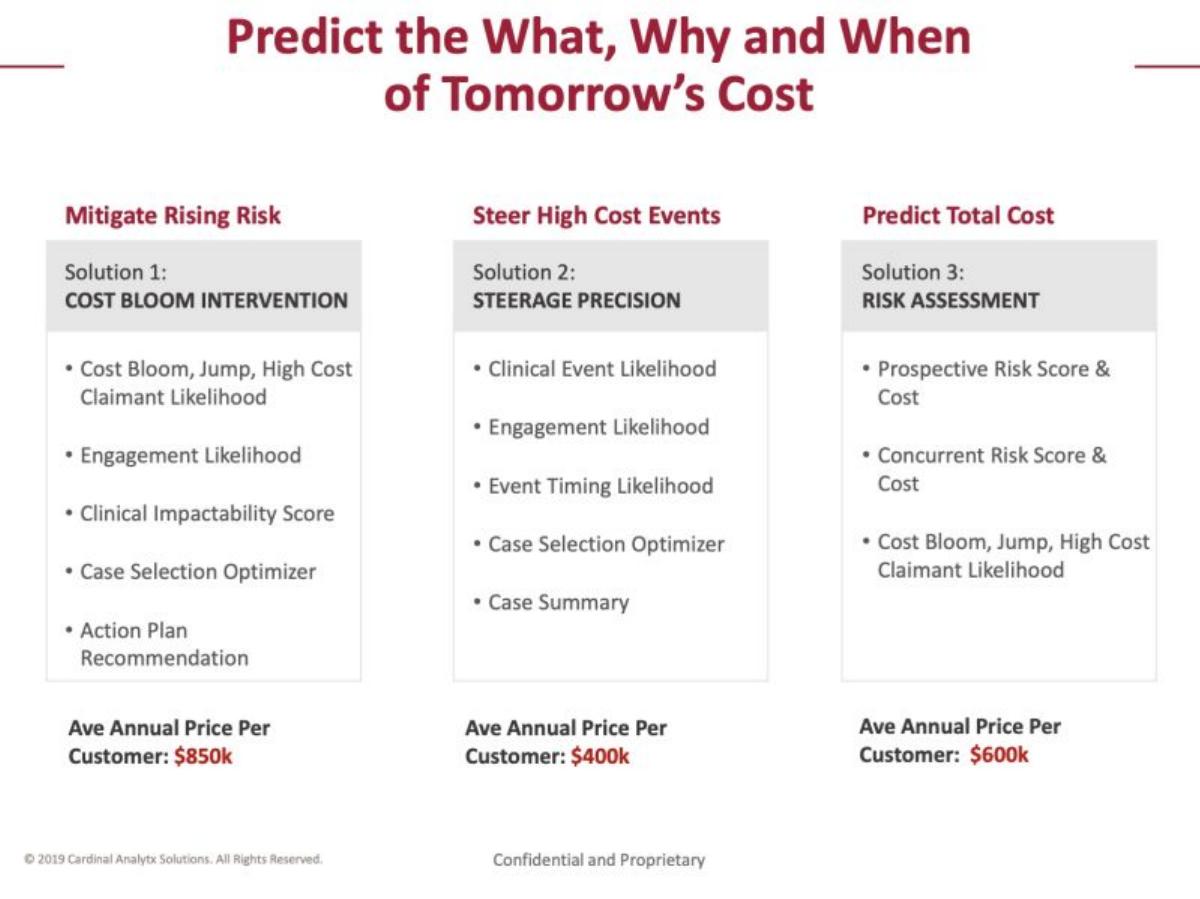
Cardinal Analytx deck, slide 4. Exact stored slide matched to this analysis.
Our analysis: A per-product annual price, clearly periodised, with the basis unstated.
Evidence and limitation: Each figure is annual and tied to one product. The slide doesn't say whether these are averages of signed contracts, list prices, or expected prices, nor how many customers each average covers. It also doesn't say whether customers buy more than one product, which would matter for revenue per customer overall.
What a founder can adapt: "Average annual contract value, Solution 1: $850k across [n] signed customers." Or label them as list prices.
Supporting analysis
What the deck claims: "Solution 1: Cost Bloom Intervention … Ave Annual Price Per Customer: $850k." "Solution 2: Steerage Precision … $400k." "Solution 3: Risk Assessment … $600k."
Presentation choice: For enterprise buyers, a per-product figure helps a reader see which product carries the revenue.
When it does not fit: Don't mix list prices and contracted averages without saying which.
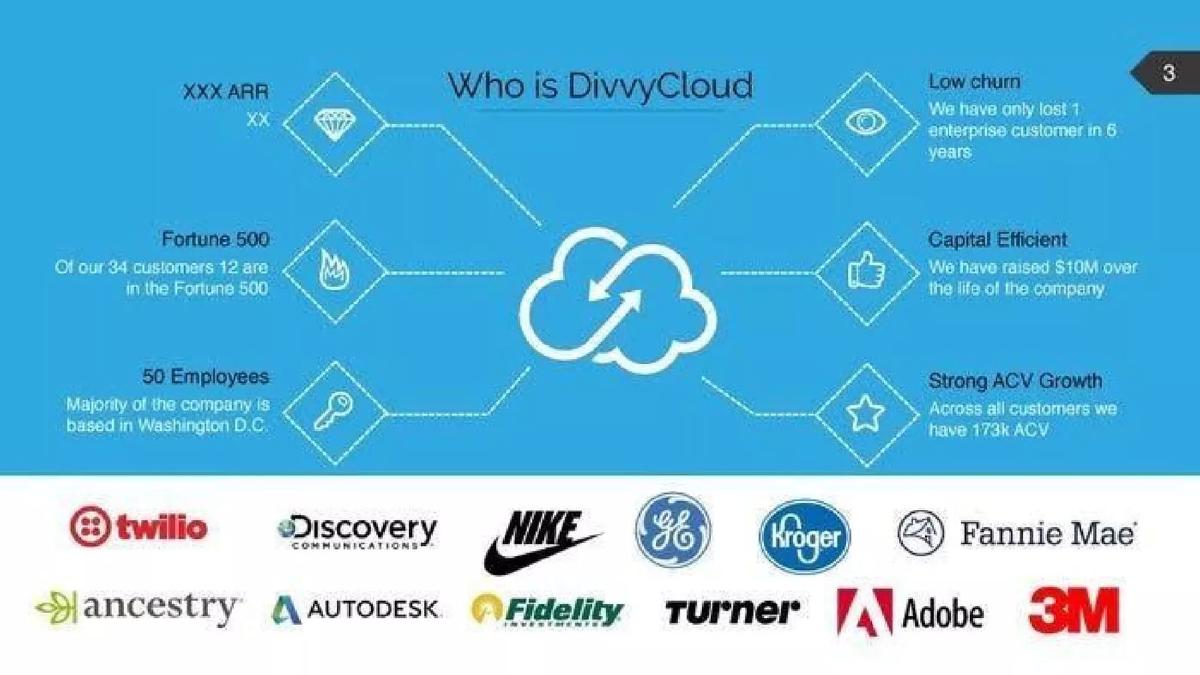
Cloud security software. A "Who is DivvyCloud" summary with six callouts and customer logos.
DivvyCloud deck, slide 3. Exact stored slide matched to this analysis.
Our analysis: A defined population (all customers, 34) with the growth claim unsupported by a second point.
Evidence and limitation: "Across all customers" suggests the average covers every current customer. If 173k is the mean annual contract value across 34 customers, total annual contract value would be about 34 × $173k ≈ $5.9M; that is our calculation, and the ARR figure is redacted so it can't be compared. The heading says "growth", but only one value is shown, with no earlier figure or date.
What a founder can adapt: "Average ACV $173k across 34 customers (median $[x]), up from $[y] a year ago."
Supporting analysis
What the deck claims: "XXX ARR" (redacted). "Of our 34 customers 12 are in the Fortune 500." "Strong ACV Growth: Across all customers we have 173k ACV." "We have only lost 1 enterprise customer in 6 years."
Presentation choice: Giving the customer count beside the average lets a reader estimate the total. With 12 Fortune 500 customers, the average may be pulled up by a few large contracts.
When it does not fit: Don't title a single figure "growth".
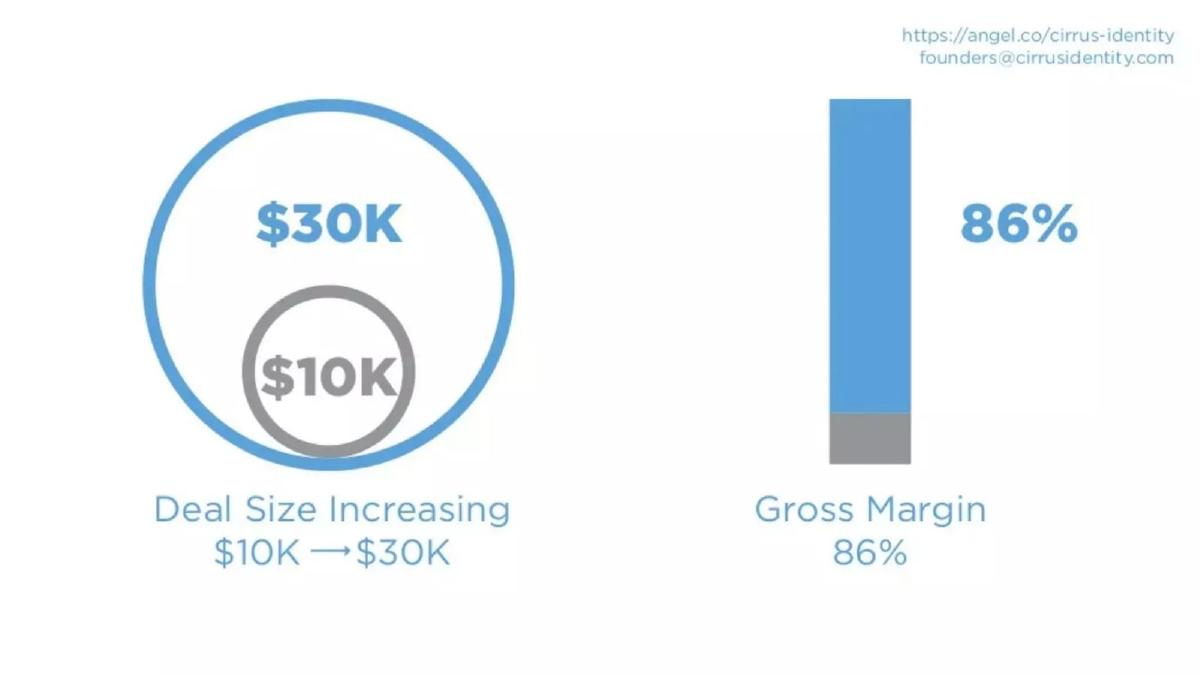
Identity software for universities, seed. Two large figures on one slide.
Cirrus Identity deck, slide 6. Exact stored slide matched to this analysis.
Our analysis: A clear direction with no period and no definition.
Evidence and limitation: The change is threefold, but the slide doesn't give the dates of either figure, whether each is an average, a typical deal or the largest deal, or whether $30K is annual. It also doesn't say whether $30K comes from new customers or from existing customers buying more.
What a founder can adapt: "Average new-deal ACV: $10K (2016) → $30K (last two quarters, [n] deals)."
Supporting analysis
What the deck claims: "Deal Size Increasing $10K → $30K." "Gross Margin 86%."
Presentation choice: A threefold increase in deal size is a strong claim if it's an average across many new deals in a recent period, and a weak one if it's a single recent deal.
When it does not fit: Don't show a before-and-after figure without dates and a count.
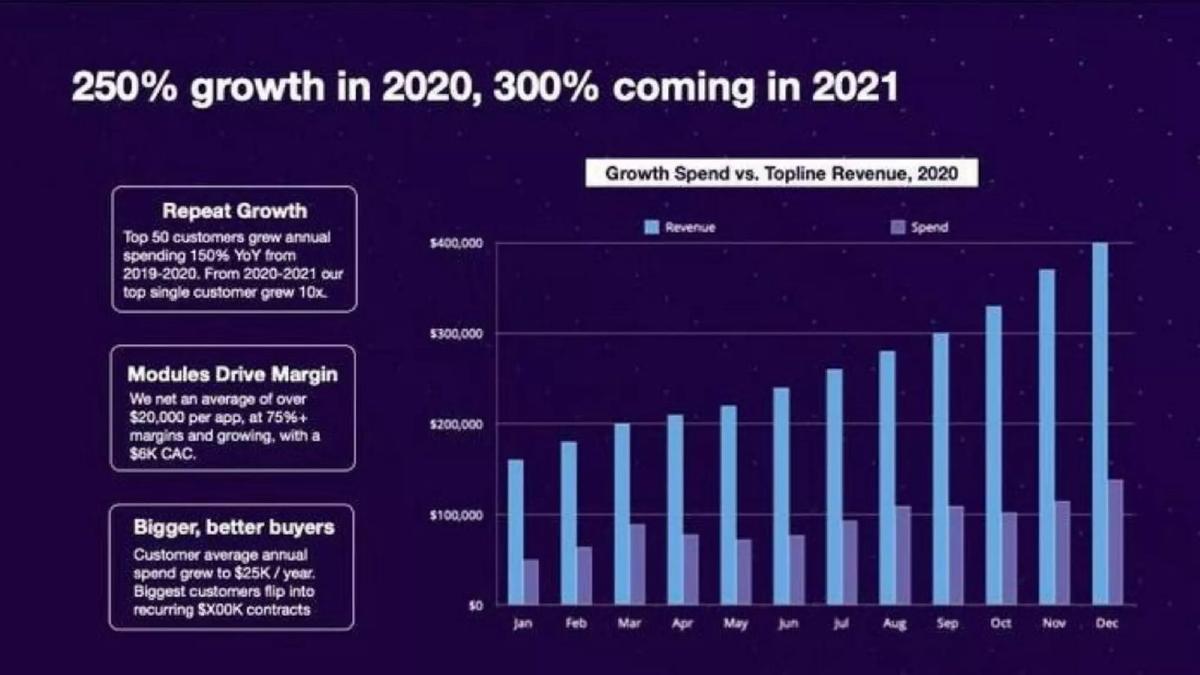
App development platform. A 2020 monthly revenue and spend chart with three boxes.
Crowdbotics deck, slide 5. Exact stored slide matched to this analysis.
Our analysis: Useful to show both a per-project and a per-customer figure, but neither has a stated period or base.
Evidence and limitation: Two different averages appear: per app ($20,000+, and "net" isn't defined) and per customer per year ($25K). If both use the same revenue, a customer would buy about 1.25 apps a year; that is our inference. "Grew to" has no starting value or period. The top-50 growth figure describes a selected group, not all customers.
What a founder can adapt: "Average revenue per app $20K (2020, [n] apps); average annual spend per customer $25K (2020, [n] customers), up from $[x] in 2019."
Supporting analysis
What the deck claims: "We net an average of over $20,000 per app, at 75%+ margins and growing, with a $6K CAC." "Customer average annual spend grew to $25K / year. Biggest customers flip into recurring $X00K contracts." "Top 50 customers grew annual spending 150% YoY from 2019-2020." Chart "Growth Spend vs. Topline Revenue, 2020", Jan to Dec, revenue bars rising from about $160,000 to about $400,000.
Presentation choice: For project-based revenue, value per project and spend per customer per year are both relevant and are easy to confuse.
When it does not fit: Don't use "net" without saying what is deducted.
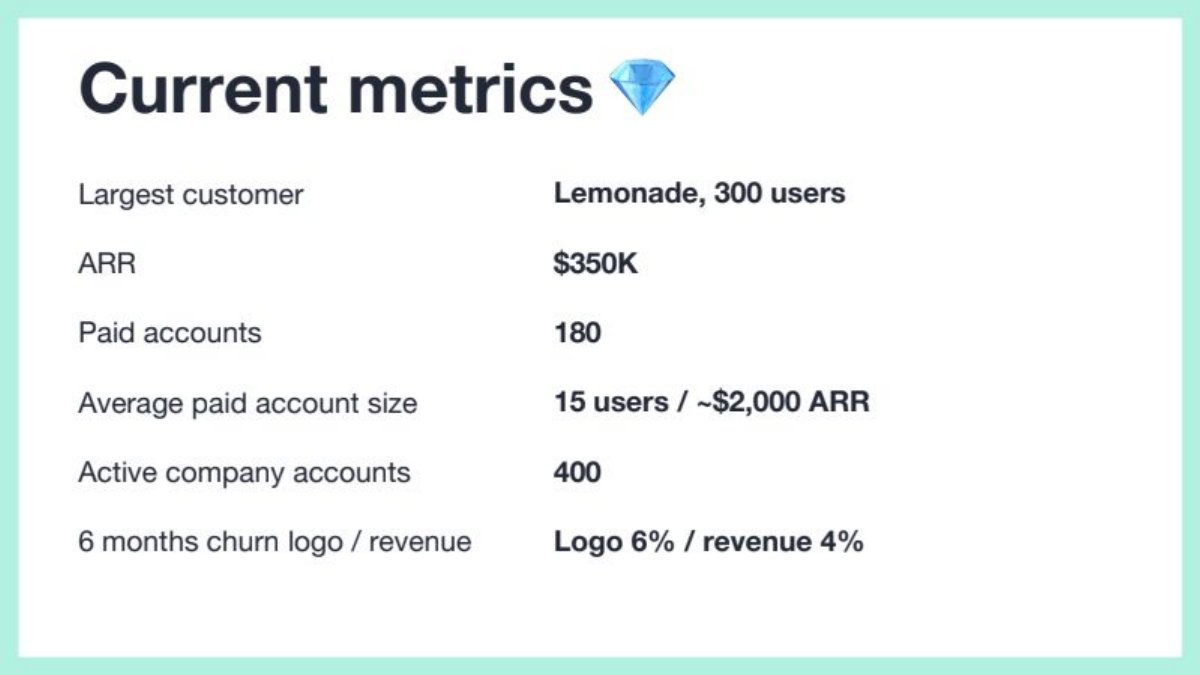
Work-management software, seed. A "Current metrics" table.
Fibery deck, slide 12. Exact stored slide matched to this analysis.
Our analysis: Names the biggest customer and puts it beside the average, but in a unit (users) that can't be turned into a revenue share.
Evidence and limitation: The largest customer is named and sized in users, not in revenue. The slide gives no price per user, so Lemonade's share of the $350K ARR can't be calculated from what is shown; we don't estimate it. 180 × ~$2,000 ≈ $360K, close to the stated ARR, so the average is consistent with the total. Lemonade has 20 times the users of an average account, and the slide doesn't say whether it pays on the same terms.
What a founder can adapt: "Largest customer: Lemonade, 300 users, $[x] ARR = [y]% of $350K ARR (as of [date])."
Supporting analysis
What the deck claims: "Largest customer: Lemonade, 300 users." "ARR: $350K." "Paid accounts: 180." "Average paid account size: 15 users / ~$2,000 ARR." "Active company accounts: 400." "6 months churn logo / revenue: Logo 6% / revenue 4%."
Presentation choice: Placing the largest account next to the average account shows the reader the spread; giving it in users rather than revenue leaves the dependence question open.
When it does not fit: Don't size your largest customer in a different unit from your revenue total.
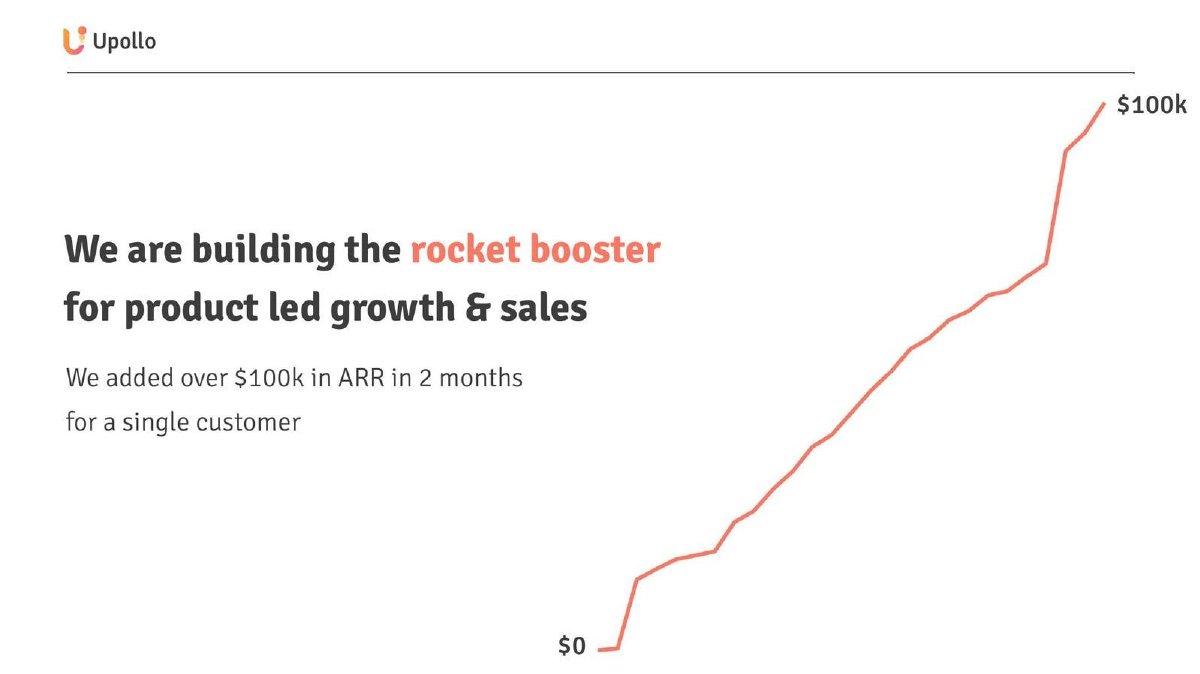
Product-led growth analytics software. A single-claim slide with an unlabelled rising line from $0 to $100k.
Upollo deck, slide 4. Exact stored slide matched to this analysis.
Our analysis: One customer's result as the headline, with the denominator missing.
Evidence and limitation: The numerator (over $100k ARR, one customer) and a duration (2 months) are stated, but not the dates or Upollo's total ARR, so the reader can't tell whether this customer is a small part of revenue or nearly all of it. The chart has no time axis. The slide also reads as a customer result (ARR added for the customer), not only as revenue to Upollo; it doesn't say which.
What a founder can adapt: "[Customer] added $100k+ ARR in 2 months ([dates]). Upollo revenue from [customer]: $[x], [y]% of total ARR."
Supporting analysis
What the deck claims: "We are building the rocket booster for product led growth & sales." "We added over $100k in ARR in 2 months for a single customer."
Presentation choice: A single large win is persuasive, but without total revenue a reader can't tell a proof point from a dependency.
When it does not fit: Don't make one customer the whole story without saying how much of your revenue it is.
Mobile barber service in London. "Company numbers for the first year", dated 2019.
Get Groomed deck, slide 5. Exact stored slide matched to this analysis.
Our analysis: A named, periodised average, next to totals that can't be reconciled with it.
Evidence and limitation: The average is per customer and the period is the first year. The "£2000" figure isn't labelled. If it is total revenue, £2,000 ÷ £31.50 ≈ 63 paying customers, far fewer than 1,000 registered, so the average would be over paying customers only; and £2,000 across 600+ services would be about £3.33 per service, which seems low for a haircut. The slide doesn't say which is meant. The lifetime value (£32) is almost the same as first-year revenue per customer (£31.50), which fits with only 25% booking twice.
What a founder can adapt: "£31.50 average revenue per paying customer, first year ([n] paying customers, £[x] revenue)."
Supporting analysis
What the deck claims: "1K+ customers registered on our platform." "380 completed missions." "600+ services provided." "reached a mark of £2000." "£31.50 of average revenue per customer." "25% of customers booked more than one time." "Customer acquisition cost: £4." "Customer Lifetime value: £32."
Presentation choice: Registered users, paying customers and services are different counts. Revenue per customer depends on which one is the denominator.
When it does not fit: Don't put an unlabelled total beside an average.
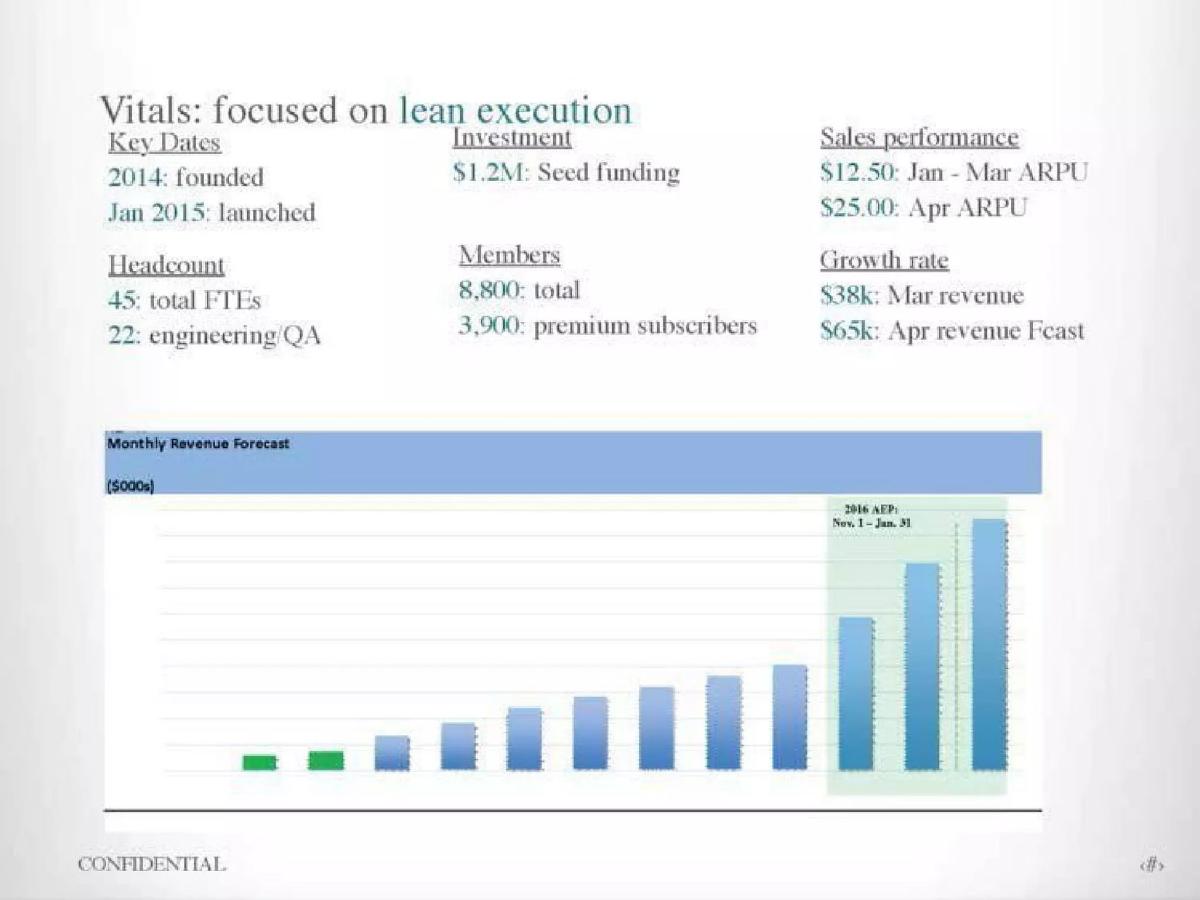
Healthcare navigation app. A "Vitals" slide with a monthly revenue forecast chart.
HealthJoy deck, slide 3. Exact stored slide matched to this analysis.
Our analysis: A doubling ARPU whose base and period can't be recovered from the slide.
Evidence and limitation: Neither ARPU period nor its denominator is stated. If $12.50 is monthly revenue per premium subscriber, 3,900 × $12.50 ≈ $48,750 a month, above March revenue of $38k; across all 8,800 members it would be about $110,000. Neither matches, so ARPU must use some other base (for example new subscribers, or a partial period). April ARPU is given alongside an April revenue forecast, which suggests April was not complete; the slide doesn't say.
What a founder can adapt: "Monthly revenue per premium subscriber: $12.50 (Jan–Mar average); $[x] in April to date."
Supporting analysis
What the deck claims: "$12.50: Jan – Mar ARPU." "$25.00: Apr ARPU." "8,800: total" members. "3,900: premium subscribers." "$38k: Mar revenue." "$65k: Apr revenue Fcast." Chart "Monthly Revenue Forecast ($000s)" without axis values.
Presentation choice: When ARPU × users doesn't come close to revenue, a reader can't use either figure.
When it does not fit: Don't show an ARPU for a month that hasn't finished without saying so.
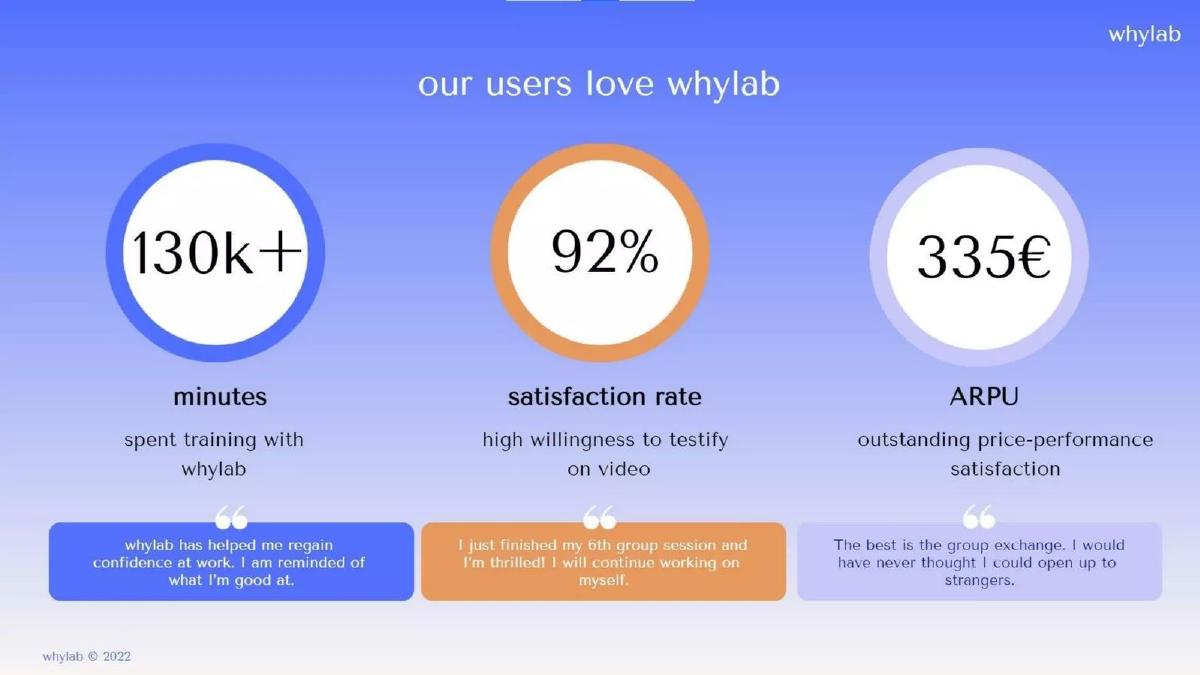
Whylab deck, slide 6. Exact stored slide matched to this analysis.
Our analysis: The standard abbreviation, with the two facts that make it usable left out.
Evidence and limitation: ARPU has no period (per month, per year, or per programme) and no denominator (all users or paying users). For a group-session product, 335€ per month and 335€ per programme are very different businesses.
What a founder can adapt: "335€ average revenue per paying user per programme (2022, [n] users)."
Supporting analysis
What the deck claims: "130k+ minutes spent training with whylab." "92% satisfaction rate." "335€ ARPU — outstanding price-performance satisfaction."
Presentation choice: ARPU is meaningless without a period; a reader will guess, and may guess wrong in either direction.
When it does not fit: Don't show ARPU without "per month" or "per year".
Online art sales from Los Angeles artists. A "Traction" bullet slide; launched September 2014.
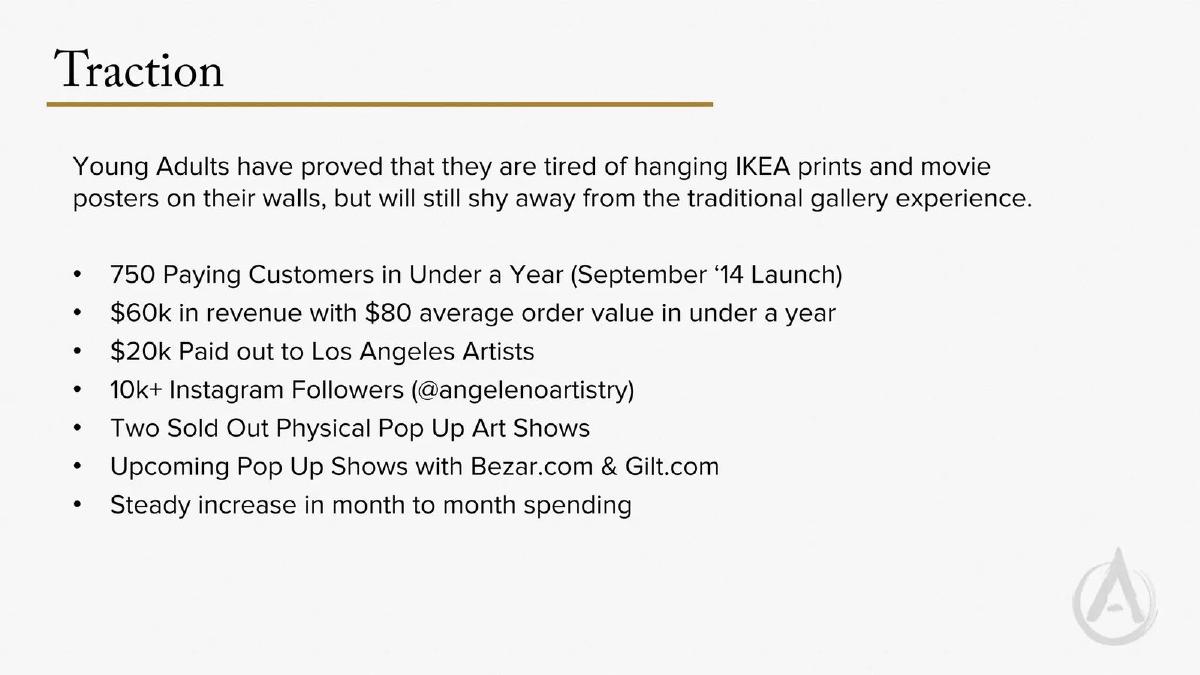
Angeleno Artistry deck, slide 3. Exact stored slide matched to this analysis.
Our analysis: The figures reconcile, and show that the average is per order on customer spend, not on the company's share.
Evidence and limitation: $60k ÷ $80 = 750 orders, the same as the number of paying customers, which implies about one order per customer. "Revenue" here seems to be what customers paid: $20k went to artists, so if that is the only payout, the company kept about $40k (our calculation). The slide doesn't say whether the $80 average is before or after artist payouts.
What a founder can adapt: "$80 average order value (customer spend); ~$53 kept per order after artist payouts; 750 orders from 750 customers."
Supporting analysis
What the deck claims: "750 Paying Customers in Under a Year." "$60k in revenue with $80 average order value in under a year." "$20k Paid out to Los Angeles Artists." "Steady increase in month to month spending."
Presentation choice: For anyone selling other people's goods, what the customer pays and what the company keeps are both needed.
When it does not fit: Don't call gross order value "revenue" without saying so.
Commissioned portrait marketplace. A "Numbers" slide with a before-and-after portrait.
ArtCorgi deck, slide 4. Exact stored slide matched to this analysis.
Our analysis: A clear average order and take rate, which together give revenue per order.
Evidence and limitation: If the 30% cut applies to the whole order, ArtCorgi keeps about $120 × 30% = $36 per order; that is our calculation. The slide doesn't say whether "revenue" in the reorder figure means total order value or ArtCorgi's cut, nor the period.
What a founder can adapt: "Average order $120 (customer spend); ArtCorgi keeps 30% ≈ $36; [period]."
Supporting analysis
What the deck claims: "18% of Revenue from Reorders." "Average order $120." "We take a 30% cut."
Presentation choice: Showing the take rate beside the average order lets a reader work out the company's revenue per order.
When it does not fit: Don't leave "revenue" ambiguous between order value and your cut.
Reusable whiteboard stickies, direct to consumer. Six tiles; the stored copy carries a BESTPITCHDECK.COM watermark, so it may be a redesigned version rather than the original deck.
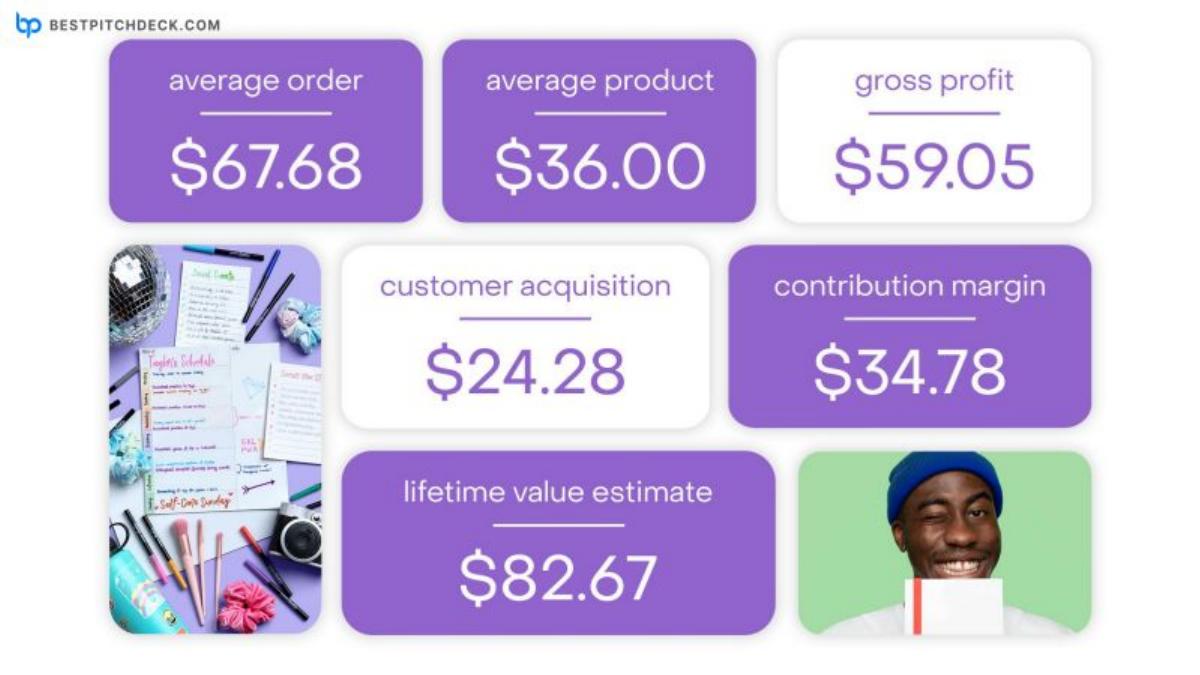
mcSquares deck, slide 2. Exact stored slide matched to this analysis.
Our analysis: The internal arithmetic checks, and the per-order chain from order value to contribution is easy to follow; the period and cost basis are missing.
Evidence and limitation: $67.68 ÷ $36.00 ≈ 1.9 products per order. $59.05 − $24.28 = $34.77, matching the contribution figure (to rounding), so contribution here subtracts acquisition cost from gross profit per order. Gross profit of $59.05 on a $67.68 order is about 87%, high for a physical product; the slide doesn't say what cost of goods includes or whether shipping is in the order value. No period is given for any average.
What a founder can adapt: Add the period and what cost of goods covers: "Q[x] [year]; COGS = product + fulfilment."
Supporting analysis
What the deck claims: "average order $67.68." "average product $36.00." "gross profit $59.05." "customer acquisition $24.28." "contribution margin $34.78." "lifetime value estimate $82.67."
Presentation choice: Laying out order value, gross profit, acquisition cost and contribution per order lets a reader follow the unit economics in one glance.
When it does not fit: Don't leave a very high product gross profit unexplained.
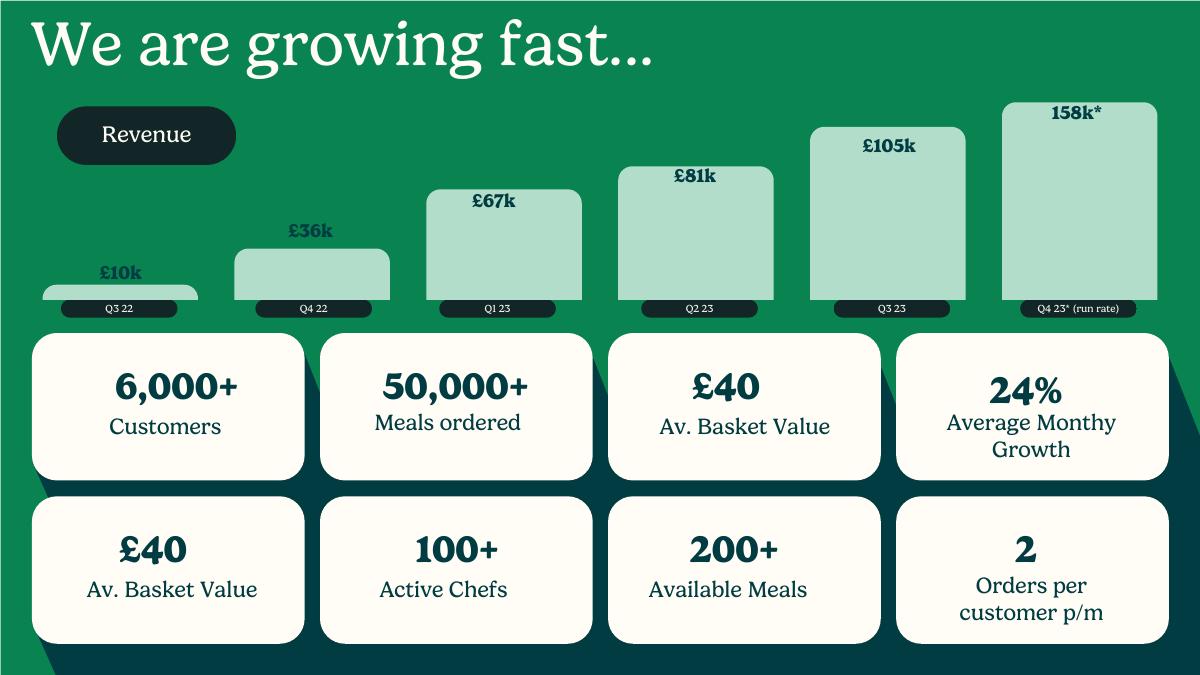
Home-cooked meal marketplace in the UK. Quarterly revenue bars and eight tiles; "£40 Av. Basket Value" appears twice.
HomeCooks deck, slide 6. Exact stored slide matched to this analysis.
Our analysis: Several per-customer figures that are each plausible but can't be combined as shown.
Evidence and limitation: If 6,000 customers each placed 2 orders a month at £40, that would be about £480,000 a month; Q3 23 revenue was £105k for the quarter, about £35,000 a month. So the figures must use different bases: 6,000 may be all customers ever, 2 orders a month may apply only to active customers, or revenue may be HomeCooks' commission rather than basket value. The slide doesn't say. Total revenue from Q3 22 to Q3 23 is £299k (our sum).
What a founder can adapt: "£40 average basket (customer spend); HomeCooks revenue = [x]% of basket; [n] monthly active customers ordering 2× a month."
Supporting analysis
What the deck claims: Revenue: Q3 22 £10k, Q4 22 £36k, Q1 23 £67k, Q2 23 £81k, Q3 23 £105k, "Q4 23* (run rate)" 158k*. "6,000+ Customers." "50,000+ Meals ordered." "£40 Av. Basket Value." "2 Orders per customer p/m." "24% Average Monthy Growth."
Presentation choice: A reader who multiplies the tiles gets a number more than ten times the revenue chart, which undermines the whole slide.
When it does not fit: Don't pair a cumulative customer count with a monthly order frequency.
Whether each slide names the measure, the customers averaged, the period and the revenue basis.
Example
Figure
Measure
Who is averaged
Period
Main gap
Humaans
$x by segment
ACV
Three size segments
March 2022 slide
Values redacted
Cardinal Analytx
$400k–$850k
Annual price per customer
Per product
Annual
Contracted or list?
DivvyCloud
173k
ACV
All 34 customers
Not stated
Growth shown with one point
Cirrus Identity
$10K → $30K
Deal size
Not stated
Not stated
Dates, count, annual?
Crowdbotics
$20K / $25K
Per app; per customer per year
Not stated
Not stated
"Net"; starting value
Fibery
300 users
Largest customer
One named customer
Not stated
Users, not revenue share
Upollo
$100k+ ARR
One customer's ARR
One customer
2 months, undated
No total ARR
Get Groomed
£31.50
Revenue per customer
Likely paying customers
First year
Unlabelled £2000
HealthJoy
$12.50 → $25
ARPU
Not stated
Not stated; April partial?
Doesn't reconcile with revenue
Whylab
335€
ARPU
Not stated
Not stated
Period
Angeleno Artistry
$80
Average order value
750 orders
First year
Before artist payouts
ArtCorgi
$120
Average order
Not stated
Not stated
Period; revenue basis
mcSquares
$67.68
Average order
Not stated
Not stated
Period; cost basis
HomeCooks
£40
Basket value
Not stated
Not stated
Doesn't combine with revenue
Key Takeaways
Use the standard name: ACV (annual contract value), ARPU/ARPA (average revenue per user or account, per month or year), or AOV (average order value).
Say who is in the average: all paying customers, new customers in a period, or one segment.
Give the period: ARPU per month and per year differ by twelve times.
Say whether the figure is what the customer pays or what you keep after payouts to sellers, artists or partners.
Averages hide spread; if a few large customers dominate, show the average by segment or give the median.
Check it: average × customer (or order) count should roughly match revenue for the same period.
If you name your largest customer, give its revenue, the total and the period, so the reader can see its share.
Write your revenue-per-customer line
Fill in each line before putting an average on a slide.
Measure. ACV, ARPU/ARPA, average order value or average new-deal size. Use the standard name.
Who is averaged. All current paying customers, new customers in a period, active users, or one segment. Give the count.
Period. Per month, per year, per order or per project; and the dates the average covers.
Revenue basis. What the customer pays, or what you keep after payouts to sellers, suppliers or partners.
Spread. If a few customers dominate, show averages by segment or give the median.
Largest customer. Revenue from your largest customer (and top 5) ÷ total revenue, for a stated period.
Check. Average × count ≈ revenue for the same period. If not, find the definition that differs.
Copyable framework: [Measure] of [amount] per [customer / user / order], [period], across [n] [customers / orders], on [customer spend / our revenue].
Illustrative example 1 — written by us
Before: 335€ ARPU
After: 335€ average revenue per paying user per [month / programme], [period], across [n] paying users.
What improved: Our illustrative rewrite; not Whylab's wording. Bracketed values are placeholders. It adds the period and the denominator, which ARPU needs to be interpreted.
What this guide adds
The unit economics guide uses revenue per customer as an input to lifetime value and payback. The ARR and run-rate guide covers total recurring revenue. The gross margin guide covers what share of revenue is kept. None explains how to label a single per-customer figure on a slide so a reader knows what it measures. This page covers that question.
Four averages that are often confused
ACV (annual contract value) = the yearly value of a contract. Average ACV divides the total by the number of contracts; say whether one-off fees such as setup are included, and whether the average covers all current contracts or only those signed in a period.
ARPU or ARPA = revenue in a period ÷ users or accounts in that period. The period (month or year) and the denominator (all users, paying users, or active users) must both be stated.
Average order value = total order value ÷ number of orders. On a marketplace or reseller it is usually what the customer pays, before the company pays suppliers.
Average deal size = the value of new deals closed, usually over a period. A rising deal size says new deals are bigger; it doesn't show that existing customers pay more.
How we read each slide
We quote figures as shown and use only visible numbers in calculations. Where a slide gives a total and an average, we multiply or divide to see whether they fit. A mismatch usually means a definition is missing (for example, different customers in the count and the average); we say so rather than call the figure wrong.
Disclosing dependence on your largest customers
An average says nothing about how much revenue depends on one or two customers. Investors ask this directly, so a slide that names a large customer should also answer it. Customer concentration is a share: revenue from the customer (numerator) ÷ total revenue (denominator), for a stated period or as of a date.
In the slides we checked, founders usually give only part of that. Fibery names its largest customer in users (Lemonade, 300 users) beside total ARR, but gives no revenue for Lemonade. Upollo gives one customer's figure (over $100k ARR in 2 months) with no total. Crowdbotics says its "top single customer grew 10x" and its top 50 customers grew 150%, with no share of revenue for either. None states a concentration percentage, and none can be calculated from the slide. We don't estimate one.
If you name a customer, state three things: revenue from that customer, the total it is compared with, and the period ("Largest customer: $[x] of $[y] ARR, [z]%, as of [date]"). If several customers matter, give the top-customer and top-5 shares. If the share is high, say why it is stable (contract length, renewal date, expansion) or how it will fall. Don't show a share you can't reconcile with your revenue total.
Common mistakes
No period. ARPU per month and per year differ by twelve times.
Unclear denominator. Registered users, paying customers and active customers give very different averages.
Order value called revenue. On a marketplace, say what the customer pays and what you keep.
One average for very different customers. Show segments or the median.
"Growth" with one number. Show the earlier value and dates.
Figures that don't multiply out. Average × count should roughly match revenue; if not, explain the difference.
Diagnostic checklist
Measure named (ACV, ARPU, AOV, deal size).
Customers or orders averaged, with the count.
Period stated (per month, per year, dates).
Customer spend or company revenue stated.
Segment averages or median if customers vary widely.
Average × count reconciles with revenue shown.
Largest customer: revenue, total and period stated, or not named as a size claim.
Frequently asked questions
How we chose these examples
Corpus: published pitch deck teardowns on StartupFundraising.com. Founder-uploaded private decks are excluded.
Selection (2026-09-25): we searched stored slide text on slides 2–8 for ACV, ARPU, ARPA, average order, average deal, deal size, contract value and revenue per customer, excluding market-size, industry-average and disclaimer slides, kept only slides with a stored slide image, and inspected sixteen candidate images. We kept company figures that each show a different choice of measure, denominator, period or revenue basis. Considered but not used: Arist p5 (redacted like Humaans, with a similar lesson), Romit p3 (a take rate per transaction, covered by marketplace guides), Empion p2 (value redacted with no other figures), and Prealize p4 (the same slide as Cardinal Analytx p4 after the company's rename).
Customer concentration addition (2026-09-29): we inspected the original-file images of the 19 slides our coverage map flagged as eligible for this question; file hashes matched our records. Used: Fibery p12 and Upollo p4 (Crowdbotics p5 was already here). Not used: the Airbase Series B memo p10 in two copies (a written memo with values redacted, and it covers churn, not concentration); ArtCorgi p4 (repeat orders, not customers; already here); Kitu/Super Coffee p27 (a sales-channel split, and its headline and chart figures don't reconcile on the slide); Titan Labs p7 and p8 in two decks (revenue share by product line, not by customer); Eaze p13, RapidCanvas p2 and Zazuu p5 (no customer-concentration content); TrueBlue p15, ARO Drilling p6 in three decks, Mag One p13 and Olympic Shipping p30 (listed-company or bond presentations, not founder decks). No slide in the set states a customer's share of revenue.
Figures are quoted as shown in the stored slide images. Calculations are ours and use only visible numbers. Where a slide doesn't label a figure, related arithmetic is conditional.
Periods are quoted from the slides. Deck years and stages from our library index are not used in the analysis.
Review: stored slide text and images were checked on 2026-09-25 and matched to company, deck and slide number (editorial model review). No person has yet completed an editorial review of this page. We make no claim that any slide caused a fundraising outcome.