Cardinal Analytx, a Stanford Start-X spin-out, presents a data-heavy Series B deck focused on solving the 'cost bloom' problem in healthcare. By predicting which 6% of the population will drive 33% of new high costs, the company demonstrates a clear value proposition for health plans and self-insured employers. The deck is notable for its high-caliber team and board, including John Doerr and Stanford professors, which provides significant institutional credibility. While the deck excels at demonstrating technical superiority over incumbents like Optum and Verscend, it lacks a traditional 'Ask…
Key takeaways
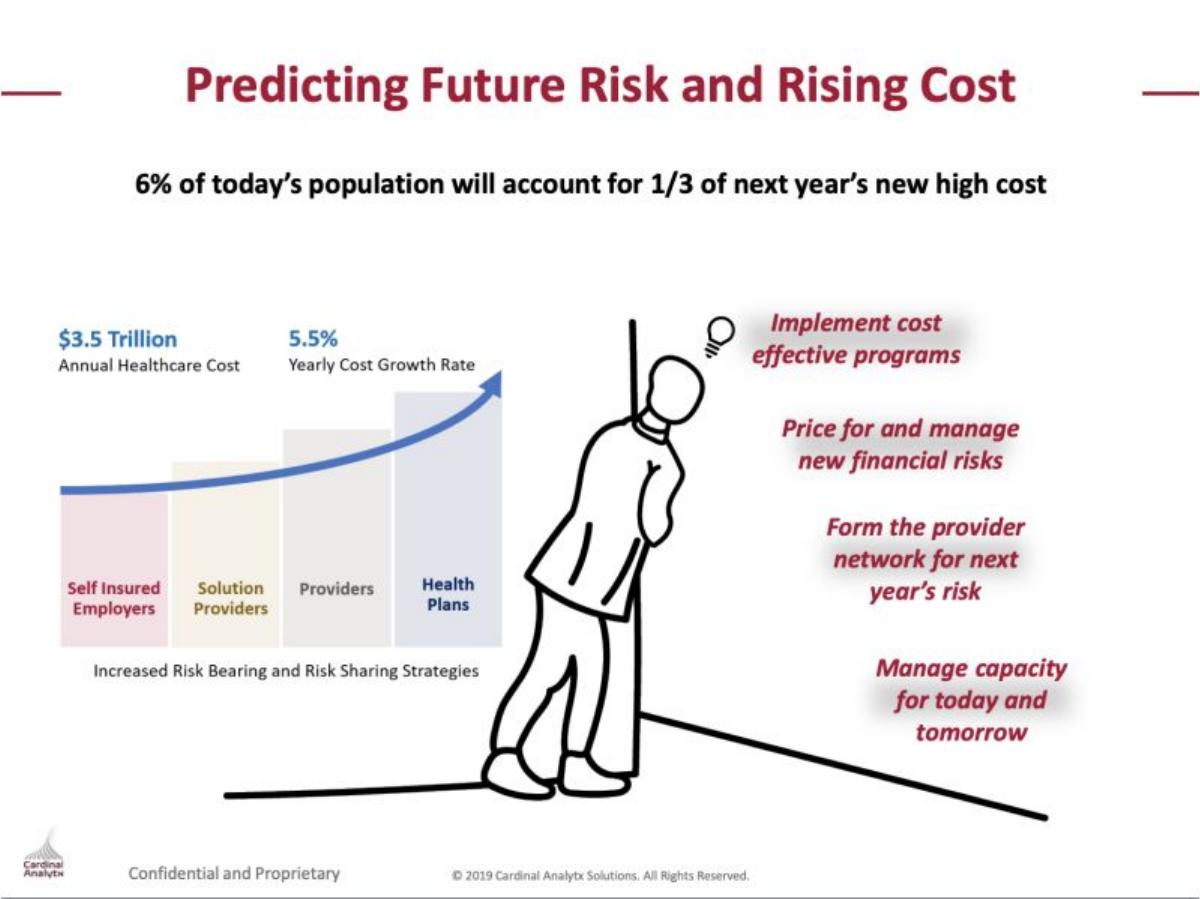
- The company identifies a specific market inefficiency where 6% of the population accounts for 1/3 of next year's new high costs (Slide 3).
- Cardinal Analytx claims 2.5x accuracy over traditional predictive models used in healthcare (Slide 2).
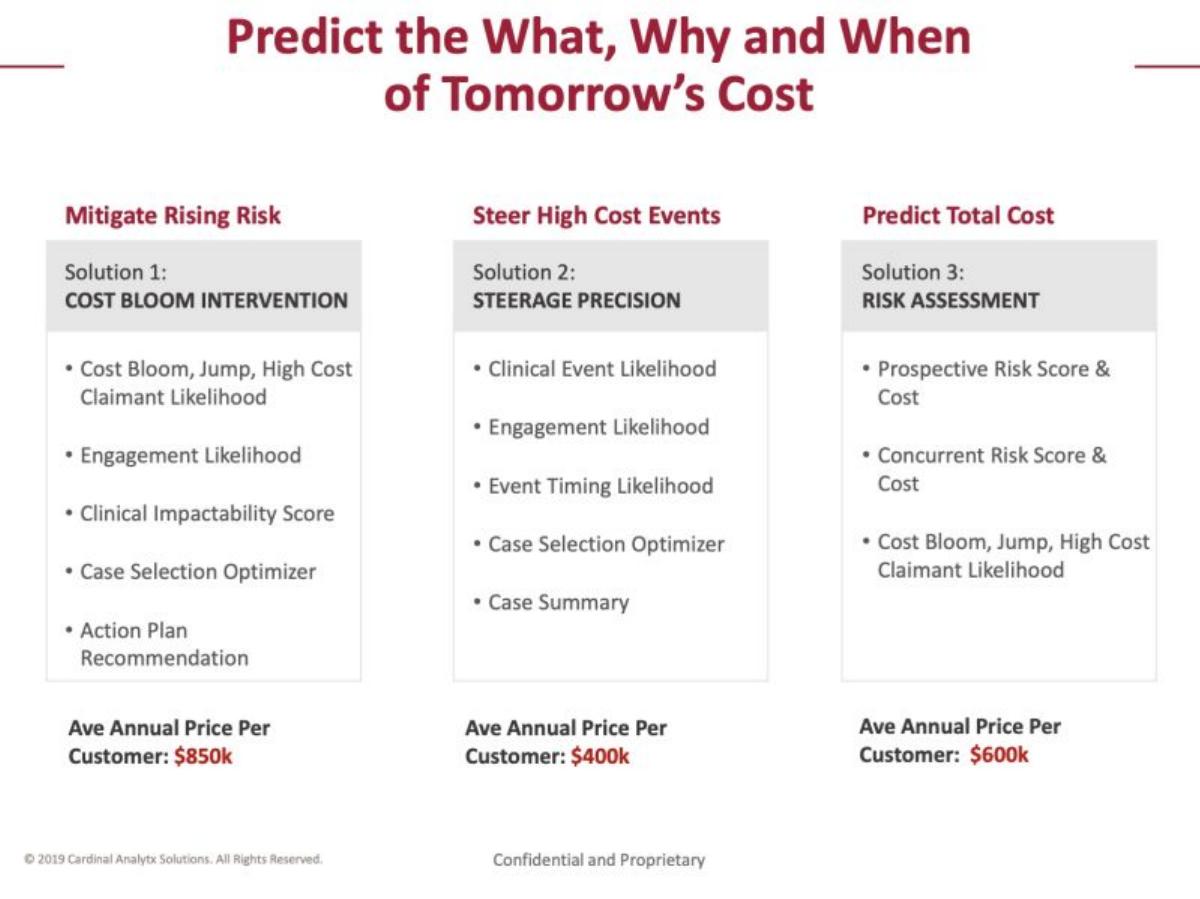
- The product suite is divided into three distinct solutions with average annual prices ranging from $400k to $850k per customer (Slide 4).
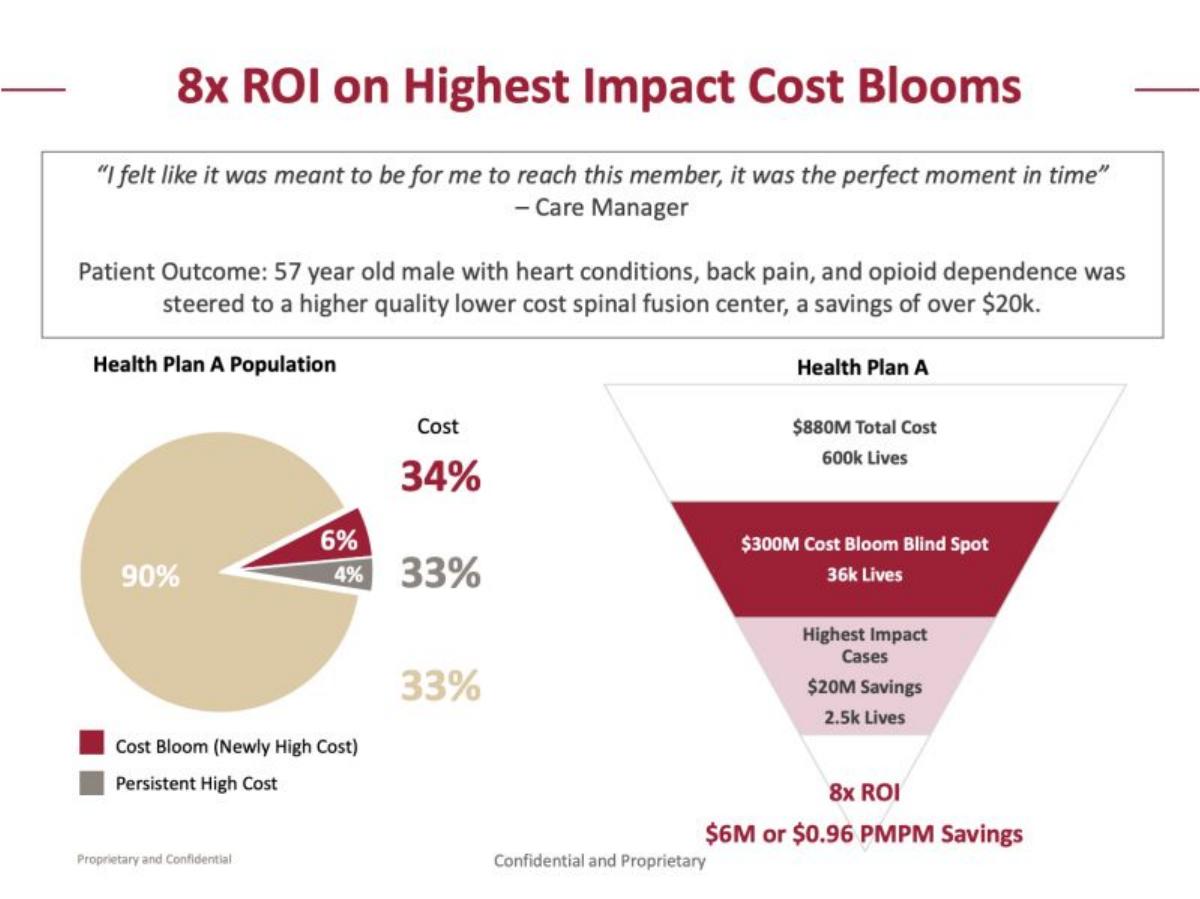
- The deck provides a specific case study showing an 8x ROI and $6M in savings for a health plan with 600k lives (Slide 5).
- Competitive benchmarking shows the company's machine learning model achieving a 31% R-Squared value compared to 11-20% for competitors (Slide 8).
- The team and board are exceptionally high-profile, featuring Kleiner Perkins Chairman John Doerr and Stanford faculty (Slide 11).
- The investment roadmap targets a scale-up from 26 million lives covered in 2019 to 50 million lives by 2021 (Slide 13).
- The deck omits a specific 'Use of Funds' breakdown, focusing instead on the macro 'Investment Opportunity' timeline (Slide 13).
Executive Summary and Traction
Slide 1: Title Slide
The deck opens with a minimalist title slide featuring the Cardinal Analytx Solutions logo and the tagline: "Better Care, Sooner." This emphasizes the dual value proposition of clinical outcomes and predictive timing.
Slide 2: The Snapshot
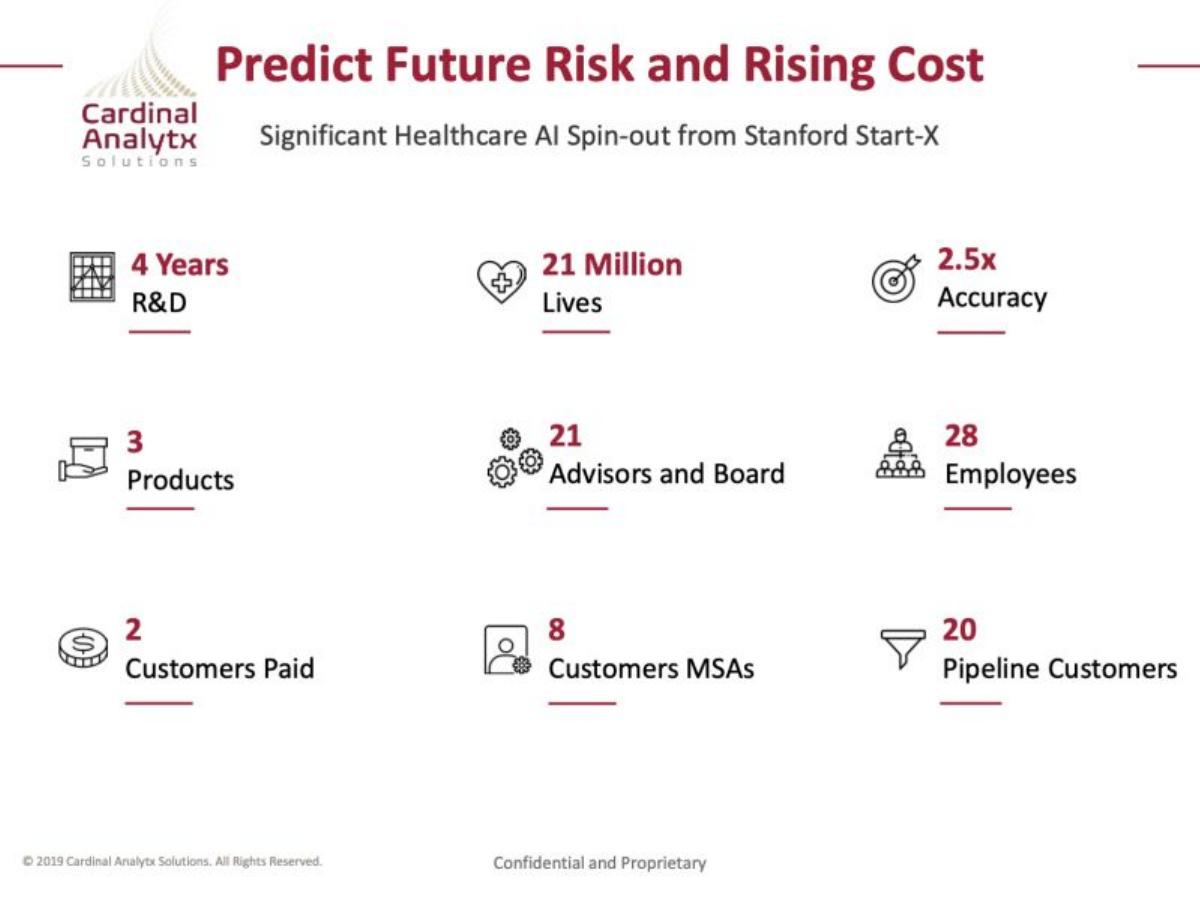
This is a high-density traction slide that establishes immediate credibility. Key metrics include 4 Years of R&D , 21 Million Lives covered, and 2.5x Accuracy . It notes the company is a "Significant Healthcare AI Spin-out from Stanford Start-X." The slide also discloses the commercial status: 2 Paid Customers, 8 Customers with MSAs, and 20 Pipeline Customers. This transparency regarding the sales funnel is rare and effective for a Series B pitch.
The Problem and Solution
Slide 3: Predicting Future Risk and Rising Cost
The problem is defined by a specific statistic: "6% of today’s population will account for 1/3 of next year’s new high cost." The slide uses a graphic of a person looking at a rising cost curve, highlighting the need to implement cost-effective programs and manage financial risks. It identifies the target segments: Self-Insured Employers, Solution Providers, Providers, and Health Plans.
Slide 4: Product Suite and Pricing
Cardinal Analytx breaks its offering into three distinct solutions, providing rare insight into their pricing strategy:
Solution 1: Cost Bloom Intervention - $850k Ave Annual Price. Focuses on clinical impactability and action plans. · Solution 2: Steerage Precision - $400k Ave Annual Price. Focuses on event timing and case selection. · Solution 3: Risk Assessment - $600k Ave Annual Price. Focuses on prospective risk scores and total cost prediction.
Proof Points and ROI
Slide 5: 8x ROI on Highest Impact Cost Blooms
This slide provides a concrete case study for "Health Plan A." It shows a population of 600k lives with a total cost of $880M. The "Cost Bloom Blind Spot" represents $300M. By targeting the 2.5k highest impact cases, the company claims $20M in savings , resulting in an 8x ROI or $0.96 PMPM (Per Member Per Month) savings.
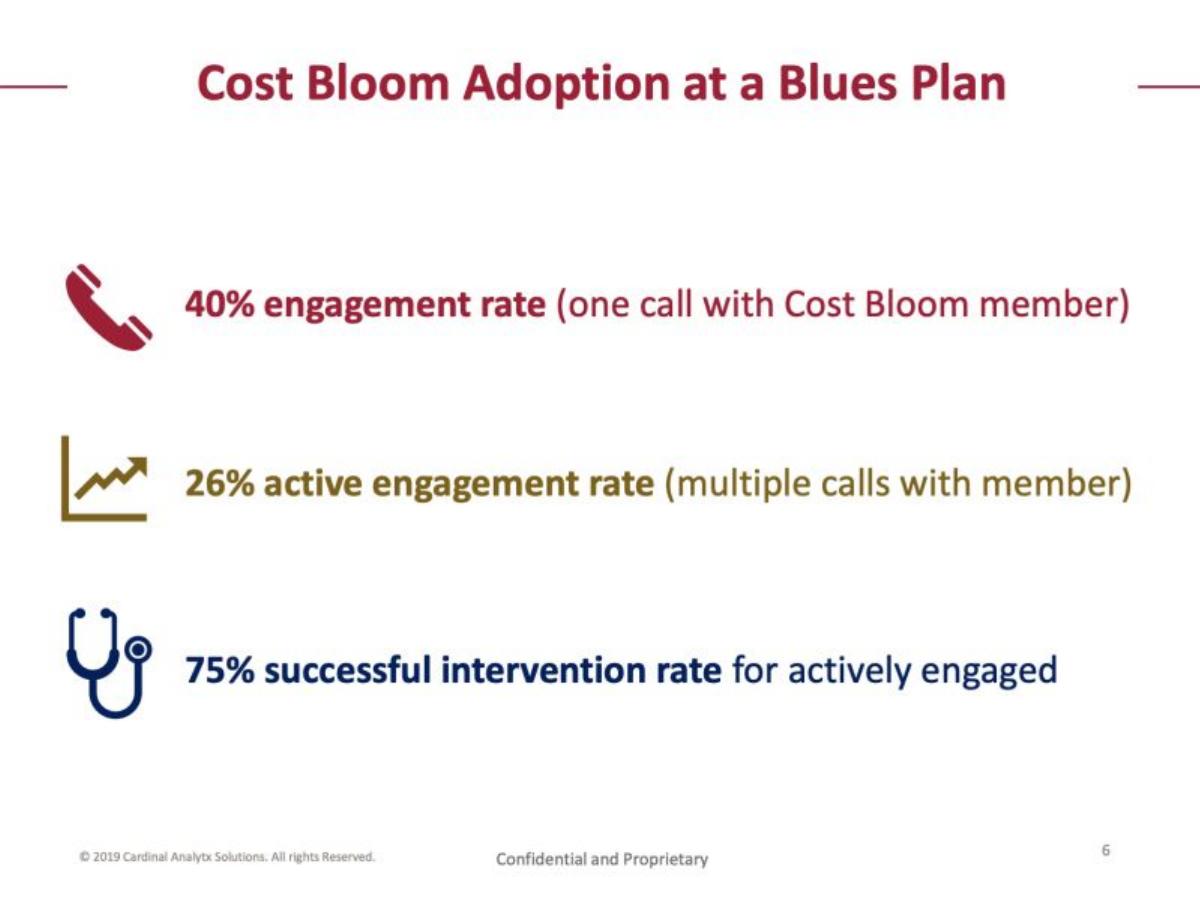
Slide 6: Cost Bloom Adoption at a Blues Plan
This slide focuses on engagement metrics, which are critical for healthcare interventions:
40% engagement rate (one call). · 26% active engagement rate (multiple calls). · 75% successful intervention rate for those actively engaged.
Slide 7: Ortho Joint Surgery Steerage
The company demonstrates vertical-specific utility. It notes that 1/3 of cost blooms were ortho joint surgeries. By steering patients to higher quality, lower cost centers, they projected $3.6M in savings (6x ROI) for Health Plan A. It also lists partners like Vitals, Relay, MOBE, and VIM.
Technical Superiority and Competition
Slide 8: $100M Through Increased Accuracy
This is the technical 'moat' slide. It uses an R-Squared chart to compare Cardinal Analytx against DxCG (Verscend) and ERG (Optum) . Across various data durations (1-3 months to 12 months), Cardinal Analytx shows significantly higher accuracy (31% vs 11-20% for competitors). The slide quantifies the cost of inaccuracy: $63M missed by under-pricing risk and $37M missed by over-pricing/retention risk.
Slide 9: Strong Competitive Position
The company uses a strategic approach matrix rather than a standard 2x2 grid. It categorizes competitors into four tiers. Cardinal Analytx places itself in the top tier: "Machine Learning Predictions with Drivers and Actions," alongside KenSCI and Cyft. It relegates major players like IBM Watson and Optum to lower tiers of "Machine Learning Predictions" or "Traditional Predictions."
The Team and Governance
Slide 10: Professional Team
The executive team is led by Linda Hand (CEO) , who has 35 years of experience and a successful exit of DecisionView to IMS Health. The team includes a CFO with 20 years of startup experience, a VP of Data Science with a Stanford PhD, and a Chief Medical Officer (MD/MPP).
Slide 11: Engaged Founders, Investors & Board
This slide is a 'who's who' of healthcare and venture capital. Founders Nigam Shah and Arnold Milstein are both Stanford Professors. The board includes John Doerr (Chairman, Kleiner Perkins) and Elizabeth Spaulding (Partner, Bain & Company) . Listed investors include Cardinal Partners, Premera Blue Cross, and the John Doerr Family Fund.
Slide 12: Industry Leading Advisors
The advisor slide further bolsters credibility, featuring 14 individuals categorized by Science, Industry, Health Plan, and Clinical expertise. This includes faculty from Stanford and Harvard, and former C-suite executives from Optum and Blue Shield of California.
The Investment Opportunity
Slide 13: Investment Opportunity Roadmap
The final content slide provides a timeline from 2017 to 2021+. It tracks the progression of funding and scale:
2017: Series A ($6M), 0 Clients, 2m Lives. · 2018: Series A Bridge ($7M), 1 Client, 15m Lives. · 2019: Series B New Money ($22M), 11 Clients, 26m Lives. · 2020 (Projected): 25 Clients, 40m Lives. · 2021+ (Projected): 53 Clients, 50m Lives.
What Works / What is Missing / What to Copy
What Works
Quantified Value Proposition: The deck does an excellent job of translating technical machine learning accuracy into dollars saved for the customer. Using the $0.96 PMPM figure on Slide 5 speaks the direct language of health plan actuaries.
Institutional Credibility: Between the Stanford spin-out status, the high-profile board (John Doerr), and the specific competitive benchmarking against Optum, the deck makes it very difficult for an investor to dismiss the technology as 'unproven.'
Pricing Transparency: Including the average annual price per customer ($400k - $850k) on Slide 4 is a bold move that sets clear expectations for the company's revenue potential and sales cycle complexity.
What is Missing
Detailed Use of Funds: While Slide 13 mentions the $22M Series B, it does not provide a breakdown of how that capital will be deployed (e.g., % to sales, % to engineering). It assumes the 'Investment Opportunity' is self-evident through the projected client growth.
Unit Economics: There is no mention of Customer Acquisition Cost (CAC) or Lifetime Value (LTV). While the annual contract values are high, the cost to serve and the length of the sales cycle are omitted.
Product Visuals: The deck is very heavy on charts and text but lacks screenshots or visualizations of the actual software interface. This makes the 'Solution' feel more like a consulting service than a scalable SaaS product.
What a Founder Should Copy
The 'Snapshot' Slide: Slide 2 is a masterclass in establishing a baseline. Every founder should have a slide that summarizes R&D years, lives touched, accuracy metrics, and the exact state of the sales pipeline (Paid vs. MSA vs. Pipeline).
The Competitive Benchmark: Slide 8 doesn't just say "we are better"; it uses a standard statistical metric (R-Squared) to show exactly how much better they are than named incumbents. If you have a technical advantage, quantify the cost of your competitor's failure.
The ROI Funnel: The visualization on Slide 5, showing how a massive population ($880M total cost) is filtered down to the 'Highest Impact Cases' ($20M savings), is a perfect way to explain a complex data product's utility.
Frequently asked questions
- What is the core problem Cardinal Analytx solves?
- The company addresses the 'cost bloom' in healthcare, where a small percentage of patients (6%) unexpectedly transition from low-cost to high-cost status, accounting for 33% of new annual spending. Traditional models fail to predict these 'jumps' in cost, leading to missed opportunities for clinical intervention and financial mispricing for health plans.
- How does Cardinal Analytx generate revenue?
- The company utilizes a B2B SaaS model targeting health plans and self-insured employers. Slide 4 outlines three primary solutions: Cost Bloom Intervention ($850k/year), Steerage Precision ($400k/year), and Risk Assessment ($600k/year). These high six-figure annual contracts indicate a high-touch enterprise sales motion.
- Who are the primary competitors mentioned in the deck?
- The deck explicitly names incumbents in the 'Traditional Predictions' category, including Optum (ERG), Verscend (DxCG), Milliman, and Lexis Nexis. It positions itself as superior by using 'Machine Learning Predictions with Drivers and Actions,' a category it shares with few others like KenSCI and Cyft.
- What traction did the company have at the time of the Series B?
- At the time of the 2019 Series B, the company reported 2 paid customers, 8 customers with MSAs, and a pipeline of 20 potential customers. They were covering 21 million lives and had grown their team to 28 employees following 4 years of R&D.
- What is the significance of the Stanford connection?
- The company is a spin-out from Stanford Start-X. Both founders, Nigam Shah and Arnold Milstein, are Stanford Professors of Medicine. This academic pedigree is used to validate the '2.5x accuracy' claim and the proprietary nature of their machine learning algorithms.