Apptopia’s deck is a high-signal, low-noise presentation that relies heavily on quantitative success. By the time of this deck's creation in 2016, the company had reached a $1.6M ARR with a 22% growth rate in the preceding 30 days. The deck skips traditional problem/solution narratives to focus on the 'Our Traction' and 'Our Customers' slides, which feature heavyweights like Google, Facebook, and Andreessen Horowitz. While it lacks a specific 'Ask' or detailed financial projections, the strength of its existing investor base—including Mark Cuban and 500 Startups—serves as a powerful validator…
Key takeaways
- The company reported a Current ARR of $1,647,984 as of May 2016 (Slide 3).
- Apptopia demonstrated significant short-term momentum with a +22% growth rate in the last 30 days (Slide 3).
- The cap table already included high-profile investors such as Mark Cuban, 500 Startups, and Kima Ventures (Slide 4).
- The product suite covers six core pillars: Download, Revenue, and Usage estimates, plus SDK Analysis, ASO, and Advertising Intelligence (Slide 5).
- The customer list is exceptionally diverse, spanning Finance (Fidelity), Internet (Google, Facebook), and Infrastructure (Verizon) (Slide 8).
- The team structure is heavily weighted toward technical execution, with 14 engineers out of 25 total employees (Slide 9).
- The deck omits a formal 'Problem' slide, assuming the audience understands the value of mobile market intelligence.
- There is no explicit 'Ask' slide detailing the amount of capital being raised or the intended use of funds.
The Traction-First Strategy
Apptopia’s pitch deck is a departure from the standard 15-20 slide narrative. It is a 9-slide document that functions more like a status report for a high-growth Series A or B round than a speculative seed pitch. By 2016, Apptopia had moved past the need to explain why mobile data matters; they focused instead on proving that they were the ones successfully capturing it. The deck is characterized by clean aesthetics, minimal text, and a heavy reliance on logos and charts to tell the story of a company that has already achieved significant scale.
Slide 1: Title and Positioning
The cover slide introduces the company with the tagline "Measuring the Mobile World." It includes the CEO’s name, Eliran Sapir, and contact information. Notably, the background features a subtle, semi-transparent area chart that mirrors the traction chart found later in the deck. This establishes a theme of growth from the very first second an investor views the file. The inclusion of an AngelList link and a professional email address in the header of every slide ensures that the deck is actionable and easy to reference.
Slide 2: The "Swipe Right" Closer
Interestingly, the second slide in this version of the deck appears to be a closing slide or a transition, featuring the phrase "Thank You For Your Time. Swipe Right ->>". It lists Eliran Sapir as Founder & COO (contrasting with the CEO title on Slide 1) and provides a phone number and website. In many modern deck distributions, closing slides are sometimes moved to the front or used as placeholders. However, the "Swipe Right" call to action is a clever, era-appropriate nod to mobile app culture (Tinder), reinforcing their identity as a mobile-first company.
Slide 3: The Traction Powerhouse
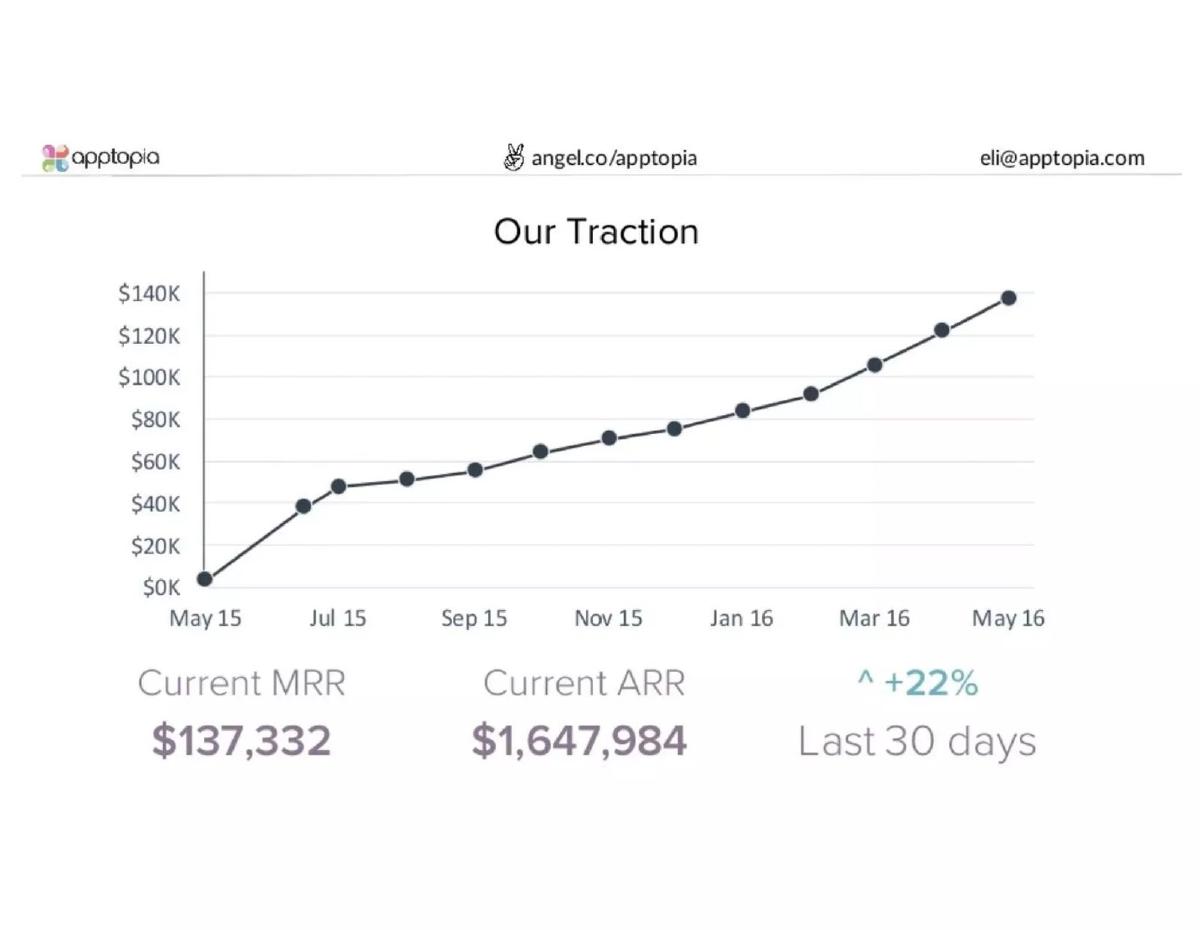
This is the most important slide in the deck. It displays a line graph of MRR from May 2015 to May 2016. The numbers are precise: Current MRR of $137,332 and a Current ARR of $1,647,984 . The most compelling metric is the "+22% Last 30 days" figure. For an investor, a 22% month-over-month growth rate at a $1.6M run rate is an immediate signal of product-market fit. The chart shows a steady climb with a significant inflection point around June/July 2015, where revenue jumped from near-zero to approximately $40k MRR.
Slide 4: Institutional Validation
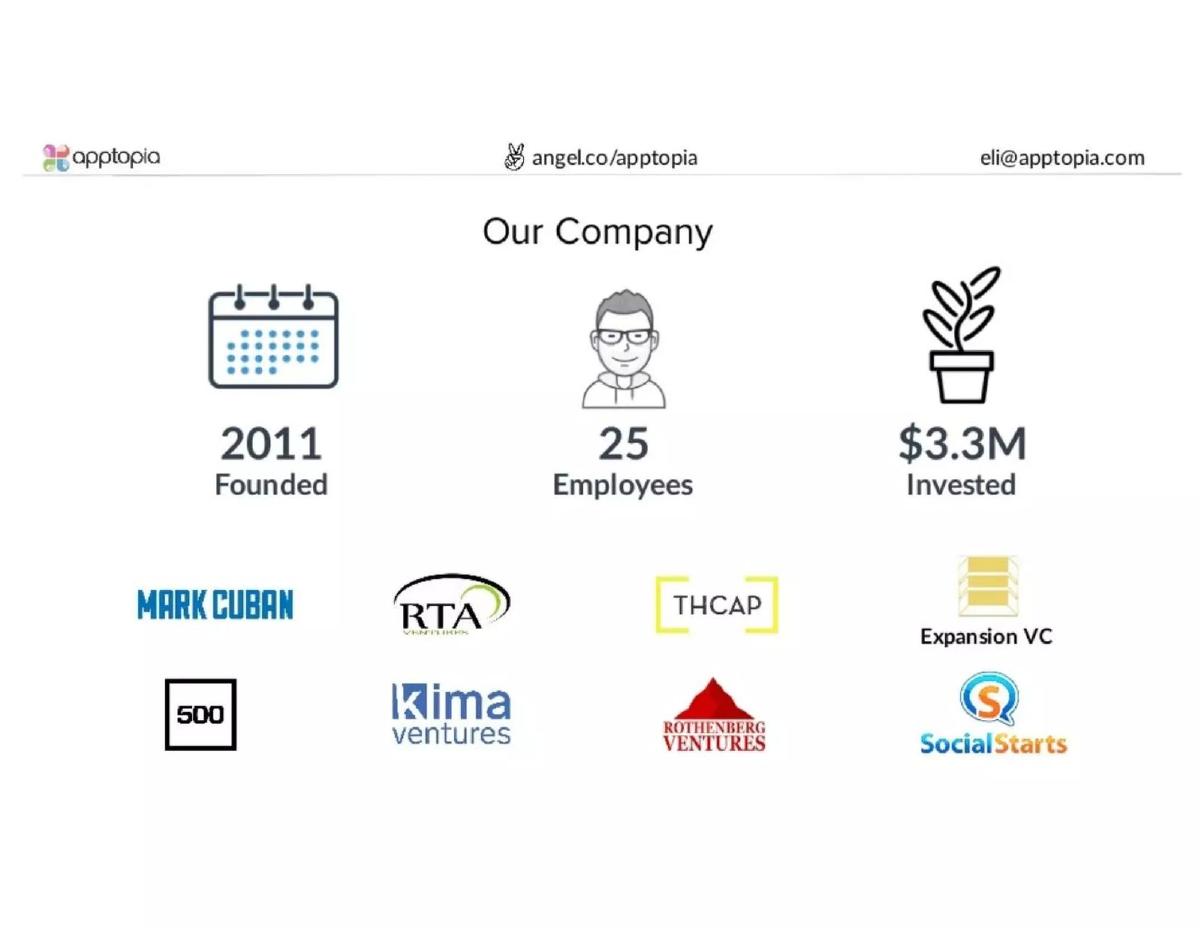
Slide 4, titled "Our Company," uses iconography to summarize the firm's history: founded in 2011, 25 employees, and $3.3M previously invested. The bottom half of the slide is dedicated to investor logos. Leading with Mark Cuban and 500 Startups provides immense social proof. This slide tells the investor that the company is stable, well-funded by smart money, and has the human capital (25 employees) to execute on its roadmap.
Slide 5: The Product Pillars
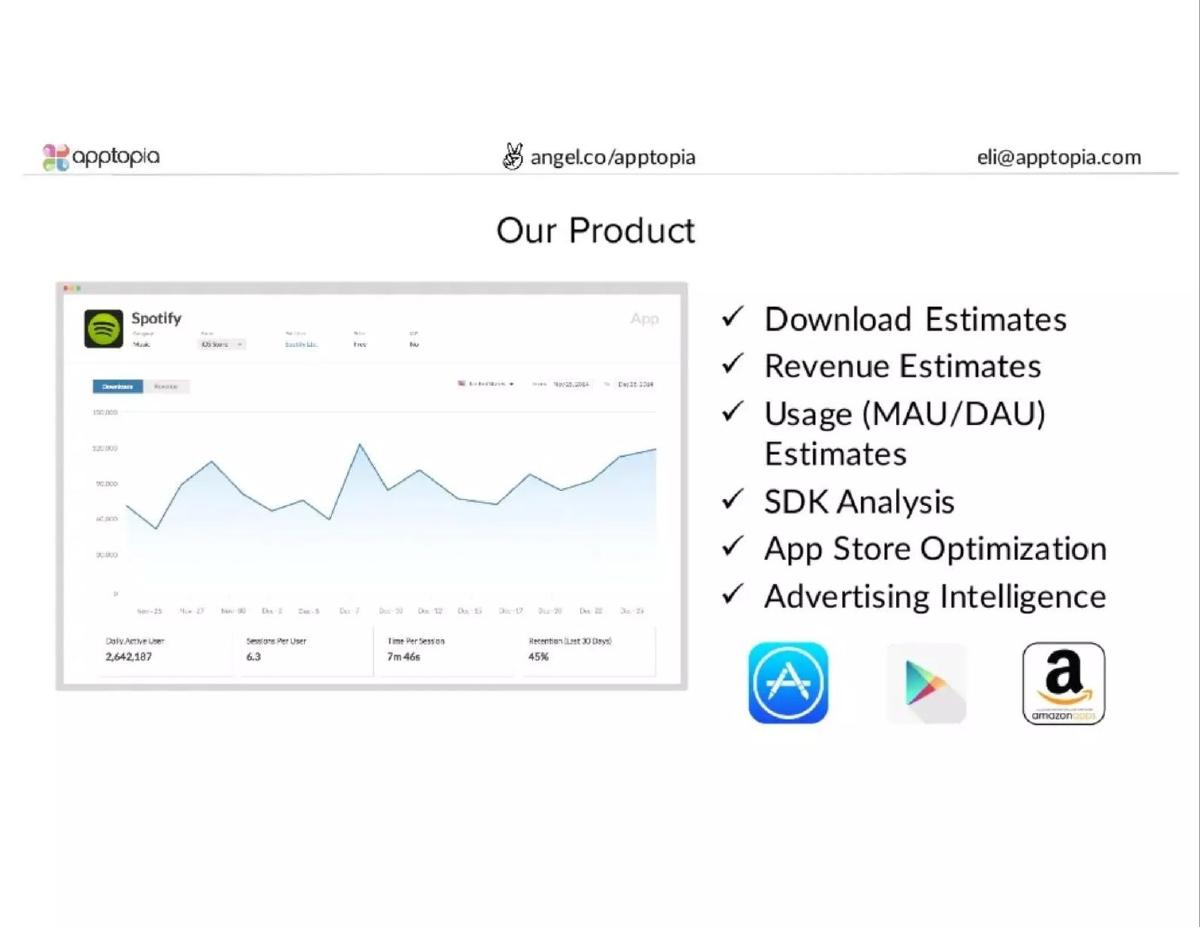
The "Our Product" slide moves away from abstract concepts and lists six concrete features: Download Estimates, Revenue Estimates, Usage (MAU/DAU) Estimates, SDK Analysis, App Store Optimization, and Advertising Intelligence. By showing a screenshot of the dashboard (featuring Spotify data), they demonstrate that their UI is clean and professional. The inclusion of the Apple App Store, Google Play, and Amazon Appstore logos indicates cross-platform capability, which is a critical requirement for enterprise-grade mobile intelligence.
Slide 6 & 7: Deep Dive into the Dashboard
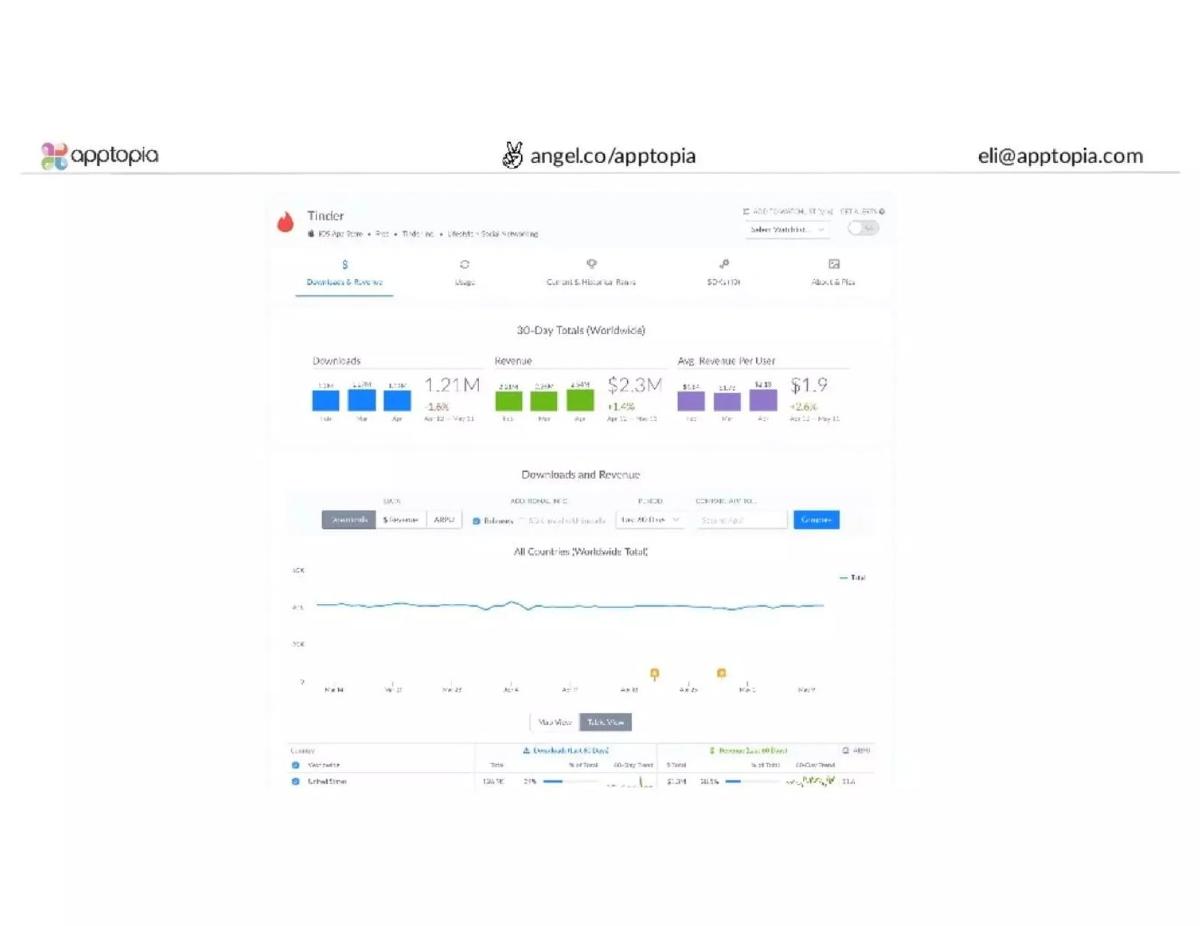
These two slides provide high-resolution screenshots of the platform in action. Slide 6 shows a deep dive into Tinder’s performance, displaying 30-day totals for downloads (1.21M) and revenue ($2.3M). Slide 7 shows a "Mobile Dating Compared" table, which is a powerful demonstration of their benchmarking capabilities. It shows how Apptopia can stack competitors like Tinder, Match, OkCupid, and Bumble side-by-side, comparing market share, DAU, and MAU. This proves the product's value for hedge funds, developers, and brands who need to monitor their competitive standing.
Slide 8: The Blue-Chip Customer List
If the traction slide didn't close the deal, the customer slide likely would. Apptopia categorizes its users into four buckets: Finance, Internet, Infrastructure, and App Publishers. The logos are top-tier: Fidelity, Google, Facebook, Verizon, Ticketmaster, and Universal . Seeing Andreessen Horowitz and Emergence Capital listed as "customers" (likely for their portfolio monitoring) is a massive endorsement. This slide proves that the data Apptopia generates is valuable enough for the world's most sophisticated tech companies and financial institutions to pay for it.
Slide 9: Team Composition
The final slide breaks down the 25-person team. Rather than long bios, they use a grid of headshots and a functional tally. With 14 engineers and 2 data scientists , 64% of the company is dedicated to building and maintaining the data engine. This is a reassuring ratio for a Big Data company; it suggests that the revenue is being driven by a robust technical product rather than just a large sales force (which only has 4 members).
What Works in This Deck
1. Data Density: The deck doesn't hide behind vague adjectives. It provides exact dollar amounts for ARR and MRR, and exact percentages for growth. This transparency builds immediate trust with investors.
2. Visual Proof: Instead of explaining how the software works, they show it. The screenshots on Slides 6 and 7 are legible and demonstrate the depth of the data they provide. Using well-known apps like Tinder and Spotify in the examples makes the data relatable.
3. Categorized Social Proof: Slide 8 is a masterclass in customer slides. By breaking customers down into industries, they show that their market isn't just "app developers," but anyone involved in the broader digital economy, from telcos to investment banks.
What Is Missing
1. The Problem Statement: The deck assumes the investor already knows that mobile data is fragmented and hard to track. While this might be true for specialist VCs, a broader audience might benefit from a slide explaining the pain points of the "pre-Apptopia" world.
2. The Ask: There is no mention of how much money they are raising, the valuation they are seeking, or what they plan to do with the capital. This suggests the deck may have been used as a teaser or as part of a larger presentation where the "Ask" was delivered verbally.
3. Competitive Landscape: The deck ignores competitors like App Annie (now Sensor Tower). Investors will inevitably ask how Apptopia’s data accuracy or pricing compares to the incumbents, and the deck provides no preemptive defense.
What a Founder Should Copy
1. The Functional Team Breakdown: Instead of the usual "CEO bio" slide, the breakdown on Slide 9 is very effective. It tells the investor exactly how the company's payroll is being spent and emphasizes a product-first culture.
2. The Header/Footer Utility: Every slide includes the company logo, an AngelList link, and a direct email address. This makes it incredibly easy for a deck that has been forwarded through three different people to still result in a direct lead for the founder.
3. Traction Inflection Points: The chart on Slide 3 is excellent because it doesn't just show a line going up; it shows the 30-day growth rate (+22%) as a callout. Highlighting the most recent momentum is often more important than showing the total historical revenue.
Final Thoughts
Apptopia’s deck is a "show, don't tell" document. It relies on the sheer weight of its metrics and the prestige of its customers to do the heavy lifting. For founders who have reached the $1M+ ARR milestone, this is a perfect template for a growth-stage deck: skip the fluff, prove the growth, and show the logos.
Frequently asked questions
- How much revenue was Apptopia generating at the time of this deck?
- According to Slide 3, Apptopia had a Current Monthly Recurring Revenue (MRR) of $137,332 and a Current Annual Run Rate (ARR) of $1,647,984. The traction chart shows a consistent upward trajectory from May 2015, where MRR was near zero, to May 2016.
- Who are Apptopia's notable investors?
- Slide 4 lists several prominent venture capital firms and angel investors, including Mark Cuban, 500 Startups, RTA Ventures, THCAP, Kima Ventures, Rothenberg Ventures, Expansion VC, and Social Starts. The slide also notes that $3.3M had been invested prior to this deck.
- What specific data points does Apptopia provide to its users?
- As detailed on Slide 5, the platform provides estimates for app downloads, revenue, and usage (MAU/DAU). It also offers deeper technical and marketing insights through SDK Analysis, App Store Optimization (ASO) tools, and Advertising Intelligence.
- What is the composition of the Apptopia team?
- Slide 9 breaks down the 25-person team by function. The organization is engineering-heavy, with 14 engineers and 2 data scientists. The remainder of the team consists of 4 Sales/Support staff, 2 Marketing staff, 1 Designer, and 2 Founders.
- Does the deck include a competitive analysis or market size?
- No. This deck completely omits a competitive landscape slide and a Total Addressable Market (TAM) calculation. It relies instead on its blue-chip customer list (Slide 8) to imply market demand and its product screenshots (Slides 6 and 7) to demonstrate its competitive edge.