Newmarket Gold’s April 2016 presentation is a data-heavy investor deck designed for a public-market audience (TSX:NMI). The deck focuses heavily on the company's transition into a low-cost producer, anchored by its flagship Fosterville Mine. With a cash balance of US$52.1 million and minimal debt of US$1.5 million (Slide 5), the company positions itself as a stable, high-growth alternative to its peers. The presentation uses sophisticated mining metrics—such as All-In Sustaining Costs (AISC) and gold grade (g/t Au)—to demonstrate operational efficiency. By comparing its trading multiples to r…
Key takeaways
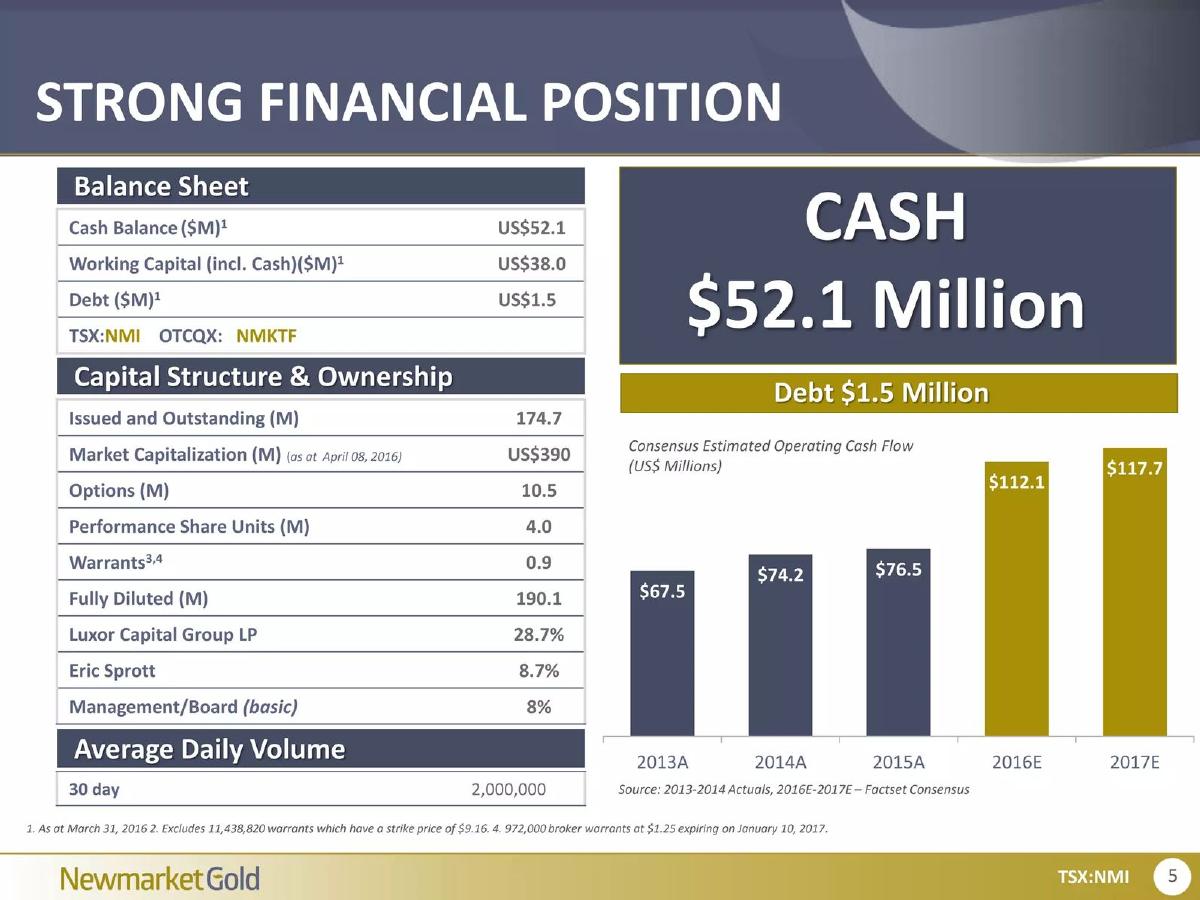
- The company reported a strong liquidity position with US$52.1 million in cash and only US$1.5 million in debt as of March 31, 2016 (Slide 5).
- Luxor Capital Group LP and Eric Sprott were significant institutional shareholders, holding 28.7% and 8.7% respectively (Slide 5).
- Newmarket Gold positioned itself as undervalued by showing a P/CF multiple of 4.23x compared to LSG's 6.90x and CRJ's 6.21x (Slide 9).
- The flagship Fosterville Mine achieved a record grade of 7.34 g/t Au in Q1 2016, significantly higher than the 2015 average of 6.11 g/t Au (Slide 13).
- Operational efficiency is highlighted by Fosterville's H2 2015 All-In Sustaining Costs (AISC) of $781 per ounce (Slide 13).
- The company set a clear growth vision to become an intermediate producer with 400,000-500,000 ounces of annual production (Slide 21).
- Geological upside is supported by high-grade intercepts at the Eagle Fault, including 386 g/t Au over 9.15 meters (Slide 29).
- The deck utilizes extensive technical appendices to validate 'New Discoveries' at the Stawell and Fosterville sites (Slides 29 and 33).
Introduction and Market Context
The Newmarket Gold investor presentation from April 2016 is a technical, data-driven document designed for the public markets. Listed on the TSX (NMI) and OTCQX (NMKFT), the company uses this deck to communicate a transition from a junior producer to a mid-tier gold powerhouse. The cover slide (Slide 1) sets a professional tone with an aerial shot of a processing facility and a clear three-pillar thesis: Exceptional Team, Solid Production, and Significant Valuation Upside.
Slide 5: Strong Financial Position
This slide is a comprehensive snapshot of the company's fiscal health. It breaks down the balance sheet as of March 31, 2016, reporting a Cash Balance of US$52.1 million and a remarkably low Debt of US$1.5 million . The capital structure section reveals 174.7 million shares issued and outstanding, with a market capitalization of US$390 million as of April 08, 2016. A key highlight here is the institutional backing: Luxor Capital Group LP holds 28.7% and renowned mining investor Eric Sprott holds 8.7%. The slide also includes a bar chart showing 'Consensus Estimated Operating Cash Flow,' projecting a rise from $76.5 million in 2015A to $117.7 million in 2017E , signaling strong forward momentum.
Slide 9: Newmarket Gold/Lake Shore Gold Value Comp
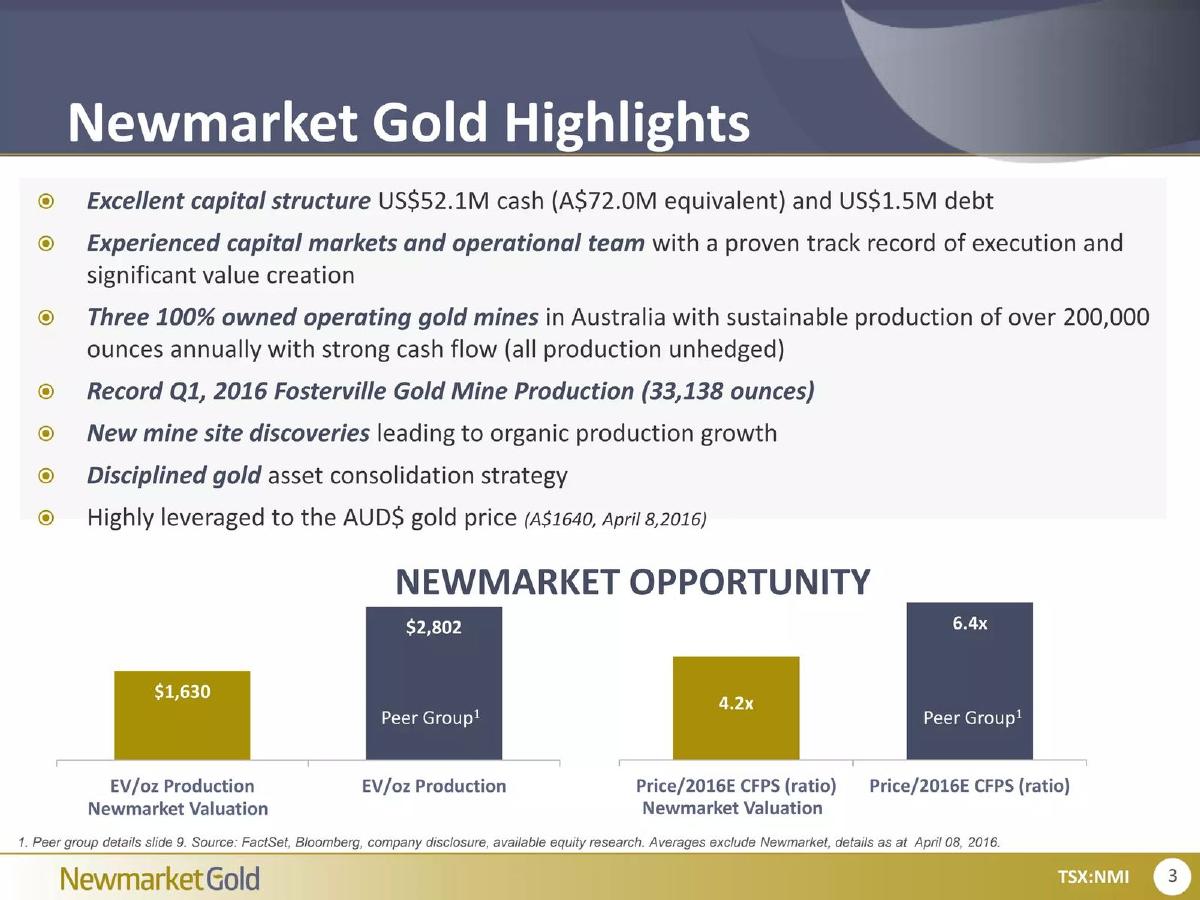
Slide 9 is perhaps the most critical slide for an investor looking for 'alpha.' It provides a direct comparison between Newmarket Gold (NMI) and two recent 'takeouts' (acquisitions): Lake Shore Gold (LSG) and Claude Resources (CRJ). The table shows that NMI’s 2015 production of 223 koz Au exceeded both LSG (179 koz) and CRJ (76 koz). Despite this, NMI was trading at a P/CF (Price to Cash Flow) of 4.23x , significantly lower than the 6.90x and 6.21x multiples paid for the other two companies. By highlighting an EV/2015 Production of $1,630/oz against LSG’s $3,446/oz, the company makes a data-backed argument that it is trading at a steep discount to its peers.
Slide 13: Flagship Fosterville Mine – Low Cost Producer
This slide focuses on the company's crown jewel: the Fosterville Mine. It lists several 'Record' achievements, including 2015 production of 123,095 oz and a record grade of 6.11 g/t Au. More impressively, it shows the trend is improving, with Q1/16 record grade hitting 7.34 g/t Au . The financial efficiency of the mine is underscored by an All-In Sustaining Cost (AISC) of $781 per ounce in H2 2015. The slide also mentions the discovery of the 'Lower Phoenix Gold Zone,' which is described as a high-grade, visible gold-bearing system open for expansion, providing a geological catalyst for future growth.
Slide 17: Operations Overview
Slide 17 provides a granular look at the three main operating assets: Fosterville, Stawell, and Cosmo. It uses a comparative table to show 2014 actuals, 2015 actuals, and 2016 guidance. Fosterville is clearly the leader, with 2016 guidance set between 110,000 and 120,000 ounces. The Cosmo Operation is shown to have a higher AISC ($1,154 in 2015) compared to Fosterville, but still contributes significantly to the total production volume. A stacked bar chart on the right visualizes the 2015 production mix, showing that 55% of total gold production (222,671 oz) comes from the high-margin Fosterville mine.
Slide 21: Newmarket Gold Advantage
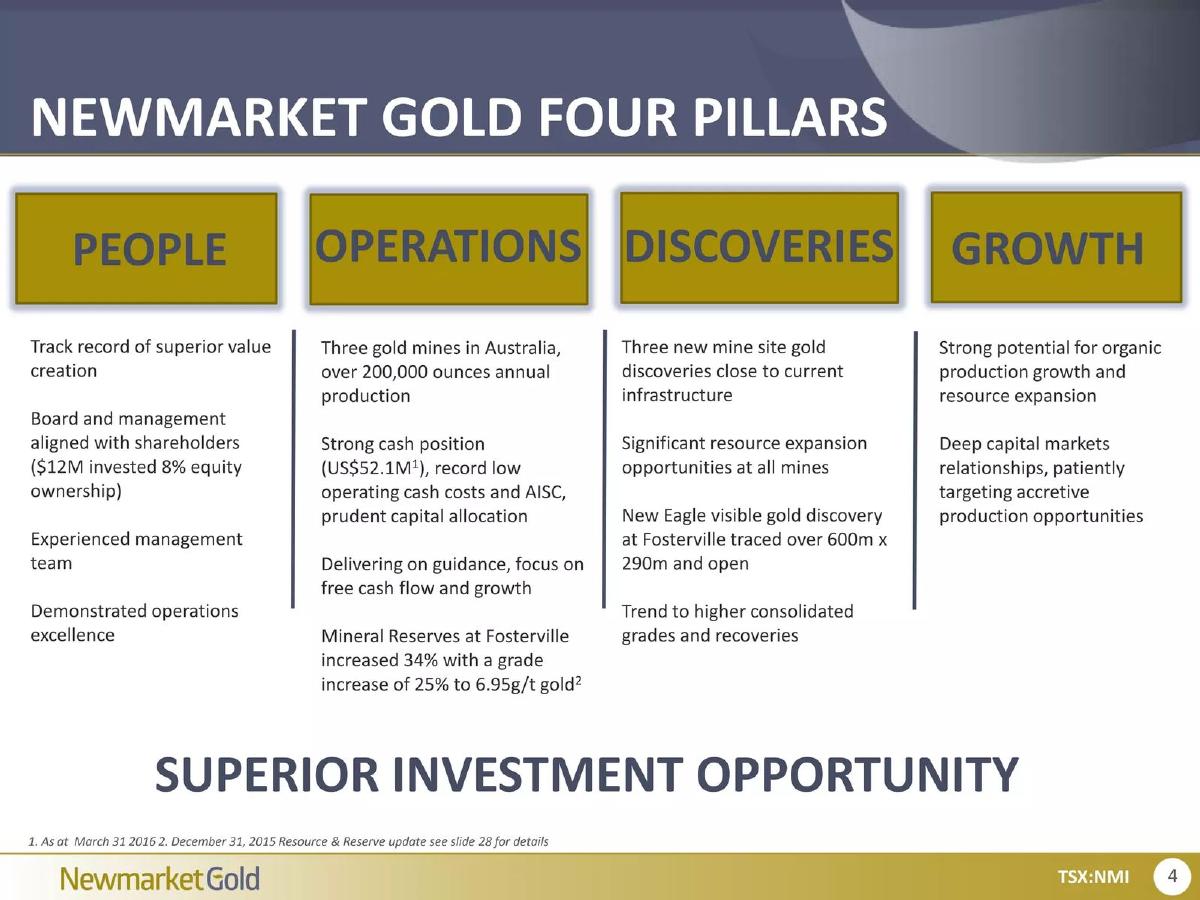
This slide serves as a summary of the company’s competitive moats, categorized into People, Operations, Discoveries, and Growth. Under 'People,' it claims the founders have created over $30 billion of shareholder value and notes a $12M investment by the team, ensuring alignment. The 'Growth' section defines the ultimate goal: becoming a 'quality intermediate gold producer' with 400-500 koz of annual production . This slide transitions the deck from historical performance to future ambition, emphasizing a strategy of both organic growth and 'prudent accretive acquisition.'
Slide 25: Appendix – Gold Price in AUD
Mining decks often include macro context, and Slide 25 provides a historical chart of the gold price in Australian Dollars (AUD). It notes a Current Spot Gold price of AUD$1,716/oz as of March 1, 2016. Since the company’s mines are in Australia but it reports in USD, a strong AUD gold price combined with a favorable exchange rate is a key driver of profitability that investors need to understand.
Slides 29 & 33: Geological Appendices
The final two slides provided are highly technical geological cross-sections. Slide 29 details 'New Discoveries' at Fosterville, citing massive intercepts like 386 g/t Au over 9.15 meters at the Eagle Fault. Slide 33 focuses on the Stawell mine's 'Aurora B East Flank,' noting it is a significant event in the mine's long history with high-grade intercepts of 7.06 g/t gold over 17.80 meters . These slides are intended for technical analysts to verify that the 'Growth' and 'Discovery' claims made earlier in the deck are supported by actual drilling data.
What Newmarket Gold Does Well
The deck excels at transparency and benchmarking . By providing exact AISC figures and comparing them to industry takeouts, the company removes the guesswork for investors. The use of 'Record' metrics (Slide 13) creates a narrative of a company that is not just stable, but actively improving its operational efficiency. Furthermore, the inclusion of technical drilling data in the appendix (Slides 29, 33) provides the 'proof of work' necessary in the resource sector to justify valuation premiums based on future reserves.
What is Missing from the Deck
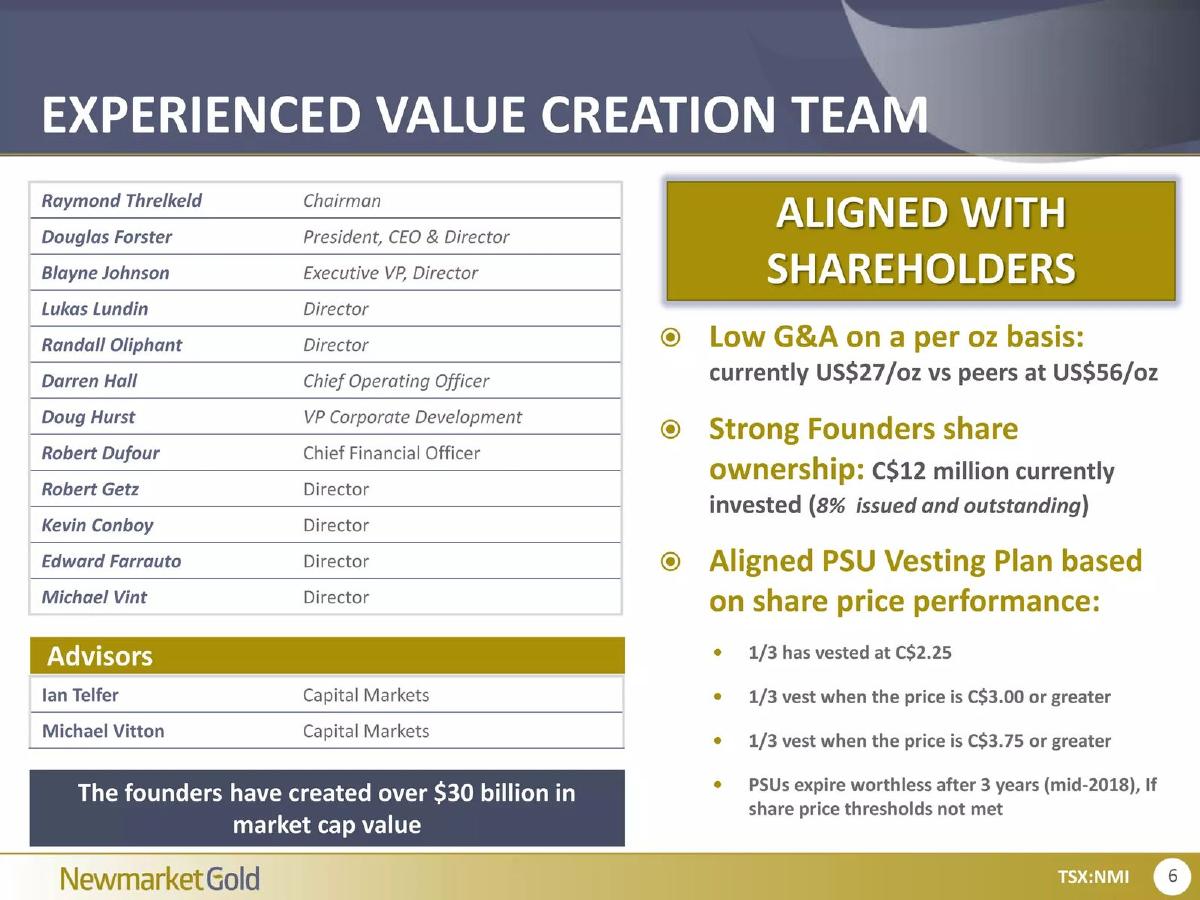
While the deck is strong on operations, it is light on specific management biographies . Slide 21 mentions '$30 billion in value created,' but the provided slides do not list the specific names or past companies of the leadership team, which is a standard requirement for most investor presentations. Additionally, there is no explicit 'Use of Proceeds' or 'Ask' slide in the provided selection; while this is common for a general investor update for a public company, it leaves the viewer wondering if the company is currently seeking to raise capital for a specific acquisition or if this is purely a secondary market awareness play.
What Other Founders Can Copy
Founders in capital-intensive industries should emulate Newmarket Gold’s 'Value Comp' approach (Slide 9) . Instead of simply stating they are undervalued, they provide a multi-metric table (EV/Production, P/CF, P/NAV) that forces the investor to reach the same conclusion. Additionally, the 'Operations Overview' (Slide 17) is a model of clarity; by showing 2014, 2015, and 2016 guidance side-by-side, the company demonstrates a track record of meeting or exceeding targets, which is the most effective way to build investor trust.
Frequently asked questions
- What is the primary value proposition of Newmarket Gold in this deck?
- The primary value proposition is that Newmarket Gold is a 'Low Cost Producer' with 'Significant Valuation Upside.' The deck argues that the company’s operational excellence—specifically at the Fosterville Mine—is not yet fully reflected in its stock price when compared to recent acquisitions in the gold sector, such as Lake Shore Gold.
- How does the company justify its 'undervalued' status?
- On Slide 9, the company presents a 'Value Comp' table. It shows that while Newmarket Gold (NMI) has higher production (223 koz Au) than Lake Shore Gold (179 koz Au), its EV/2015 Production multiple was only $1,630/oz, compared to LSG’s takeout multiple of $3,446/oz. This suggests a significant gap between current trading price and potential acquisition value.
- What are the key production assets mentioned?
- The deck highlights three main Australian operations: Fosterville, Stawell, and Cosmo. Fosterville is the flagship, accounting for 55% of 2015 production (123,095 oz). Cosmo contributed 63,255 oz, and Stawell contributed 36,321 oz (Slide 17).
- Who are the major shareholders and management mentioned in the deck?
- Slide 5 lists Luxor Capital Group LP (28.7%) and Eric Sprott (8.7%) as major shareholders. Management and the Board hold 8%. Slide 21 notes that the founders have created over $30 billion of shareholder value in previous ventures, though specific names are not listed on the provided slides.
- What is the company's long-term growth strategy?
- As stated on Slide 21, the vision is to reach annual production of 400,000 to 500,000 ounces. This is to be achieved through a combination of 'internal organic growth' (new discoveries at existing mines) and a 'prudent accretive acquisition strategy.'