Arbour's 14-slide deck presents a compelling case for digitizing the fragmented and manual private capital markets. The company leverages its deep domain expertise—citing €125bn deployed in private debt and equity since its establishment—to build a transaction processing platform. The deck effectively transitions from identifying market inefficiencies (fragmentation, immaturity, and regulatory restrictions) to presenting a scalable SaaS-like model with both transaction-based and recurring revenue streams. Notably, the firm shows strong financial momentum, with revenue growing from 738,636 in…
Key takeaways
- The company is evolving from Arbour 1.0 (Capital Markets Group) to Arbour 3.0, a transaction processing platform (Slide 6).
- Arbour claims a massive historical footprint, with €125bn deployed in private debt and equity since its establishment (Slide 6).
- The platform targets three primary user groups: Asset Managers, Advisors, and Institutional Investors (Slide 2).
- Revenue has shown significant growth, increasing by 216% in 2022 and 123% in 2023 to reach 5,204,693 (Slide 13).
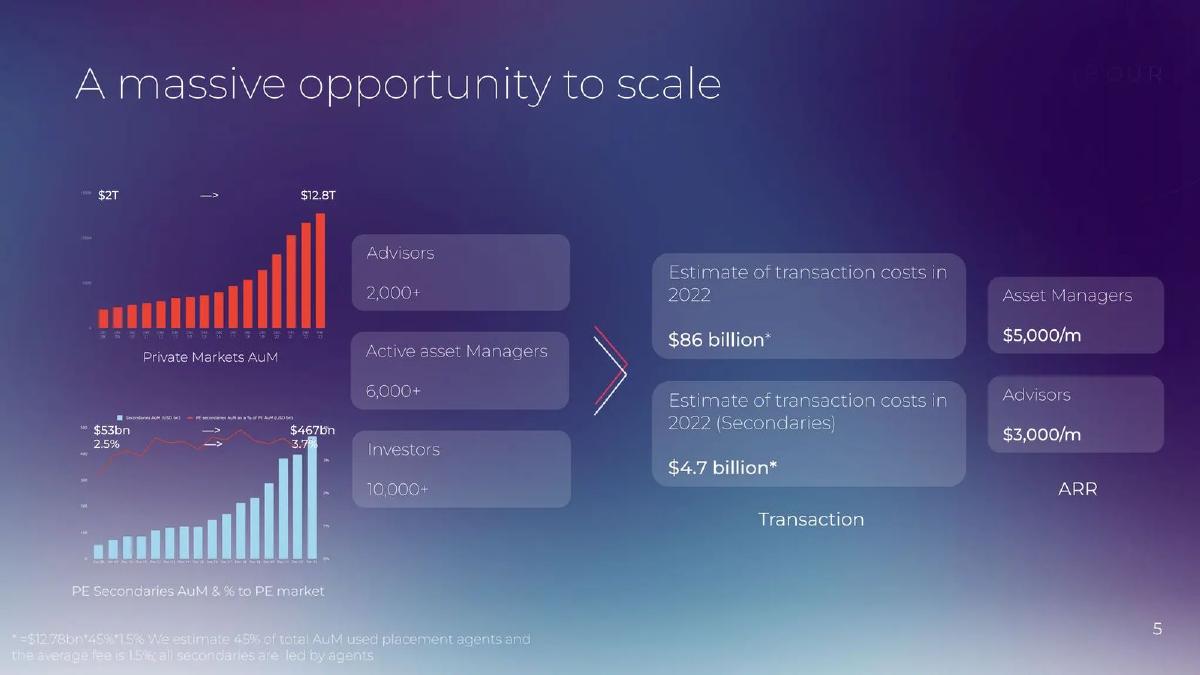
- The market opportunity is framed by an estimated $86 billion in transaction costs in 2022 for the private markets (Slide 5).
- The business model is shifting to include ARR-generating features alongside transaction-based fees (Slide 6).
- The founder, James Newsome, brings 23 years of market experience and was listed as one of the '30 Global Most Influential People in Private Debt' (Slide 11).
- The development timeline targets a fully scalable platform launch in Q2 2025 (Slide 9).
Executive Summary and Value Proposition
Slides 1-2: Introduction and Market Positioning
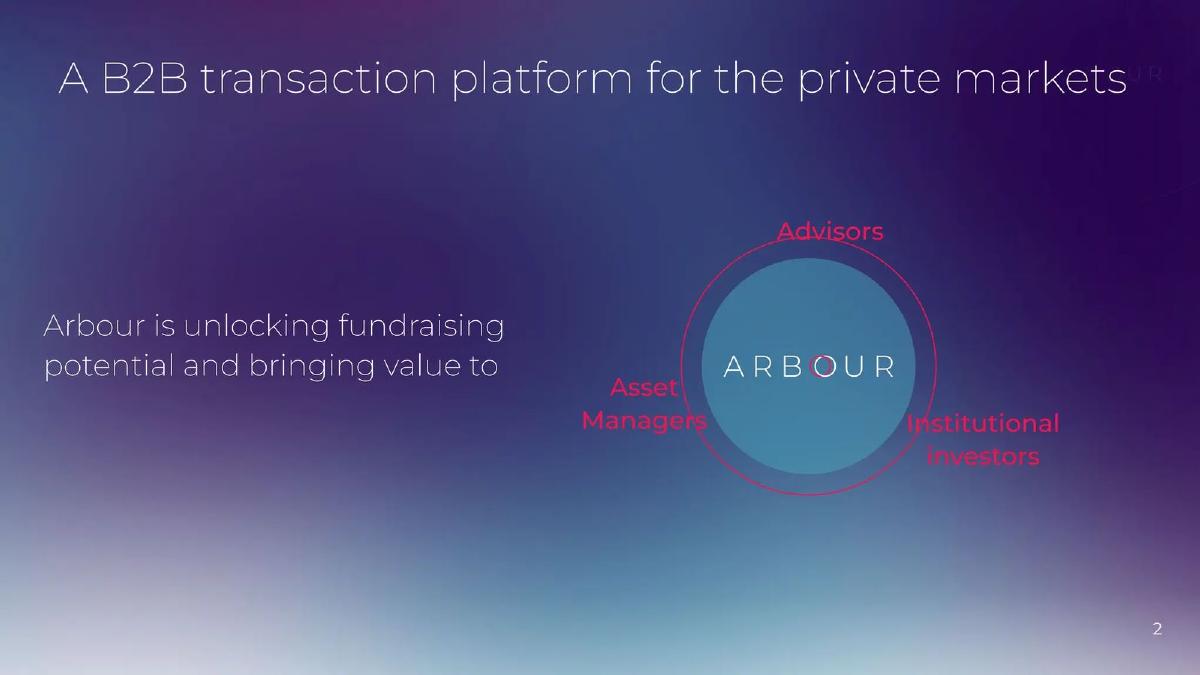
The deck opens with a minimalist title slide followed immediately by a high-level positioning statement on Slide 2 . Arbour defines itself as a "B2B transaction platform for the private markets." The slide uses a circular diagram to show the company at the center of a three-way ecosystem involving Advisors , Asset Managers , and Institutional Investors . The stated goal is "unlocking fundraising potential and bringing value" to these specific cohorts. This establishes the company as a marketplace or infrastructure play rather than a niche tool.
Slide 3: Problem Statement
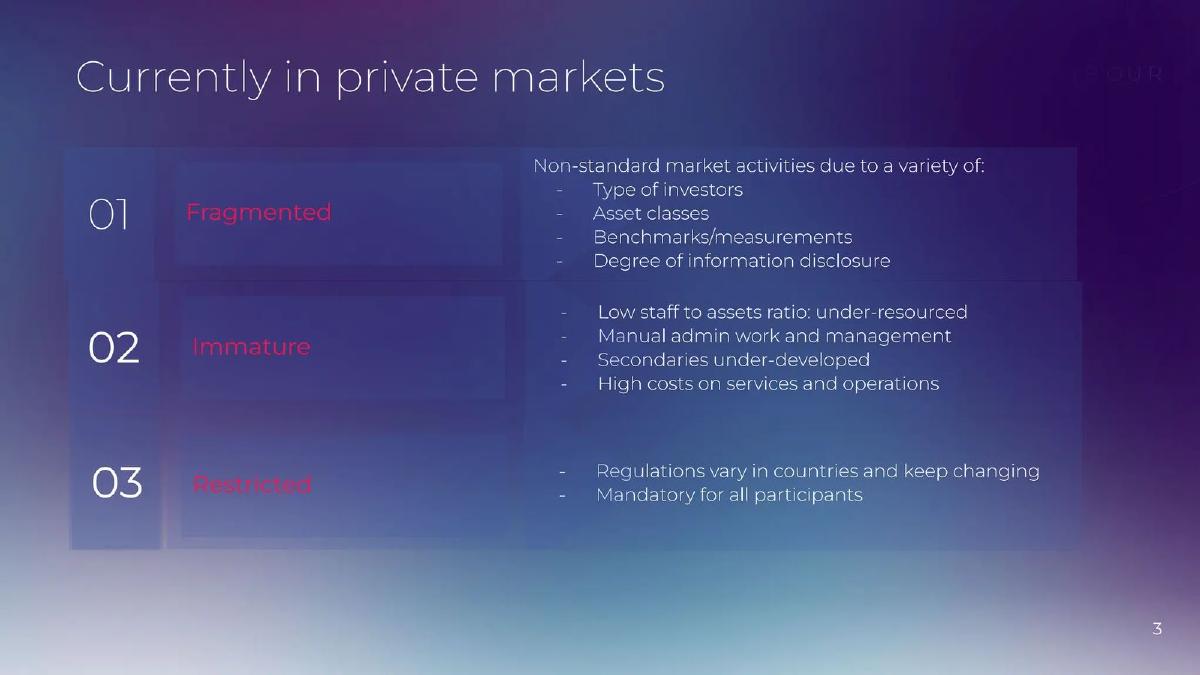
Slide 3 categorizes the current state of private markets into three pain points: Fragmented , Immature , and Restricted . Under fragmentation, the deck cites non-standard activities due to varying investor types, asset classes, and disclosure levels. Immaturity is defined by a low staff-to-assets ratio, manual administration, and high operational costs. The restricted nature refers to varying and changing international regulations. This slide effectively sets the stage for why a centralized digital platform is necessary.
Slide 4: Value Propositions
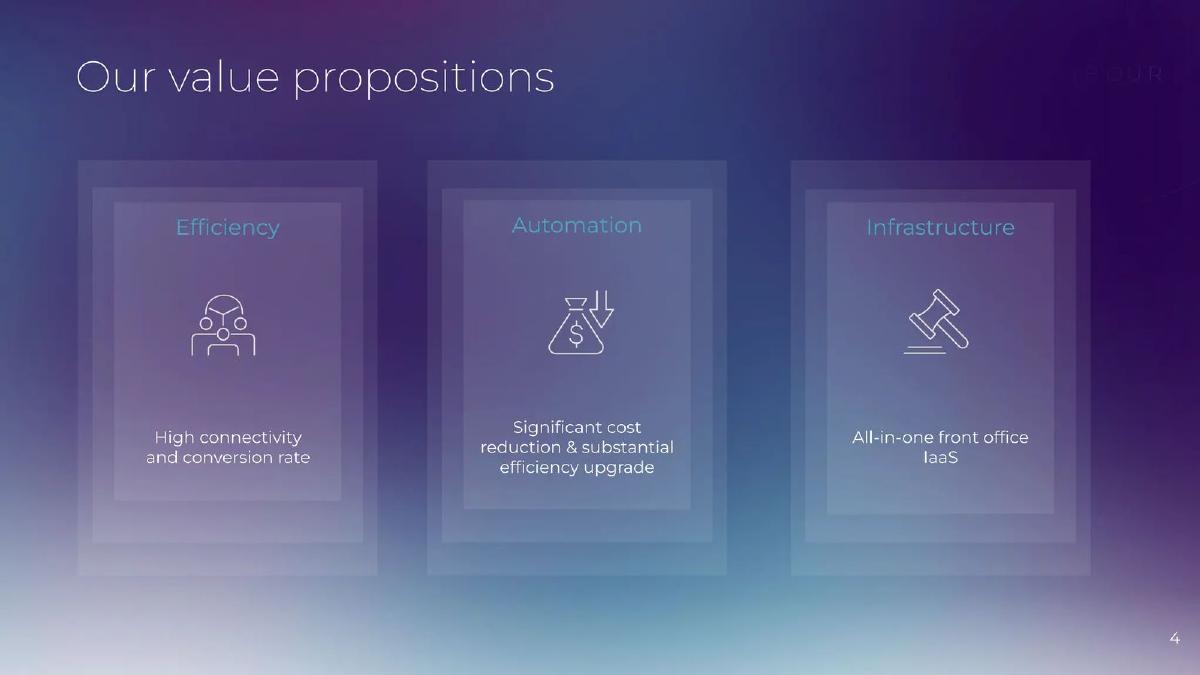
The solution is presented on Slide 4 through three pillars: Efficiency (high connectivity and conversion rates), Automation (significant cost reduction), and Infrastructure (an all-in-one front office IaaS). By using the term "IaaS" (Infrastructure as a Service), Arbour signals its intent to be the underlying plumbing for private market transactions, moving beyond simple lead generation.
Market Opportunity and Financials
Slide 5: Market Scale and Revenue Potential
Slide 5 is data-heavy, illustrating a "massive opportunity to scale." It shows Private Markets AuM growing from $2T to $12.8T. It estimates the total transaction costs in 2022 at $86 billion , with secondary market transaction costs at $4.7 billion . Crucially, this slide introduces the business model: $5,000/month for Asset Managers and $3,000/month for Advisors, labeled as ARR (Annual Recurring Revenue). This indicates a clear path from service-based fees to predictable software revenue.
Slide 6: Company Evolution
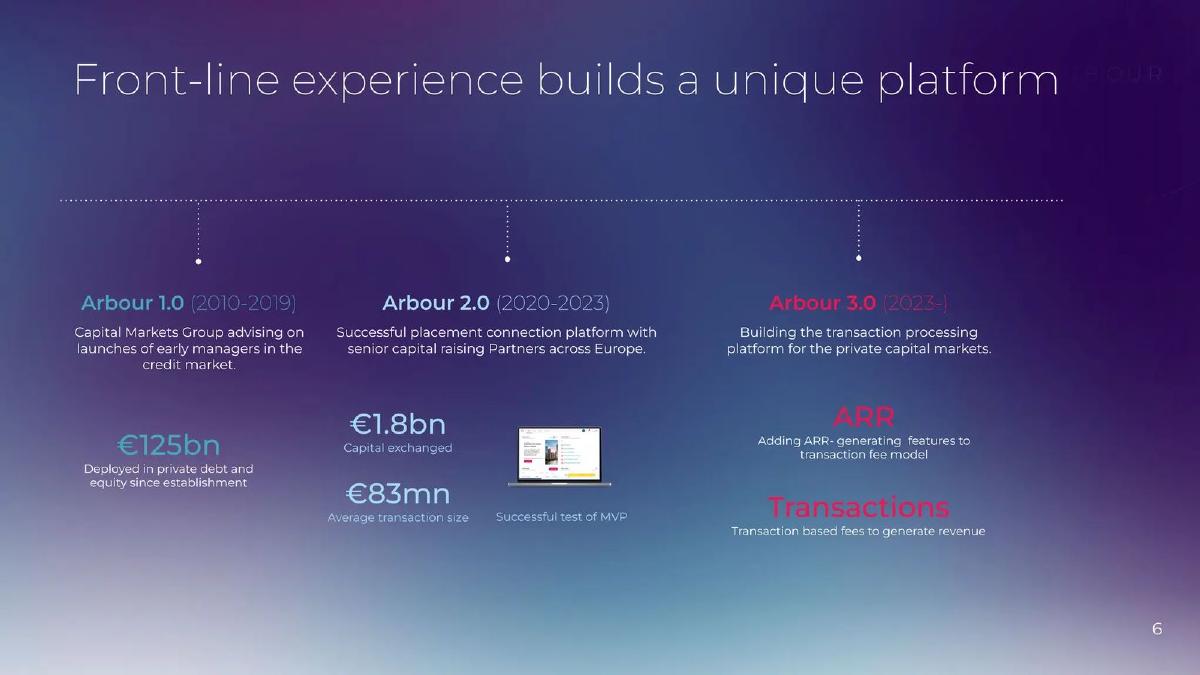
Slide 6 provides a historical timeline that builds credibility. It breaks the company's history into three phases:
Arbour 1.0 (2010-2019): Capital Markets Group advising on credit market launches, with €125bn deployed. · Arbour 2.0 (2020-2023): A placement connection platform with €1.8bn in capital exchanged and an average transaction size of €83mn . · Arbour 3.0 (2023-): The current phase of building the transaction processing platform, adding ARR features to the transaction fee model.
This slide is vital because it proves the founders aren't just technologists guessing at a market; they are industry veterans digitizing their own successful manual processes.
Slide 13: Revenue Growth
Slide 13 displays a bar chart of revenue growth. The figures are:
2021: 738,636 · 2022: 2,335,648 (+216%) · 2023: 5,204,693 (+123%)
The slide also lists "Selected clients," including major financial institutions like UBS , Monroe Capital , and Allianz . This provides concrete evidence of market fit and commercial traction.
Product and Competition
Slide 7: Platform Features
Slide 7 breaks down features by user type. For Asset Managers , it offers global investor access and compliant infrastructure. For Investors , it provides comparison tools and streamlined due diligence. For Advisors , it offers distribution and revenue multiplication. While the slide is conceptual, it clarifies the multi-sided nature of the platform.
Slide 8: Competitive Landscape
Slide 8 uses a standard 2x2 matrix (Proficiency vs. Digitalization). It places traditional advisors like Evercore , Campbell Lutyens , and PJT high on proficiency but low on digitalization. Existing platforms like Allfunds , Apex , and Goji are placed higher on digitalization but lower on proficiency. Arbour positions itself in the top-right quadrant, claiming the best of both worlds. The slide lists their edge as "Competency to close large volume transactions" and a "Proven network effect."
Slide 9: Development Timeline
The roadmap on Slide 9 shows a two-year plan. The focus for the first four quarters is hiring and product design/testing. A "Fully scalable platform" is slated for Q2 2025 . This suggests that while the company has high revenue, the "Arbour 3.0" technology platform is still under development, and the current revenue likely stems from the 2.0 connection model or advisory services.
Team and Leadership
Slides 10-12: The Team
The team section is exceptionally strong for a fintech deck. Slide 10 introduces the four core members. Slide 11 focuses on CEO James Newsome , highlighting his 23 years of experience, his MBA from The Wharton School , and his history of designing and distributing over $60 billion in private capital funds. Slide 12 details Till Tolksdorf , emphasizing his experience managing 120+ people at a BaFin-regulated bank and coordinating $1.4bn in transactions over two years. The depth of experience here significantly de-risks the execution of a complex financial platform.
What Works / What is Missing
What Works
Domain Authority: The deck leans heavily on the team's massive historical transaction volume (€125bn). This is a powerful way to build trust in a conservative industry like private capital. · Clear Evolution: The transition from 1.0 to 3.0 (Slide 6) explains the company's journey and justifies why they are building this specific software now. · Financial Traction: Showing 5M+ in revenue with 100%+ year-over-year growth (Slide 13) is a strong signal for any investor. · Specific Target Pricing: Including the $5k/$3k monthly targets (Slide 5) shows they have thought through the unit economics of the SaaS transition.
What is Missing
Product Screenshots: While Slide 6 has a tiny laptop icon with a mock-up, there are no detailed views of the actual interface or user experience. For a "transaction processing platform," seeing the workflow is critical. · The Ask: The deck does not state how much capital they are looking to raise or how the funds will be allocated beyond the general "hiring" mentioned in the timeline. · Unit Economics: While revenue is shown, there is no mention of margins, customer acquisition costs (CAC), or lifetime value (LTV), which are standard for a platform play. · Regulatory Detail: Given that "Restricted" markets are a key problem (Slide 3), more detail on how the platform handles cross-border compliance would be beneficial.
Founder Takeaways
Leverage your 'Old World' success: Arbour does an excellent job of using their history as a traditional advisory firm to validate their future as a tech firm. If you are pivoting from services to software, show the volume you handled manually to prove you understand the workflow better than a pure tech outsider.
Quantify the 'Soft' problems: Instead of just saying the market is "messy," Arbour categorizes it (Fragmented, Immature, Restricted) and then assigns a dollar value to the inefficiency ($86B in transaction costs). This turns a vague complaint into a measurable market opportunity.
Show, don't just tell, your network: Listing UBS and Allianz as clients on the same slide as your revenue growth (Slide 13) provides immediate social proof that large institutions trust your platform.
Be transparent about the roadmap: By showing that the "fully scalable platform" is still 18 months away (Slide 9), the founders set realistic expectations. They aren't claiming to have a finished product if they are still in the design and testing phase, which builds long-term investor trust.
Frequently asked questions
- What is Arbour's core product?
- Arbour is developing a transaction processing platform designed for the private capital markets. As described in the source listing and Slide 6, the platform aims to provide automation, connectivity, and an 'all-in-one front office IaaS' (Infrastructure as a Service). It seeks to replace manual administrative work and non-standard market activities with a digital infrastructure that connects asset managers, advisors, and investors.
- How does Arbour plan to make money?
- According to Slide 6, Arbour is moving toward a hybrid revenue model. Historically, the firm generated revenue through transaction-based fees. Under the 'Arbour 3.0' phase, they are adding ARR-generating features. Slide 5 suggests target pricing of $5,000/month for Asset Managers and $3,000/month for Advisors, indicating a shift toward a subscription-based software model supplemented by transaction volume.
- What is the company's historical performance?
- The deck highlights strong historical credentials. Slide 6 notes that the group has deployed €125bn in private debt and equity since its establishment and saw €1.8bn in capital exchanged during the 'Arbour 2.0' phase (2020-2023). Financially, Slide 13 shows revenue growing from 738,636 in 2021 to over 5.2 million in 2023, with blue-chip clients like UBS and Allianz.
- Who are the key members of the leadership team?
- The team is led by James Newsome (Founder & CEO), who has 23 years of experience and previously led fund development at Merrill Lynch. Till Tolksdorf (Managing Director) joined in 2016 and has 12 years of experience, including a role on the Management Board of a BaFin-regulated bank. The team is supported by Stephanie Xiao (Analysis & Market) and Madeline Hudson (Compliance & Information).
- What is the timeline for the platform's full release?
- Slide 9 provides a development timeline spanning eight quarters. The company is currently in the process of hiring key developers and designing product features. The roadmap indicates that 'Premarketing' begins in Quarter 5, with a 'Fully scalable platform' expected in Q2 2025 (Quarter 6), followed by a formal launch in Quarter 7.