ArangoDB’s 2019 pitch deck is a masterclass in 'Consolidation Positioning.' At a time when the tech world was embracing 'Polyglot Persistence' (using a different database for every job), ArangoDB argued that this trend had created an unsustainable burden on Total Cost of Ownership (TCO) and developer productivity. The deck effectively uses a 'Before and After' narrative to show how a 'Native Multi-Model' approach—supporting JSON, Graphs, and Key-Value in a single engine—can replace a fragmented stack of MongoDB, Neo4j, and Redis. With 335+ production installations and logos like NASA and Barc…
Key takeaways
- ArangoDB positions itself as the solution to 'Polyglot Persistence' fatigue, where enterprises manage too many niche databases.
- The 'Native Multi-Model' architecture (one core, three models) is presented as a structural cost advantage over 'Layered' competitors.
- The deck focuses heavily on Total Cost of Ownership (TCO), appealing to the economic buyer rather than just the developer.
- Performance benchmarks claim ArangoDB is competitive across document, graph, and key-value workloads while maintaining linear scalability.
- The 'SmartGraphs' and 'SatelliteCollections' features serve as technical moats for handling distributed data in large enterprises.
- The business strategy emphasizes a transition from cash-driven TCV to a renewable ACV/ARR revenue model to improve valuation.
- Strategic advisors from Mesosphere and MapR provide industry credibility and orchestration expertise.
What this deck actually is
The ArangoDB 2019 deck is a late-stage Series A or early Series B presentation focused on "Native Multi-Model" database technology. While it includes the 2019 copyright date, it appears to be a bridge or growth deck designed to demonstrate that the company has moved beyond pure R&D into commercialization and market consolidation.
The single most important finding in this deck is its aggressive positioning against the "Polyglot Persistence" trend of the 2010s . Rather than arguing that ArangoDB is a better graph or document database, the deck argues that the very existence of multiple niche databases is a burden on Total Cost of Ownership (TCO). By positioning ArangoDB as a "Native Multi-Model" solution that can replace MongoDB (Document), Neo4j (Graph), and Redis (Key-Value) simultaneously, the company transforms a technical product pitch into a financial efficiency pitch.
Slide-by-slide walkthrough
Slide 1: Title Slide
The cover slide introduces the brand identity: the ArangoDB logo (an avocado slice) alongside the core value proposition: "The Leading Native Multi-Model Database." The visual formula presented—"json { } + graph + key value"—immediately defines the "Multi-Model" term for investors who might be unfamiliar with database taxonomy. The background uses a green network graphic, reinforcing the graph database capabilities which are often the most complex part of their offering.
This slide effectively establishes the company's niche. In a crowded database market, being "the leading" anything is a bold claim, but the sub-textual icons give it immediate technical context. The 2019 date indicates this is a mature version of their pitch, likely used after their initial Enterprise Edition release in 2016.
A stronger version of this slide would include a one-sentence "North Star" metric or a high-level traction highlight (e.g., "Powering data for 335+ production installations") to immediately signal that this isn't a seed-stage project but a scaling enterprise.
Slide 2: Databases, a Crowded Market
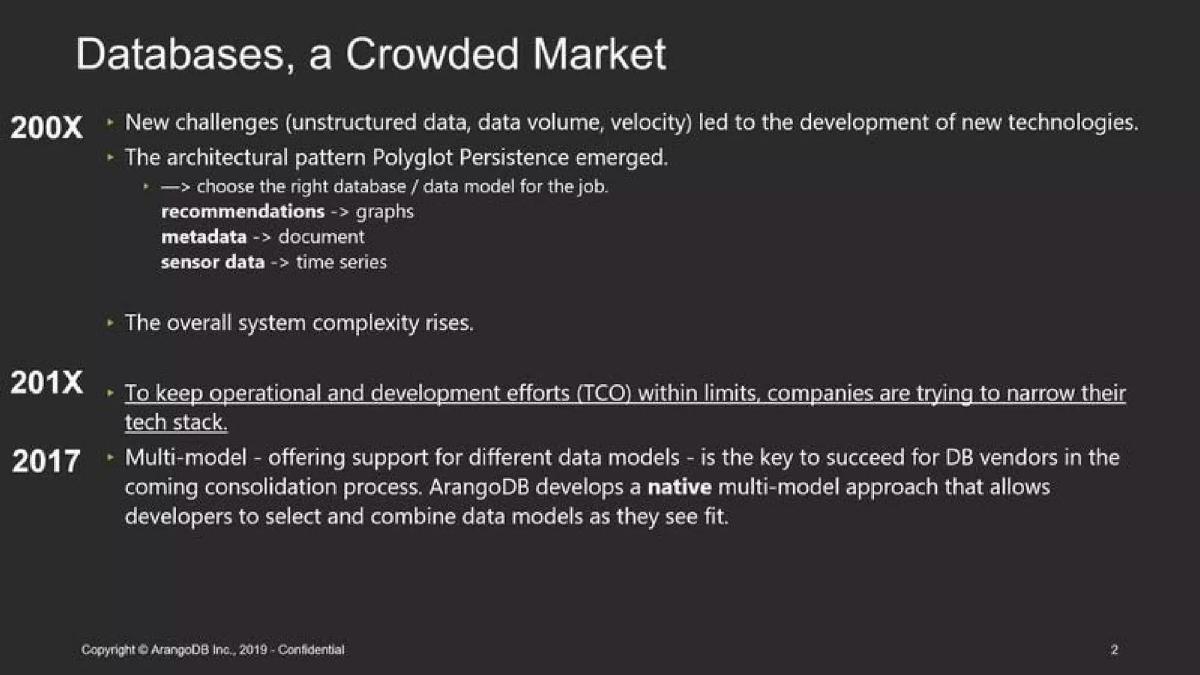
This slide sets the "Why Now?" by tracing the evolution of the database market. It identifies the 200X era as the rise of "Polyglot Persistence," where new challenges (volume, velocity) led to specialized databases. It lists examples like recommendations for graphs and sensor data for time series. It then identifies the 201X pivot: companies are now trying to "narrow their tech stack" to keep Total Cost of Ownership (TCO) in check. It concludes that "Multi-model... is the key to succeed."
Investors read this as a "Consolidation Play." The deck is betting that the explosion of specialized NoSQL databases has created a management nightmare for CTOs. ArangoDB is positioning itself not as "another new database," but as the solution to the "too many databases" problem. The mention of TCO (Total Cost of Ownership) is a direct appeal to the economic buyer, not just the developer.
To improve this slide, the company could quantify the "operational and development efforts." Rather than saying efforts are rising, they could cite a metric on the average number of databases in a modern enterprise stack or the percentage of IT budgets spent on database maintenance.
Slide 3: Databases, a Crowded Market Continued
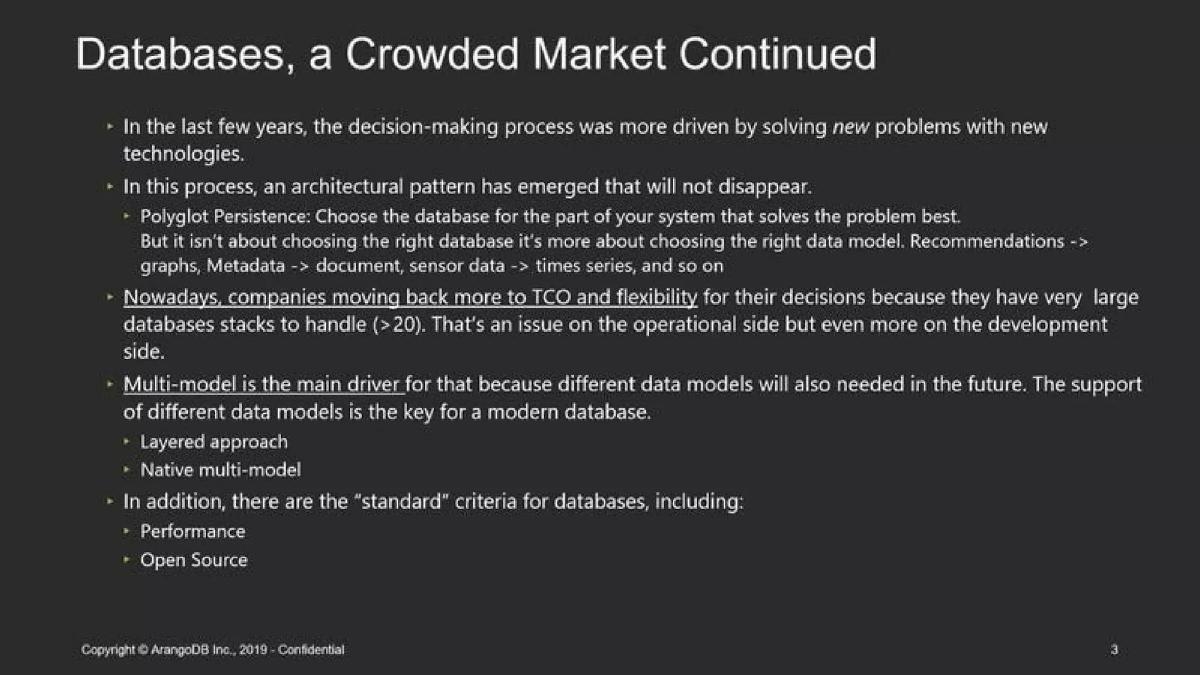
Slide 3 doubles down on the market narrative, becoming quite text-heavy. It reiterates that Polyglot Persistence won't disappear because different data models are still needed, but the current implementation (using 20+ different database stacks) is an "issue on the operational side but even more on the development side." It introduces the distinction between a "Layered approach" and a "Native multi-model" approach, listing standard criteria like Performance and Open Source.
This slide is redundant to Slide 2 and risks losing momentum. The insight that companies are moving back toward TCO and flexibility because they have "> 20" database stacks is the most valuable piece of data here, but it is buried in a bullet point. The distinction between "Native" and "Layered" is hinted at but not yet explained, creating a cognitive load for the reader.
The strongest version of this slide would merge with Slide 2. It would use a visual representation of the "20+ database stacks" problem—perhaps a diagram showing the friction of data moving between siloed databases—rather than using two full slides of bulleted text to explain the same market shift.
Slide 4: Database Market Evolution
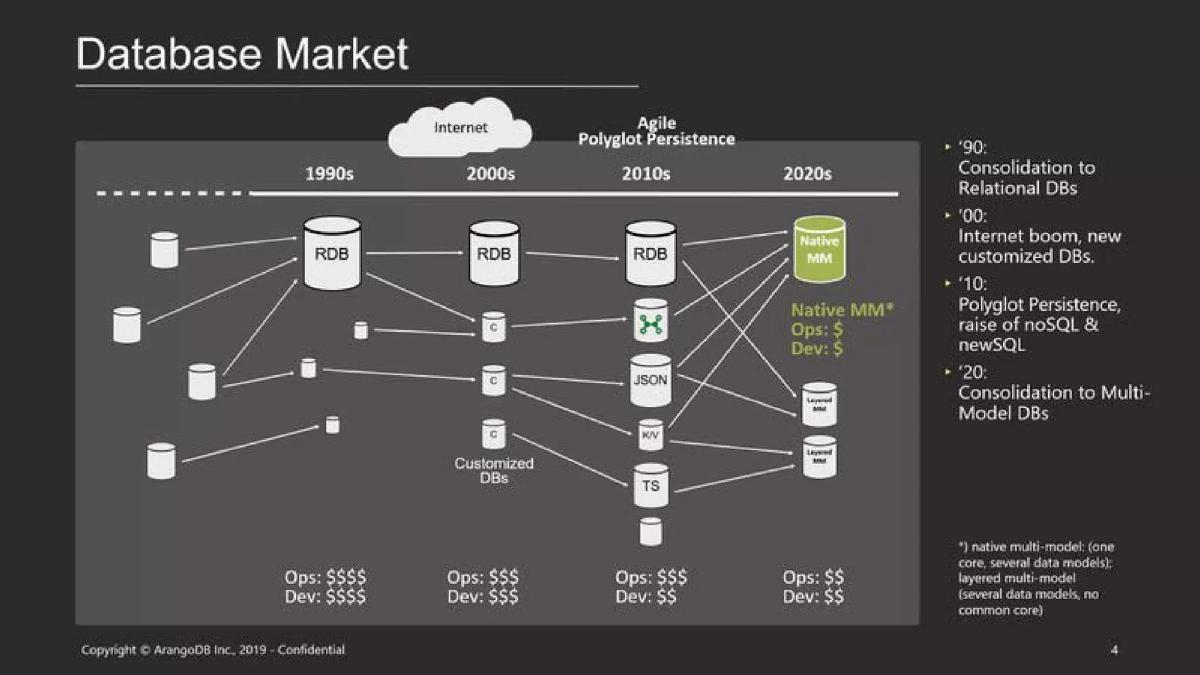
This is a complex, high-signal diagram mapping database history from the 1990s to the 2020s. It shows the shift from Relational (RDB) dominance to the "Internet boom" customized databases, then the "Polyglot" era of 2010, and finally the predicted "Consolidation to Multi-Model DBs" in 2020. Crucially, it tracks cost: '90s Ops/Dev costs are low ($), 2010s are very high ($$$$), and the Multi-Model 2020s promise a return to lower costs ($$).
An investor sees a clear "V-shaped" cost curve. ArangoDB is claiming to be the architect of the new, lower-cost era. The asterisked definition of "native multi-model" (one core, several models) vs. "layered" (several models, no common core) is a critical competitive moat. It suggests that competitors trying to bolt on graph capabilities to a document store (or vice versa) will never achieve the efficiency of ArangoDB.
The slide is visually dense. The cylinder icons and connection lines require significant study to understand. The strongest version would simplify the iconography and highlight "ArangoDB" as the specific "Native MM" leader in the 2020s column to make the conclusion unmistakable.
Slide 5: Native Multi-Model Approach
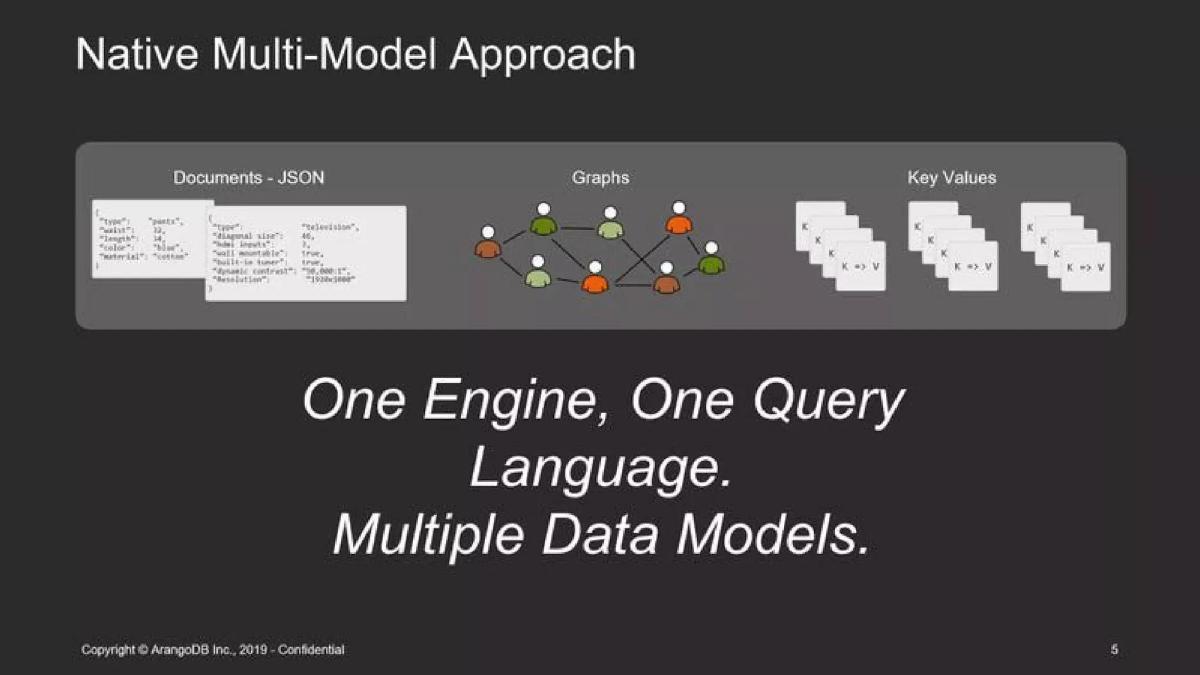
This slide provides the technical "How." It shows a central grey box containing JSON documents, node graphs, and key-value pairs. The headline text is the key takeaway: "One Engine, One Query Language. Multiple Data Models." It shows code snippets for JSON and key-value pairs to demonstrate the simplicity.
This is the "Magic" slide. It answers the technical skepticism of "How can one database do three things well?" by emphasizing the single engine. By showing that a developer only needs to learn one query language (AQL) to handle three distinct data structures, the deck reinforces the productivity gains mentioned in the market slides.
While the visual is clear, it lacks a "Graph" code snippet to match the JSON and Key-Value examples. Since graphs are often the most difficult model for developers to master, showing how ArangoDB simplifies graph queries compared to the status quo would be a powerful addition here.
Slide 6: Product Positioning
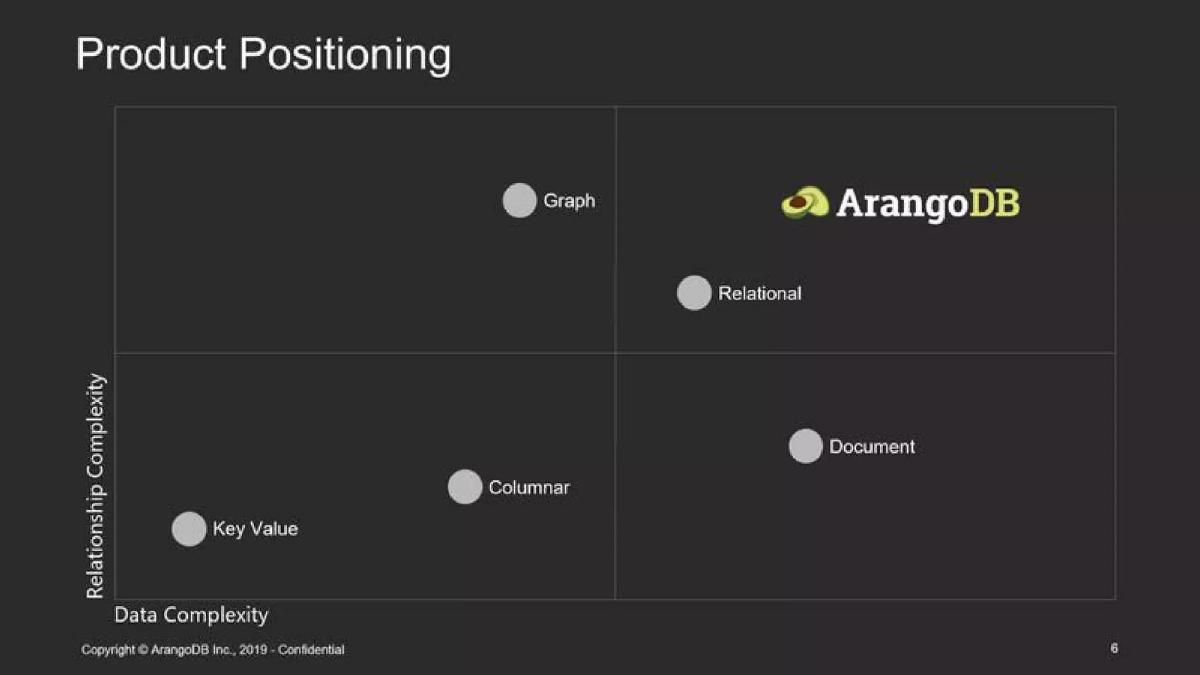
This is a standard 2x2 matrix positioning ArangoDB against other database categories. The axes are "Data Complexity" and "Relationship Complexity." Relational DBs are high on data complexity but lower on relationship complexity compared to Graphs. ArangoDB is placed in the top-right quadrant: the only solution that handles both high data complexity and high relationship complexity.
Investors use this to understand the competitive landscape. By placing ArangoDB above Neo4j (Graph), MongoDB (Document), and Redis (Key-Value), the company is claiming it can do what any one of those can do, plus what the others do. It positions ArangoDB as the "superset" of modern database needs.
The slide is effective but lacks specific competitors' logos on the chart, using only category names. A stronger version would place MongoDB, Neo4j, and Oracle specifically on the map to show exactly whose market share ArangoDB intends to capture.
Slide 7: Tame Complexity (Modern Ecommerce Example)
This is a "Before and After" slide using an Ecommerce App as a case study. On the left, a "Traditional" stack uses MongoDB for catalogs, Redis for carts, Neo4j for recommendations, and Oracle for transactions. This leads to "Many Databases to Administer" and "Complex Code Base." On the right, ArangoDB replaces all four, leading to "One Database to Administer" and "Lower Total Cost of Ownership."
This is the most persuasive slide in the deck. It moves from abstract concepts to a concrete use case that every investor understands. It explicitly identifies the friction points (Different Query Languages, Hindered Productivity) and shows how ArangoDB eliminates them. The visual contrast between the four logos on the left and the single logo on the right is visceral.
The slide could be improved by adding a quantitative "Result" for the Ecommerce app. Even if hypothetical, stating a percentage reduction in lines of code or a percentage reduction in infrastructure spend would ground the "Lower TCO" claim in reality.
Slide 8: Company at a Glance
This is the "Traction" slide. It lists $7.2m in funding, 48 employees, 7.2m downloads, 95+ external contributors, and 335+ production installations. It highlights growth by including January 2017 numbers in parentheses (e.g., 180 to 335 installations). It also lists logos of "Multi-Model Pioneers" like Cisco, Barclays, and NASA JPL.
The investor sees three things: momentum (installations nearly doubled), community validation (7.2m downloads and high GitHub stars), and enterprise trust (NASA, Barclays). The mention of "Fortune 10 and 500 customers" provides the social proof necessary to convince an investor that a small startup can handle mission-critical data for giants.
The layout is a bit cluttered. The world map is small and doesn't convey much information other than "we are global." The strongest version would highlight the "335+ Production Installations" as the hero metric, as it proves that people aren't just downloading the software—they are using it in live environments.
Slide 9: GitHub Stars % Growth
This slide focuses on community momentum, showing a line chart of GitHub star growth over two years. ArangoDB (yellow line) shows 325% growth, outpacing Kubernetes, Neo4j, and MongoDB. The data is updated as of 2/14/18.
In open-source software, GitHub stars are a proxy for developer mindshare. By showing that ArangoDB is growing faster than industry darlings like Kubernetes, the company is signaling that they are at the beginning of a "breakout" phase. It suggests that the developer community has already "voted" for the multi-model approach.
The chart is a "percentage growth" chart, which can be misleading if the starting numbers are small. An investor would want to see the absolute numbers to ensure ArangoDB isn't just growing quickly from a tiny base. Adding the absolute star counts (which are mentioned as 6,100+ on Slide 8) would make this more transparent and credible.
Slide 10: The Founders
The bios for Claudius Weinberger (CEO) and Frank Celler (CTO) emphasize deep technical experience and a long working relationship. Claudius has built and operated databases since 2000 and led a team of 80 through an IPO. Frank has 30 years of high-performance database experience and a PhD in Mathematics. Crucially, they have worked together for 18 years.
Investors look for "Founder-Market Fit" and "Co-founder Stability." This slide nails both. The 18-year partnership is a significant de-risking factor—investors don't have to worry about the founders falling out. The fact that they previously built bespoke databases for Deutsche Bank and NYSE Euronext proves they understand the requirements of high-stakes financial data.
The text is quite dense. The bio for Frank Celler mentions he "developed GAP," which is awarded a prize, but an investor might not know what GAP is. The strongest version would use icons or bullets to highlight specific "Career Wins" to make the slide more skimmable.
Slide 11: Investors and Industry Advisors
This slide lists current investors (Target Partners, Machao Holding AG) and two heavy-hitting advisors: Florian Leibert (CEO of Mesosphere) and Ted Dunning (Chief Application Architect at MapR). It describes their roles and how they help the company sharpen its focus.
The presence of Florian Leibert is a major signal; as the founder of Mesosphere (a leader in data center orchestration), his endorsement suggests ArangoDB is well-positioned for the modern, containerized cloud stack. Ted Dunning adds "Big Data" credibility. This slide tells the investor that the company is being guided by industry veterans who have seen the database market evolve firsthand.
The slide spends a lot of space describing the investor firms (Target Partners) rather than the value they add. A stronger version would focus more on the "Industry Advisory Council" and how their specific expertise (Machine Learning, Orchestration) is being integrated into the ArangoDB roadmap.
Slide 12: AQL - A Query Language That Feels Like Coding
This slide focuses on the ArangoDB Query Language (AQL). It contrasts SQL syntax with AQL syntax for simple queries and joins. It emphasizes that AQL is human-readable, works across all clients, and is easy for those with an SQL background.
A major barrier to database adoption is the learning curve of a new language. By showing that AQL is cleaner and more concise than SQL (especially for nested data), ArangoDB is addressing a key sales objection. The side-by-side comparison makes AQL look more modern and intuitive to a developer or a technical reviewer.
The code blocks are small and might be hard to read during a presentation. The slide would be stronger if it highlighted the specific parts of the AQL code that replace complex SQL JOINs, perhaps with callouts explaining how the native multi-model engine handles these operations more efficiently.
Slide 13: Integrated with leading Orchestration systems
This slide discusses ArangoDB's compatibility with Mesosphere DC/OS and Kubernetes. It claims ArangoDB is the first "fully certified database" for DC/OS and mentions a partner relationship with Mesosphere since 2014. It also promises Kubernetes and Docker Swarm support "later this year."
For an enterprise database, deployment and orchestration are critical. Investors see this as a "Distribution" slide. By integrating with DC/OS and Kubernetes, ArangoDB makes itself "easy to buy" and "easy to deploy" within the existing infrastructure of large companies. The 2014 partnership date shows this isn't a new pivot, but a long-term engineering strategy.
The claim "Later this year we will also support Kubernetes" is a bit dated given the 2019 copyright on the footer. If this deck was used in 2019, this should have been a completed feature. A stronger version would show the Kubernetes Operator in action or name customers already running ArangoDB on Kubernetes.
Slide 14: Performance Benchmarks
This slide provides technical validation through a large bar chart comparing ArangoDB to RocksDB, MongoDB, Neo4j, OrientDB, and PostgreSQL across various operations. It also includes a "Cluster" table showing document writes per vCPU/second, where ArangoDB ranks highly, and three small line graphs showing "Linear Scaling."
Benchmarks are a staple of database decks. The investor takeaway is that ArangoDB is competitive or superior across diverse workloads (Shortest Path, Single Read, Single Write). The "Scales Linearly" claim is crucial for enterprise confidence; it means that if the customer's data grows, they can just add more servers and the performance will scale predictably.
The bar chart is labeled "100%, 200%... 800%" but the Y-axis says "less is better." This is confusing. It usually means execution time relative to a baseline, but the visual doesn't clearly state what the 100% baseline is (is it ArangoDB?). A clearer chart would use absolute time (milliseconds) or a "throughput" metric where higher is better, as the current visualization requires too much mental arithmetic.
Slide 15: ArangoDB Enterprise
This slide introduces the commercial product. It uses a "Scalability vs. Complexity" chart to show that ArangoDB covers the ground typically held by Redis, MongoDB, PostgreSQL, and Neo4j. It lists Enterprise-specific features like Auditing, Encryption, LDAP, and "Smart Graphs." It notes that commercialization started in November 2016.
This slide transitions the deck from "Technology" to "Business." By listing features like "Multi data center support" and "LDAP," the company is showing that they have built the "boring" features that large enterprises require before they sign a $100k+ contract. The "Smart Graphs" feature is highlighted as a unique commercial differentiator.
The chart is a bit abstract. The "Kind of relational" label for the Y-axis is vague. The strongest version of this slide would clearly separate the Open Source "Community" features from the paid "Enterprise" features to show the upsell path and the monetization strategy.
Slide 16: SmartGraphs – Fast, distributed Graph Processing
This is a technical deep-dive slide showing the architecture of "SmartGraphs." It displays how a graph is partitioned across multiple DB servers (DB Server 1, 2, n) with "Coordinators" managing the flow. It visualizes the nodes and edges being distributed.
This slide addresses the "Sharding" problem in graph databases. Historically, scaling graphs across multiple servers is extremely difficult because every "join" or "traversal" might require a network hop. By showing they have a technical solution for distributed graph processing, ArangoDB is proving its "Enterprise" readiness for massive datasets.
There is no text on this slide explaining why this architecture is better or what "Foxx" is (though it appears in the diagram). An investor who isn't a database engineer will be lost. The strongest version would include a caption like: "SmartGraphs reduce network latency by 10x by intelligently sharding related data on the same physical server."
Slide 17: SatelliteCollections - Fast, distributed JOINS
Similar to the previous slide, this one visualizes "Satellite Collections." It shows "Master" collections (M) sharded across servers, while "Satellite" collections (S1-S4) are replicated to every server. This allows for local joins without network overhead.
This is another technical moat slide. It explains how they achieve high performance even in a distributed cluster. By replicating smaller, frequently joined tables (the Satellites) to all nodes, they eliminate the need to move data across the network during a query. This is a classic database optimization, and showing it here proves the team's engineering depth.
Like Slide 16, this is too visual and lacks explanatory context. The diagram uses "M1, Mn, S1, S2" without a legend. A non-technical investor will see boxes and arrows but won't understand the competitive advantage. It needs a "Benefit" headline like: "Eliminate network bottlenecks with local-speed distributed joins."
Slide 18: Roadmap - Top Features
This slide provides a detailed look at the next 18-24 months for both Community and Enterprise editions. Features include "ArangoDB Search" (C++ ranking engine), "Kubernetes Operator," "Distributed Transactions," and a "Managed Service" (DBaaS) starting with AWS. It also mentions "OneShard Database" for legacy use cases.
The roadmap shows a transition toward "Cloud-First." The "Managed Service" is the most important item here for an investor, as it represents the highest-margin, fastest-growing revenue segment for modern database companies (following the MongoDB Atlas model). The "Zero Administration" bullet point also ties back to the TCO reduction theme.
The roadmap is a laundry list of technical features. It lacks a unifying vision. Instead of just listing "Trigger" and "Improved Geo Index," the strongest version would group these under strategic themes like "Expanding Use Cases" or "Operational Simplicity" to help investors see the big picture.
Slide 19: Prepare for Next Year / Next 18 Months
This slide outlines the business goals. "Prepare for next year" focuses on hiring seasoned executives, switching to a renewable ACV/ARR sales model, and getting reference customers. "Next 18 Months" focuses on scaling the company, making the US the main territory, and building non-linear partnerships.
This is the "Execution" slide. The move from "cash-driven TCV" to "renewable ACV/ARR" is a critical shift for SaaS valuation multiples; investors want to see predictable, recurring revenue. The focus on the US market is also a standard requirement for a German-based startup looking to raise significant venture capital, as the US represents the largest database market.
The slide is a bit generic. "Substantially scale the company in all areas" is not a specific goal. The strongest version would include targets—e.g., "Hire VP of Sales by Q3," "Grow ARR to $XM," or "Launch AWS Managed Service by Q4." Specificity builds confidence in the management team's ability to execute.
Slide 20: Conclusion / Closing
The final slide shows the ArangoDB logo in a large green circle overlapping with Neo4j, Oracle, and MongoDB. It ends with a simple "Thank you!" and the company logo.
The visual metaphor of the green circle (ArangoDB) overlapping or encompassing the other three logos is a subtle but clear way to end on the "Multi-Model" message. It suggests ArangoDB is the center of the database universe or the evolution that combines the others.
This slide is a missed opportunity for a final call to action or a summary of the investment thesis. Instead of just "Thank you!", the strongest version would restate the core traction metrics (e.g., "Join 335+ customers in the Multi-Model revolution") and provide contact information.
Concrete fixes in priority order
Quantify the "Multi-Database" Pain: The market slides (2-4) argue that having multiple databases is expensive. The deck needs a hard data point on exactly how much more expensive it is (e.g., "Enterprises spend 4x more on managing polyglot stacks than unified stacks"). · Clarify Benchmarks: Slide 14 is confusing because "less is better" is applied to percentage bars. Re-visualize this using absolute units (ms) or throughput (queries/sec) to make the performance lead immediately obvious. · Explain Technical Diagrams: Slides 16 and 17 (SmartGraphs and Satellites) are purely visual. Add a single sentence of "Investor Translation" to each slide explaining the business benefit (e.g., "This architecture allows us to serve queries 10x faster than competitors at scale"). · Add Revenue/Growth Targets: Slide 19 is too vague. Replace "substantially scale" with specific ARR, customer count, or headcount targets for the next 18 months. · Define the Commercial Upsell: Clearly delineate between what is Open Source (Community) and what is Paid (Enterprise) on Slide 15. Investors need to understand the "Hook" and the "Paywall." · Consolidate Narrative: Merge Slide 2 and Slide 3. The current text-heavy market narrative slows down the deck's momentum before reaching the product solution.
Frequently asked questions
- What does 'Native Multi-Model' actually mean?
- ArangoDB is a 'Native Multi-Model' database, meaning it uses a single core engine to support Document (JSON), Graph, and Key-Value data models simultaneously, rather than bolting different models on top of each other.
- How does ArangoDB claim to reduce costs?
- The deck claims that using multiple specialized databases (Polyglot Persistence) increases operational and development costs. ArangoDB argues that a single multi-model database lowers Total Cost of Ownership (TCO) by providing one query language and one system to manage.
- What is AQL and why is it featured?
- AQL stands for ArangoDB Query Language. The deck positions it as a human-readable, coding-friendly language that replaces the need for complex SQL joins and works across all data models (Graph, Document, KV) supported by the engine.
- How does the database handle scaling?
- ArangoDB highlights 'SmartGraphs' and 'SatelliteCollections' as enterprise features that allow for fast, distributed graph processing and local-speed joins across sharded data, solving common scaling bottlenecks.
- What traction metrics does the deck disclose?
- As of early 2018 (per Slide 8), ArangoDB had over 7.2 million downloads, 335+ production installations, and 6,100+ GitHub stars, with growth outpacing MongoDB and Neo4j.