Elioplus's 17-slide deck, built in PowerPoint 2013 and dated 29 August 2016, pitches a marketplace matching SaaS vendors with resellers and asks for €350,000 for a 12-month runway. The product is real — the screenshots show live company records — and the deck names six clients, four competitors and two channel advisors with exits. It then measures the wrong things. Traction is 1,500+ registrations and 20% monthly growth, with no revenue, MRR, paying customers, active users or partnerships closed on a platform whose entire purpose is matching. The price ladder inverts, charging $29.98 per lead…
Key takeaways
- Elioplus's 17-slide August 2016 deck reports 1,500+ registered companies and 20% average monthly user growth, but never states revenue, MRR, paying customers, active users, or a single partnership actually closed on a platform whose only purpose is matching vendors with resellers.
- The pricing ladder inverts: $249/month buys 15 leads ($16.60 each) while $1,199/month buys 40 leads ($29.98 each), so the enterprise customer pays 1.8x more per unit of the exact product being sold.
- The five-year model implies €104 of monthly revenue per paying account in 2017 and €214 in 2018 — both below the $249 cheapest paid plan printed two slides earlier — then quadruples implied ARPU to €417 by 2021 with no stated mechanism.
- Slide 4 presents Collaboration and Channel Analytics as parts of a shipped 'All-in-1 Solution' with screenshots, while slide 12's roadmap dates the Collaboration Tool to 09/2016 and Analytics to 06/2017 — the product slide shows two things the roadmap says are unbuilt.
- The €350,000 ask funds a plan whose own 2017 expense line is €757,170; raise plus projected revenue equals €762,765, leaving roughly €5,600 of cash at year end and a further €284,647 loss in 2018 that no slide mentions.
- The market slide's source, Channel Excellence by Axel Schultze, is written by a man listed five slides later as one of Elioplus's two advisors — and the deck misspells his surname on that slide.
- The competition 2x2 gives every competitor a grey dot marker pinning it to a coordinate; elio has no dot and floats in the top-right corner, outside the plotted set.
- The PDF's author metadata reads 'Mike Volpe' — HubSpot's CMO at the time — rather than any of the four founders pictured, evidence the deck was typed over a downloaded template whose structure was never questioned.
What this deck actually is
Seventeen slides, 720 x 405 points — exact 16:9 — built in Microsoft PowerPoint 2013 and exported at 20:41 on 29 August 2016 with a +03:00 timezone offset, which places the machine in Greece. The file is 1.27 MB. It is a seed deck for Elioplus (branded "elio" on every slide except the cover), an Athens-built marketplace that matches SaaS vendors with resellers and distributors.
The document's PDF author metadata does not name any of the four founders pictured on slide 14. It reads "Mike Volpe" — at the time, the chief marketing officer of HubSpot, whose team published a widely downloaded free pitch-deck template. The founders almost certainly opened that template, typed over it and never touched File → Properties. It is a harmless artefact and it is also the first thing a diligence associate sees when they open the properties pane, and it tells them the deck's structure was inherited rather than argued.
The inheritance shows. Elioplus has genuinely uncommon assets for a pre-revenue seed company: a live product with real customer accounts visible in the screenshots, named logos from six paying-or-using companies, four named case regions, four channel-industry partners, and an advisory bench with two exits in the exact category. Almost none of it is quantified. The deck never states revenue, MRR, ARR, or how many of its 1,500+ companies pay anything at all — then projects €412,765 of revenue from 330 paying accounts sixteen months later, at an implied price roughly 60% below the cheapest plan printed two slides earlier.
And the two slides that carry the deck's product story contradict each other. Slide 4 presents Prospects Pipeline, Collaboration and Channel Analytics as an existing "All-in-1 Solution", with screenshots. Slide 12's roadmap dates the Collaboration Tool to 09/2016 and Analytics to 06/2017. The product slide is showing an investor two things the company's own timeline says it has not built.
Slide-by-slide walkthrough
Slide 1 — Cover
A flat blue field, the "elio" wordmark top-centre, " elioplus.com " set large in white with a yellow rule under it, and the tagline " Enabling great SaaS companies to grow globally ". A silhouetted pair of figures with arms raised on a mountain occupies the right. The word SUCCESS is set in large grey capitals at the bottom left and is cut off by the bottom edge of the slide — the descender row of the letters is sliced through.
The tagline is the best sentence in the deck. It is specific about who the customer is (SaaS companies), what the outcome is (grow globally), and it implies the mechanism (distribution). Very few seed covers manage that.
Everything else on the slide works against it. The company is called Elioplus, the logo says elio , and the headline says elioplus.com — three brand treatments on the first slide , and the one set largest is a URL rather than a company name. The mountaintop-victory stock silhouette is the single most reused image in startup design, and the deliberately half-cropped "SUCCESS" reads as an accident rather than a device, because nothing else in the deck uses cropped type. There is no date, no round name, no location, no "Seed, August 2016". A reader who receives this file eight weeks later cannot tell how stale it is, and staleness is the specific thing that kills a deck built on a "20% monthly growth" claim.
Slide 2 — What is broken in the IT industry
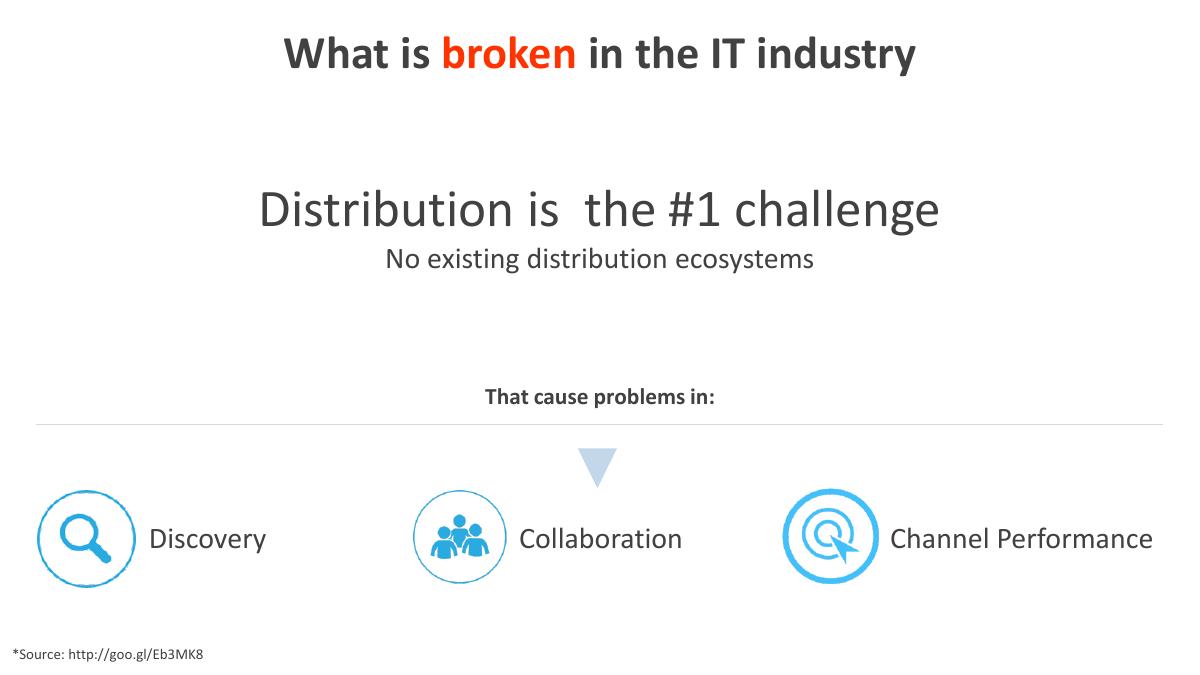
Headline in black with " broken " in red. Below it: " Distribution is the #1 challenge " (with a double space between "is" and "the"), then "No existing distribution ecosystems", then three icons — Discovery, Collaboration, Channel Performance — under the line "That cause problems in:". Bottom left, in the smallest type on the slide: Source: .
This is the deck's central claim and the slide has no numbers on it. Not one. "#1 challenge" is a ranking, and a ranking implies a survey with a sample size, a date and a population — none of which appear. The evidence is delegated entirely to a Google URL shortener link , which is a bad idea in any document and a worse one in a PDF: it cannot be clicked from a printout, it reveals nothing about the source's authority, and — as of 2024 — goo.gl links no longer resolve at all , so the only evidence on the deck's foundational slide is now permanently dead.
"No existing distribution ecosystems" is also, on its face, false, and every channel-experienced investor knows it. Ingram Micro, Tech Data, Arrow and SYNNEX are distribution ecosystems with tens of billions in throughput; Salesforce AppExchange had been running a partner ecosystem for a decade by 2016. The claim Elioplus actually wants to make is narrower and true: for small and mid-sized SaaS vendors, there is no affordable, self-serve way to find and manage resellers . That version is defensible and it is the business. The version printed is an absolute that invites the reader to disprove it in four seconds.
Slide 3 — The Solution
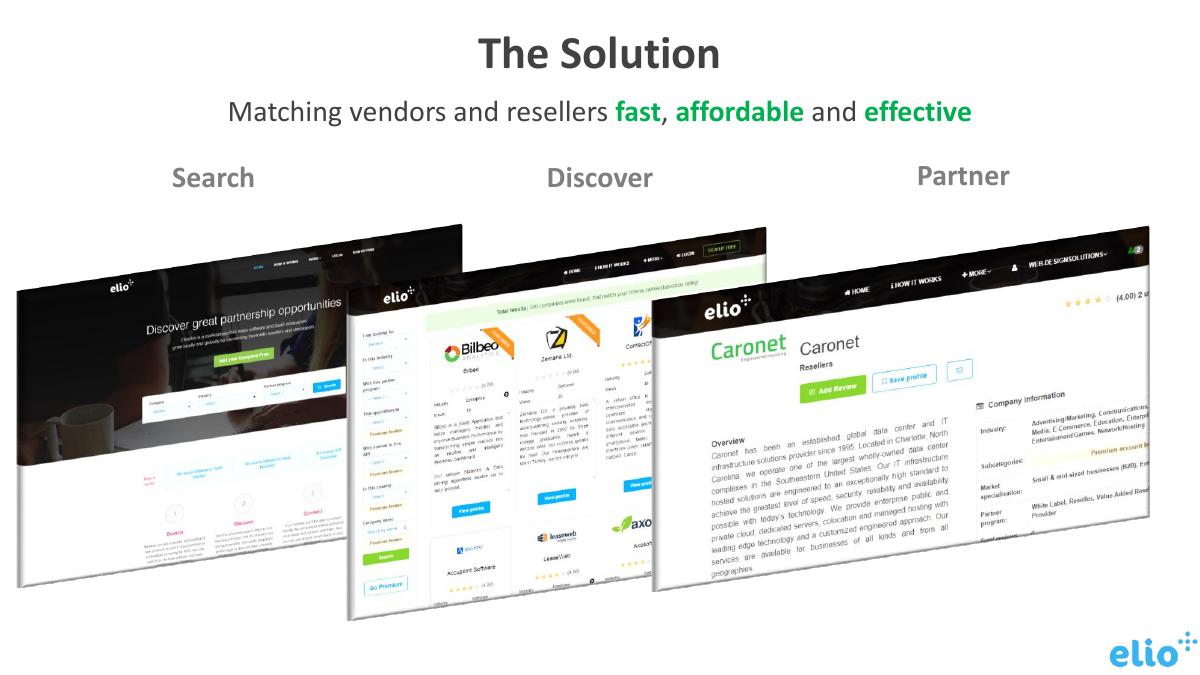
"Matching vendors and resellers fast , affordable and effective " — three adjectives in three colours, of which two are adjectives and one ("affordable") does not agree grammatically with the others. Beneath, three overlapping browser screenshots labelled Search / Discover / Partner .
The screenshots are the strongest evidence in the file and are presented at a size where none of it can be read. Zoomed in, they contain real company records — Bilbeo, Zemana Ltd, Caronet, Leaseweb — with genuine written overviews, industry and sub-category taxonomies, market specialisation fields, a partner-program field, and a four-star review with a rating count. That is a real, populated, working two-sided directory, not a mockup. It is the difference between "we have an idea" and "we have a product with data in it", and the deck communicates it at roughly 8-point effective type.
The three-step Search → Discover → Partner framing is also the right story arc and is never returned to. No step has a conversion number attached: how many searches produce a discovery, how many discoveries produce a partnership, how long the cycle takes. For a marketplace, those three numbers are the business, and a company with 1,500 registered companies has them.
Slide 4 — All-in-1 Solution
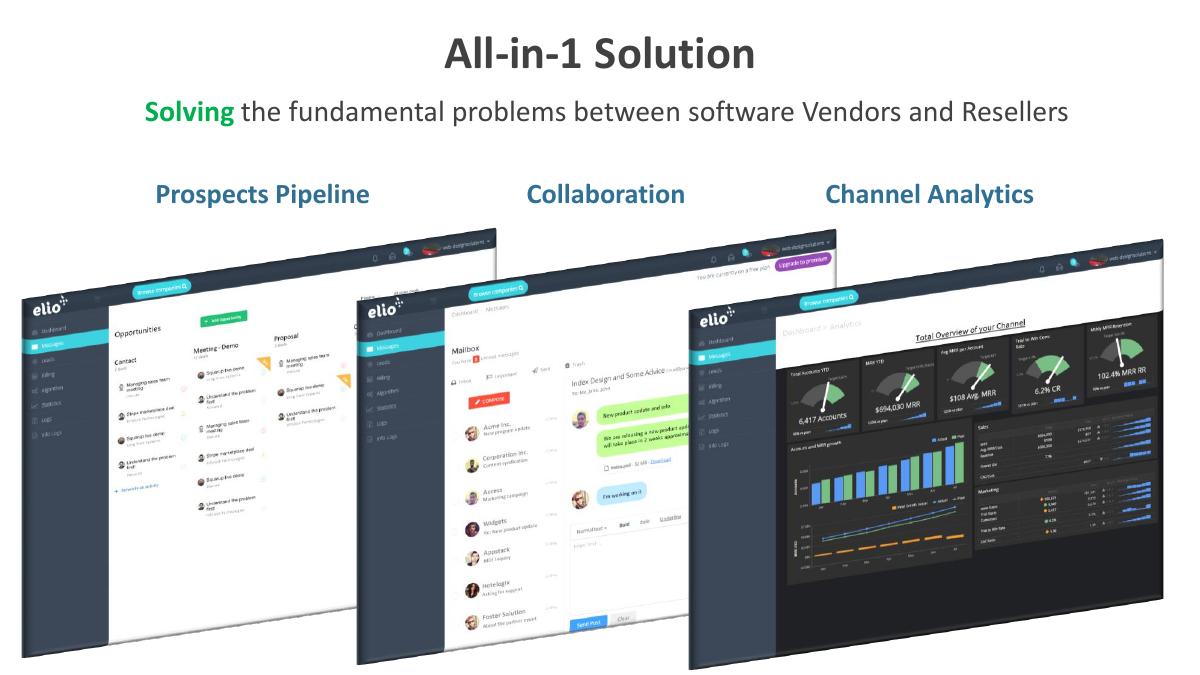
"Solving the fundamental problems between software Vendors and Resellers", with three more screenshots: Prospects Pipeline , Collaboration , Channel Analytics . The analytics panel is the most impressive image in the deck — a dark dashboard showing 6,417 Accounts, $694,030 MRR, $108 Avg. MRR/Account, 6.2% CR, 102.4% MRR RR, plus account-growth and marketing panels.
First, those dashboard numbers are demo data and are not labelled as such. $694,030 of MRR across 6,417 accounts is a substantial business, and it is rendered in the same visual register as slide 5's real traction claims. A fast reader scrolling a PDF on a phone will absorb "$694,030 MRR" as something to do with Elioplus. Nothing on the slide says "illustrative". One word would have fixed it.
Second, the roadmap on slide 12 contradicts this slide. Slide 12 places "Collaboration Tool" at 09/2016 — a fortnight after the deck was made — and "Analytics" at 06/2017, ten months out. So two of the three products presented here as part of a shipped "All-in-1 Solution" are, by the company's own timeline, unbuilt. Either the roadmap is wrong or the product slide is. An investor who spots it stops believing both, and this is exactly the kind of internal inconsistency a partner meeting surfaces in the first five minutes.
Slide 5 — Traction
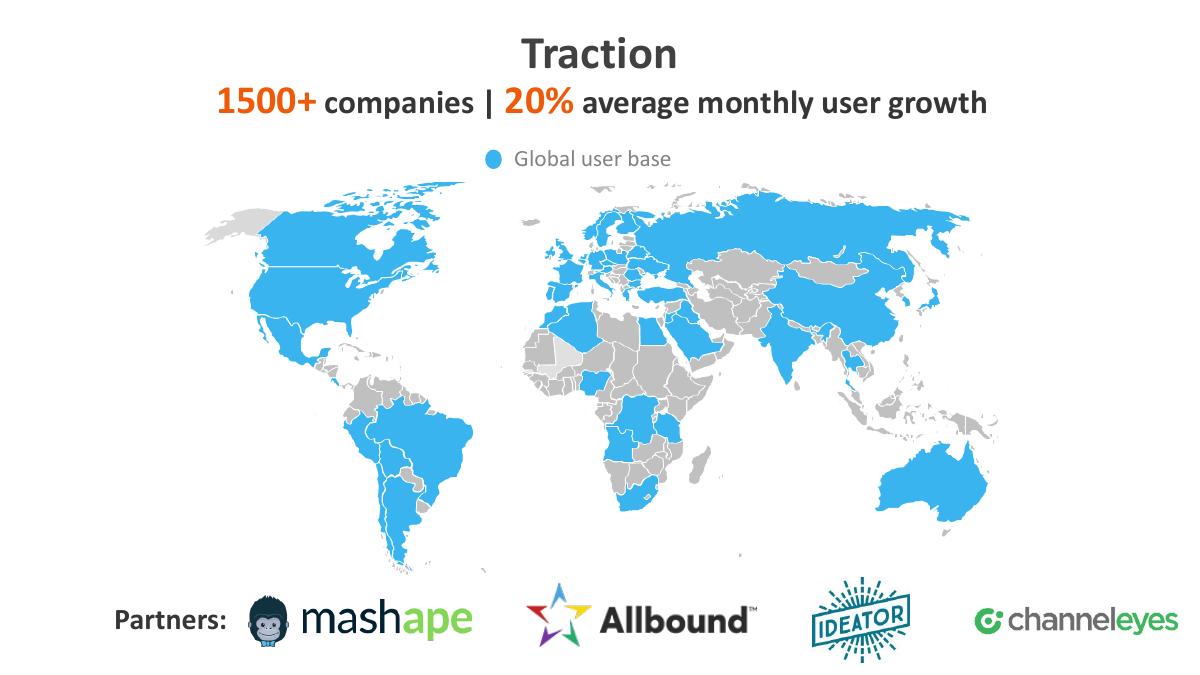
" 1500+ companies | 20% average monthly user growth " over a world map with about forty countries filled in blue, and a row of four partner logos: Mashape, Allbound, Ideator, ChannelEyes .
This is the pivotal slide and it measures the wrong thing in the wrong unit.
"1500+ companies" is a registration count . It says nothing about whether those companies logged in twice, whether they are vendors or resellers, or whether the two sides balance — and in a marketplace, the balance is the health metric. Fifteen hundred vendors and no resellers is a dead product; the deck cannot distinguish that case from a healthy one. There is no MAU, no weekly active, no repeat rate, no connections made, no partnerships closed. The product's own core event — a vendor and a reseller actually partnering — is never counted anywhere in seventeen slides.
"20% average monthly user growth" is presented as a strength and is quietly the deck's most dangerous number. Twenty percent a month compounds to 8.9x a year. Over the sixteen months from this deck to the end of 2017, 1,500 companies growing at 20% monthly reach roughly 27,700 . Slide 15 promises 45,000 companies from this raise. The deck's own growth rate does not reach the deck's own milestone — it gets there around March 2018, three months late — and no slide explains what the €350,000 buys that lifts the rate. Also unstated: over what window the 20% average was computed. Growth rates off a base of a few hundred, averaged over three or four months, are noise, and every investor reading this will assume the worst interpretation because the deck gave them no other.
The four partner logos are unexplained. Mashape (API marketplace), Allbound (partner relationship management), Ideator and ChannelEyes (channel software) are credible names in and around this category, and "Partners:" could mean integration, referral, reseller, co-marketing or a signed logo-swap. Undefined logos are worth close to nothing in diligence and are trivially cheap to define: one line each.
Slide 6 — Some of our clients
Six logos in a two-by-three grid: ERPLY, AppInstitute, IRI (The CoSort Company), Arantek, ChristianSteven, Spinbackup . No caption, no metric, no quote, no plan tier, no start date.
The word "clients" implies payment, and the deck never confirms payment anywhere. This is where an investor's suspicion crystallises: if six named companies were on the €249 or €1,199 plan, the deck would say so, because "six paying customers at an average of €X" is the single most valuable sentence a pre-Series-A marketplace can write. Its absence is read — fairly or not — as "these are free accounts".
Slide 7 — Some of our successes
A two-column table: "We helped:" / "To grow their network in:". IRI → US, Canada, Europe, Asia, Africa. AppInstitute → US, Europe, India. Spinbackup → US, Europe, Latin America. myCloudCure → Europe, Japan. Each geography list begins with a stray colon (":US, Canada…"), a copy-paste artefact repeated four times.
Three of the four logos already appeared on slide 6, so the deck spends two full slides on six companies where one slide with numbers would have been stronger. And "grow their network in Asia" is a claim with no denominator: grow from what to what, over how long, worth how much to the vendor? "AppInstitute added 14 resellers across three regions in 90 days" is a case study. "US, Europe, India" is a list of continents. The company plainly has the underlying data — it runs the platform where those connections were made.
Slide 8 — Go to market
Two columns of four: Tried and tested — Partnerships, Social Networks, Content Marketing, Cross Promotions. More to come — Events, Memberships, Paid Media, Advertising.
The two-column structure is a good instinct: it separates what works from what is hypothesis, which is more honest than most GTM slides. It then fails to say anything about either. No channel has a cost, a volume, a conversion rate or a CAC. "Tried and tested" is an assertion of evidence that presents zero evidence — and a company that has genuinely tested content marketing knows its traffic, its signup rate and its cost per signup.
The right-hand column is also a spending plan without prices, which matters because 57% of the entire raise is allocated to Sales & Marketing on slide 15 . Nearly €200,000 is being requested for four channels the deck describes with one word each. "Paid Media" and "Advertising" listed as two separate items suggests the list was padded to fill four rows.
Slide 9 — How big the opportunity is
A two-tone bar labelled "Total IT Revenues / 70% Flows through resellers " and a donut labelled $70B/year channel spend , split $14B channel recruitment and $56B channel management & enablement . Source line: "2015 Trends in the Technology Channel white paper by perks.com | Publication: Channel Excellence by Axel Schultze ".
This is a properly constructed market slide by 2016 standards — a real cited source, a segmented number, and the segment that matches the product ($14B recruitment) called out separately. Most seed decks do worse.
Three things undercut it. The bar chart on the left has no axis and no denominator — "Total IT Revenues" is drawn as a rectangle with no dollar value, so the 70% is a percentage of an unstated number and the graphic conveys nothing the sentence didn't.
More importantly, $70B is what vendors spend on channel programmes, which is not a market Elioplus can charge against. At $249 and $1,199 a month, Elioplus's realistic ceiling is a subscription fee per vendor, not a slice of channel spend. The honest arithmetic runs the other way: how many software vendors worldwide could pay €249 a month, times twelve. That is a bottom-up number in the low billions at absolute best and probably the low hundreds of millions realistically — still a fine venture market, and the deck never computes it. There is no TAM/SAM/SOM structure and no take-rate assumption anywhere.
Then there is the circularity. The market figure is sourced to Channel Excellence by Axel Schultze — and Axel Schultze is listed five slides later as one of Elioplus's two advisors . Citing your own advisor's book as the independent authority for your market size is not fraud; it is a self-reinforcing loop that a diligence associate will find and flag, and it costs nothing to avoid by adding a second, unrelated source. His surname is also spelled Schultze here and Shultze on slide 14 — the deck misspells its own advisor.
Slide 10 — Competition
A 2x2 with the vertical axis "Time-to-Market" running Slow (bottom) to Fast (top), and the horizontal axis running Expensive (left) to Affordable (right) . Plotted: Consultants (The Channel Company, top-left), Indirect Competition (Relayware and Zyme Solutions, bottom-left), Directories & Platforms (SaaSMAX and a cartoon-avatar logo, bottom-right), and elio in the top-right.
Naming Relayware and Zyme — real PRM incumbents — is honest, and choosing price and speed as the axes is defensible for a self-serve product attacking enterprise software.
But look at how elio is drawn. Every competitor gets a grey dot marker beside its logo, pinning it to a coordinate. elio has no dot. The logo floats in the top-right corner, larger than everything else, outside the plotted set — literally not on the chart it is meant to be positioned on. It is a small graphic decision that says the exercise was designed to produce a conclusion rather than to test one, which is the standard failure of the 2x2 and the reason experienced investors discount them.
The affordability axis is also inverted against reading convention: "better" runs right, which is fine, but the axis arrow on the left points outward to "Expensive", so both arrowheads point away from the origin and the quadrant labels sit on the diagonal rather than in the quadrants. And two of the four plotted competitors are represented by profile-avatar images rather than logos, one of them a cartoon face, which reads as "we could not find their brand asset".
Slide 11 — The Revenue Model
Three columns. Free : basic profile, 10 connections total, 3 leads/monthly. SMBs — $249/month : increased visibility, 20 connections, 15 leads, direct messaging, retargeting. Enterprise — $1,199/month : increased visibility, 50 connections, 40 leads, unlimited direct messaging, unlimited searches, retargeting, channel management.
This is the most quietly broken slide in the deck, and it takes ten seconds of division to see why.
SMB: $249 ÷ 15 leads = $16.60 per lead. · Enterprise: $1,199 ÷ 40 leads = $29.98 per lead.
The enterprise customer pays 1.8x more per unit of the exact thing being sold. The price is 4.8x higher for 2.7x the leads and 2.5x the connections. Every volume-priced product in the world runs the opposite way — the more you buy, the cheaper each unit gets — and a channel director evaluating this table will do the same division and conclude the pricing was set by feel. The extra features (unlimited messaging, unlimited searches, channel management) are what justify the gap, and the slide does not weight them, does not say what channel management is worth, and puts "increased visibility" in both paid tiers as if it were a differentiator.
The Free tier has its own problem: 3 leads a month, free, forever, versus 15 leads for $249. A small vendor testing the market gets 36 qualified reseller leads a year at zero cost. The free tier is not a trial; it is a permanently viable substitute for the entry paid plan for exactly the price-sensitive long tail the company is targeting, and no slide addresses conversion off it.
Finally, the currency. Pricing is in dollars; the ask and the entire five-year model are in euros. The deck never states an exchange assumption, so every revenue projection that follows is a euro figure derived from dollar list prices with no bridge shown.
Slide 12 — Roadmap
Six milestones on a timeline: 09/2016 Collaboration Tool, 12/2016 Integrations with 3rd apps, 1/2017 Launch for IT hardware vendors, 3/2017 Add IoT makers, 6/2017 Analytics, 12/2017 Reseller marketplace.
Beyond the contradiction with slide 4, this roadmap describes three market expansions in six months — hardware vendors in January, IoT makers in March — from a company that has not demonstrated a single paying cohort in SaaS. Each expansion is a different buyer, a different partner taxonomy and a different sales motion. The deck's own tagline is "Enabling great SaaS companies to grow globally"; by slide 12 the company is also serving hardware and IoT within five months of the raise.
The last milestone is the most interesting and the least explained. " Reseller marketplace " in 12/2017 is a fundamentally different business from a directory — a marketplace implies transactions, which implies a take rate, which is a far larger revenue model than $249 a month. It appears once, as three words on a timeline, and never enters the financials or the vision slide.
Slide 13 — Our Vision
"Creating a complete business development solution for IT software-hardware-cloud and IoT makers. Enabling vendors to build and manage their distribution channels."
A vision slide sitting at position 13 of 17, after the roadmap and before the team, is in the wrong place — it belongs immediately after the solution, where it frames everything that follows, or at the very end as the close. Here it interrupts the flow from roadmap to team to ask.
It also restates slides 3, 4 and 12 without adding a claim. "Complete business development solution" is broader than everything the company has shown, and it commits to four segments (software, hardware, cloud, IoT) in a single hyphenated string. The good sentence is the second one — "enabling vendors to build and manage their distribution channels" — which is exactly what the product does. It should have been the cover.
Slide 14 — The Team
Four founders with photographs: Vagelis Varvitsiotis (CTO, Lead Developer), Dimitris Kalogeros (CPO, Product Development), Christos Mantzikos (Marketing, Community and Sales), Ilias Ndreu (CEO, Business Development). Grouped captions: "Dev Team Experience — Software Development & Big Data" and "Operations Experience — Marketing & Reselling software products", both in red. A mentor, Yiannis Kanellopoulos , and advisors Marita Roebkes & Axel Shultze , "Over 25 years experience in the IT Channel with 2 exits".
A four-person team where one member has actually resold software products is a real qualification for this specific company, and two advisors with two channel exits is a genuinely strong bench for a Greek seed round in 2016.
The slide destroys most of that value in the presentation. The photographs are cropped social-media pictures — one taken in front of a hotel façade, one a profile shot of a man looking away from the camera, one poorly lit indoors. The names and titles are set in small white type over the photographs themselves , at the lowest contrast of any text in the deck; at normal viewing size the titles are close to unreadable. No LinkedIn URLs, no previous employers, no universities, no years of experience per person. "Software Development & Big Data" is a category, not a credential.
The advisors get one shared line with no photographs, no companies and no names attached to the exits — and the surname misspelling ("Shultze" here, "Schultze" on slide 9) undercuts the one asset on the slide an investor could have verified in thirty seconds. The CEO is listed fourth, last in the row.
Slide 15 — The Big Ask
350.000€ in large orange type. Beside it: " 12 month runway: channel marketing & management. 45.000 companies ". A pie: 57% Sales & Marketing, 36% Salaries, 7% Operation Costs (the three sum correctly to 100).
Naming an amount and breaking down its use puts this deck ahead of a large minority of seed decks that never ask for anything at all. Then almost every other thing an investor needs is missing: no instrument (equity, convertible, SAFE), no valuation or cap , no equity percentage , no lead investor or amount already committed , no close date , and no statement of what has been raised to date or who is on the cap table.
The milestone is the wrong kind. "45,000 companies" is a registration target, and registrations are the metric the deck has already shown are free to acquire and disconnected from revenue. The milestone that unlocks a Series A is revenue, paid conversion and retention — "€40k MRR and 12% free-to-paid conversion" — not a headcount of profiles.
And then the arithmetic. Slide 16 forecasts 2017 expenses of €757,170 . The raise is €350,000. Add the 2017 revenue forecast of €412,765 and you get €762,765 against €757,170 of spend — the plan consumes the entire raise plus all projected revenue and ends 2017 with roughly €5,600 of cash. The deck says "12 month runway" and its own model agrees to within a rounding error, which is the problem: it is a zero-buffer plan whose next year loses a further €284,647 and therefore requires another raise that is never mentioned. A 12-month runway means fundraising begins at month six, before the 45,000-company milestone lands.
Slide 16 — Financials
Total users: 45,000 → 110,000 → 180,000 → 260,000 → 320,000 · Paid users: 330 → 900 → 1,700 → 2,600 → 3,600 · Expenses: €757,170 → €2,591,795 → €6,800,000 → €9,500,000 → €13,000,000 · Revenues: €412,765 → €2,307,148 → €7,000,000 → €12,000,000 → €18,000,000 · Profits: −€344,405 → −€284,647 → €200,000 → €2,500,000 → €5,000,000
Credit where it is due: every profit cell is arithmetically correct. 412,765 − 757,170 = −344,405. 2,307,148 − 2,591,795 = −284,647. All five check. That is more than can be said for most decks in this series.
The tell is in the precision. Years one and two are stated to the euro — €412,765, €2,307,148, €757,170, €2,591,795 — because they came out of a spreadsheet. Years three to five are €7,000,000, €12,000,000, €18,000,000, €6,800,000, €9,500,000: round numbers, typed in. The model stops in 2018 and the last three columns are a shape the founders wanted the curve to have. Any investor who has built one of these recognises the pattern instantly, and it retroactively weakens the two years that were modelled.
2017: €412,765 ÷ 330 = €1,251/year = €104/month · 2018: €2,307,148 ÷ 900 = €2,563/year = €214/month · 2019: €7,000,000 ÷ 1,700 = €4,118/year = €343/month · 2021: €18,000,000 ÷ 3,600 = €5,000/year = €417/month
The cheapest paid plan on slide 11 is $249 a month. The 2017 model implies an average paying account generating €104 a month and the 2018 model €214 a month — both below the entry price, for two consecutive years. There are innocent explanations (accounts joining mid-year, annual discounts, a plan not shown), and the deck offers none of them, so the reader is left holding a price list and a revenue model that do not reconcile. Then implied ARPU quadruples from €104 to €417 across five years with no stated mechanism — no mix shift to Enterprise, no price rise, no upsell assumption, no take rate from the 2017 "reseller marketplace".
A generic inbox address, a Twitter handle and a signup link. No founder name, no direct email, no phone number, no data room, no next step. An investor who has just read a €350,000 ask is being asked to write to info@ — the address where sales enquiries and password resets land. The close of a fundraising deck should name one human being and propose one action with a date.
What Elioplus got right
The tagline. "Enabling great SaaS companies to grow globally" is specific, outcome-shaped and category-clear in seven words. Most seed covers cannot manage it. · A real, populated product. The slide 3 screenshots contain live company records with structured taxonomy fields and a review score. At seed, showing a working two-sided directory with real data beats any amount of narrative. · Named customers and named competitors. Six client logos and four real competitors (The Channel Company, Relayware, Zyme, SaaSMAX) — a deck that names who it is beating is more credible than one claiming no competition. · A cited market source. A published white paper and a book, printed on the slide, in 2016. Imperfect and circular, but far better than an unattributed billion-dollar number. · A stated ask with a use-of-funds split. €350,000, 12 months, 57/36/7. Many decks in this series never name a number at all. · Arithmetically clean projections. Every profit line in the five-year table computes correctly — a low bar that most decks miss. · Domain-credible advisors. Two advisors with 25 years in the IT channel and two exits is a serious signal for a first-time Greek founding team.
What a founder should take from this
Count the thing your product exists to do. Elioplus is a matching platform and never once reports a match. Registrations, country coverage and logos are proxies; connections made, partnerships closed and vendor-to-reseller conversion are the business. If your headline traction metric is a number that would still go up if the product stopped working, it is the wrong metric.
Divide your own pricing table before an investor does. Price per unit should fall as the plan gets bigger. Elioplus's enterprise tier charges 1.8x more per lead than its SMB tier, and that is a thirty-second check anyone can run. If the ladder inverts, either the features justify it explicitly on the slide or the prices are wrong.
Reconcile your price list with your revenue model. A model implying €104 per paying account per month next to a $249 entry plan makes a reader distrust both. If mid-year ramp or discounting explains the gap, write the sentence.
Make the roadmap and the product slide agree. Showing Analytics as shipped on slide 4 and dating it to 06/2017 on slide 12 costs more credibility than either slide earns. Label mockups as mockups and demo dashboards as illustrative.
Do not cite your own advisor as the independent market authority. If the best source for your TAM is on your cap table, find a second one.
Check that your growth rate reaches your own milestone. 20% monthly from 1,500 does not produce 45,000 in sixteen months. Either the rate accelerates and you say why, or the milestone moves.
Round numbers reveal where the model ends. €412,765 followed by €7,000,000 tells a reader exactly which years you built and which you wished for. Either model all five or present three and say the outer years are directional.
Close on a person. "info@" is not a call to action. Name the CEO, give a direct address, propose the next meeting.
Frequently asked questions
- What is the Elioplus pitch deck?
- A 17-slide seed investor deck created in PowerPoint 2013 and exported on 29 August 2016 from a machine in the +03:00 timezone, matching the founders' base in Greece. Elioplus (branded 'elio' throughout) is a marketplace matching SaaS vendors with resellers and distributors. The deck asks for €350,000 for a 12-month runway and reports 1,500+ registered companies with 20% average monthly user growth.
- How many slides is the Elioplus pitch deck?
- Seventeen slides at 720 x 405 points, exact 16:9, totalling 1.27 MB. The sequence is cover, problem, solution, all-in-one product, traction, clients, successes, go-to-market, market size, competition, revenue model, roadmap, vision, team, ask, financials and a thank-you page.
- What is the biggest weakness in the Elioplus deck?
- That it never counts a match. Elioplus exists to connect software vendors with resellers, and across seventeen slides there is no figure for connections made, partnerships closed, active users, revenue, MRR or paying customers — only 1,500+ registrations and a 20% monthly growth rate. A second, closely related weakness is that the five-year model implies revenue per paying account well below the cheapest published plan for its first two years.
- What is wrong with Elioplus's pricing slide?
- The price ladder inverts. The $249 SMB plan includes 15 leads, which is $16.60 per lead; the $1,199 Enterprise plan includes 40 leads, which is $29.98 per lead. The larger customer pays 1.8x more per unit for a price 4.8x higher that delivers 2.7x the leads. The free tier is also a permanent substitute rather than a trial, offering 3 leads a month forever against 15 leads for $249.
- Does the Elioplus deck's ask add up?
- It is internally consistent and dangerously tight. The ask is €350,000 for a 12-month runway; the financials forecast €757,170 of 2017 expenses against €412,765 of 2017 revenue. Raise plus revenue is €762,765, so the plan ends 2017 with about €5,600 of cash and a further €284,647 of losses forecast for 2018 — a second raise the deck never mentions. There is also no instrument, valuation, equity percentage, lead investor or close date.
- Which Elioplus slides should founders copy?
- Slide 1's tagline — 'Enabling great SaaS companies to grow globally' — for its seven-word clarity, and slide 3's product screenshots, which show a real, populated two-sided directory with genuine company records rather than a mockup. The go-to-market slide's split of channels into 'tried and tested' versus 'more to come' is also a more honest structure than most GTM slides, even though the deck fills it with no numbers.