Elix Incubator's April 2017 pitch deck is a 17-slide Keynote deck for California's first social-impact incubator for teen entrepreneurs. It does several things well — footnoted problem statistics, a four-phase operational program, six real teen-founded ventures and an original declining exit-share royalty model. But it never states an ask, its market slide prints $1.5M as 15% of $7M when it is 21%, and it claims to take no equity two slides before taking a 20% profit royalty.
Key takeaways
- Elix Incubator's 2017 pitch deck runs 17 slides in 4:3 Keynote format and is labelled "PUBLIC COPY" on the cover.
- The deck never states a funding ask: no amount, no round type, no use of funds, and a final slide that contains only contact details.
- Its market slide claims Elix's $1.5 million is 15% of a $7 million teen-incubator market, but $1.5M of $7M is 21%, and the $7M figure carries no source while the irrelevant $20 billion figure does.
- Slide 9 lists "Elix doesn't take equity" as a competitive advantage; slide 13 then takes a 20% royalty on incubatee profits plus a declining share of exit sales, and the deck never reconciles the two.
- The strongest slide is the four-phase incubation program — Design, Launch, Tinker, Surge — which names concrete deliverables and includes an explicit failure loop.
- Six portfolio ventures are described on slide 10 with zero traction metrics between them, which leaves the impact projections on slide 11 unsupported by any baseline.
- The financial projection chart runs to $800,000 by Q4 2019 with no legend, no historical actual, and a reference to a "current growth rate" that appears nowhere in the deck.
- Footnoting the problem statistics to Harvard Business Review and labelling projections as projections are habits most startup decks skip and both raise the document's credibility.
What this deck actually is
This is a real fundraising deck, and it tells you so on the cover: "PITCH DECK — PUBLIC COPY", Elix Incubator, April 2017. Seventeen slides, built in Keynote on macOS, 1024×768 — a 4:3 presenting deck rather than a modern 16:9 send-ahead PDF. The "public copy" label is the most honest thing on slide 1: this is the version cleared for circulation, which usually means the confidential financial detail lives in a different file.
Elix is not a software startup. It is a social-impact incubator for teenage entrepreneurs in California, and it is pitching a hybrid model — grants and donations on one side, a 20% royalty on incubatee profits plus a sliding share of exit proceeds on the other. That hybrid is the single most interesting thing in the deck, and also the thing the deck explains least well.
Read as a mission document, it is coherent, well-sequenced and genuinely moving in places. Read as an investor deck, it has one structural hole so large that everything else is secondary: there is no ask . Seventeen slides, no amount, no use of funds, no round type, no runway. The deck ends on a contact slide.
Slide-by-slide walkthrough
Slide 1 — Cover
"ELIX INCUBATOR — APRIL 2017", with "PITCH DECK / PUBLIC COPY" stacked above it. Clean, dated, unambiguous. Dating a deck is a small discipline most founders skip and it does two useful things: it tells a reader whose inbox this sat in for six months that the numbers are stale, and it stops you from re-sending a deck whose projections have already been overtaken. The missing element is the one-line description of what Elix is. A cover that says "California's first social impact incubator for teen entrepreneurs" costs nothing and means the reader arrives at slide 2 already oriented.
Slide 2 — Problem
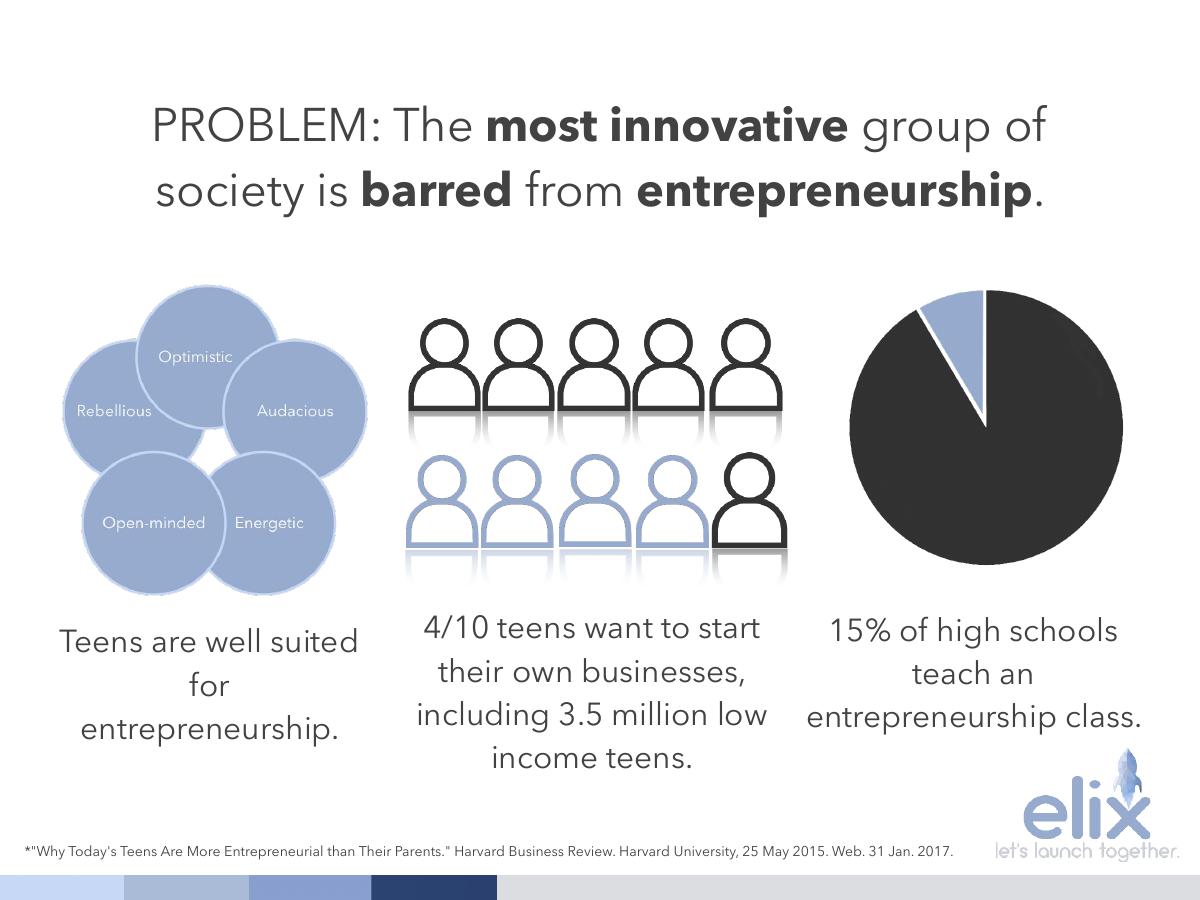
"The most innovative group of society is barred from entrepreneurship." Three supporting statistics: teens are well suited for entrepreneurship; 4 in 10 teens want to start their own business, including 3.5 million low-income teens; and 15% of high schools teach an entrepreneurship class. There is a footnote to a Harvard Business Review piece from May 2015 with an access date.
The footnote is the strongest habit in this whole deck and it recurs. Most decks assert their market facts; this one cites them in near-MLA form. The weakness is the middle statistic — the leap from "4/10 teens want to start their own businesses" to a specific 3.5 million low-income teens is a derived number, and the derivation is not shown. A single line ("40% of ~8.7M low-income US teens") would convert an assertion into arithmetic a reader can check.
There is also a stray "30%" floating in the top-right of the slide with no label attached to it. On a slide whose whole job is credibility through numbers, an orphan number is the one thing you cannot afford.
Slide 3 — Stakes
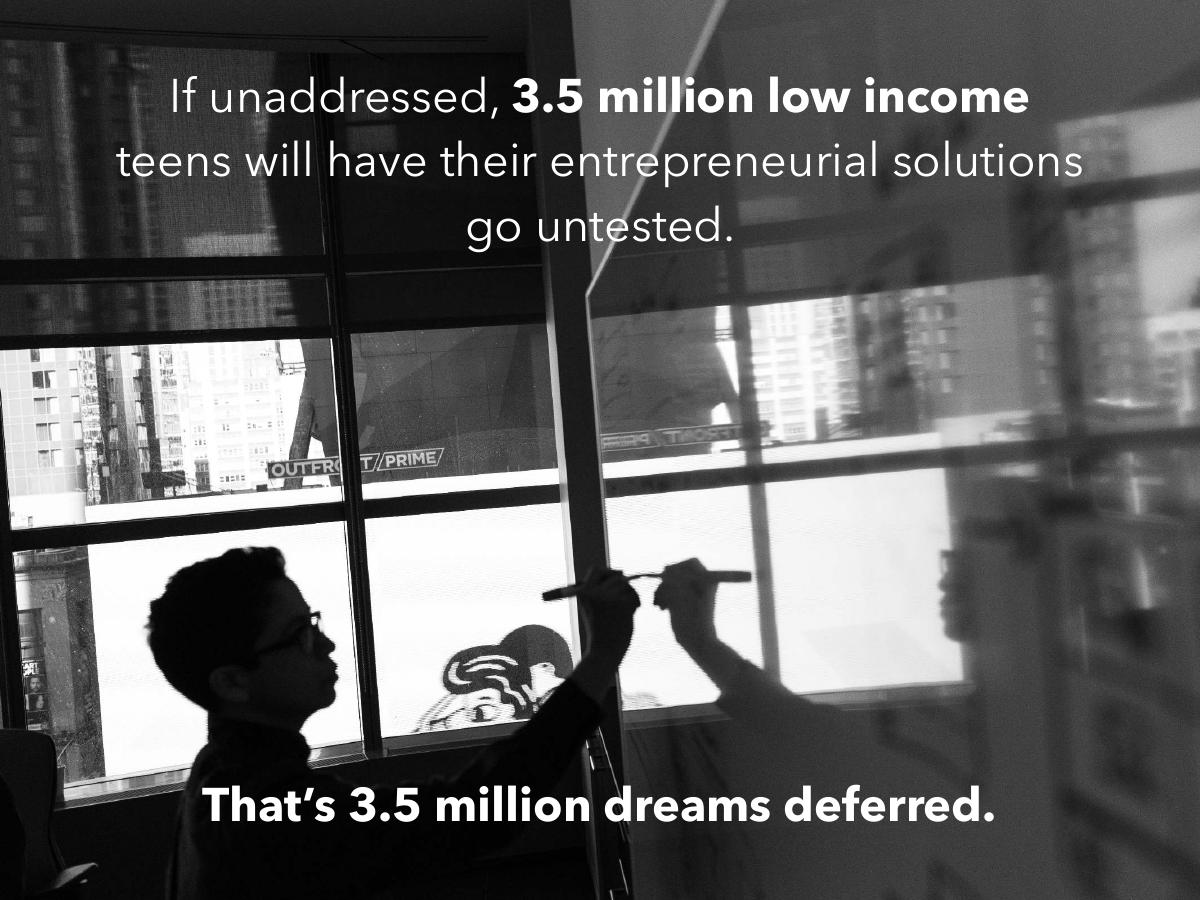
"If unaddressed, 3.5 million low income teens will have their entrepreneurial solutions go untested. That's 3.5 million dreams deferred."
This is the emotional pivot and it is well placed — one line, no chart, full slide. For a social venture pitching donors and impact investors, this slide is doing real work. In a purely commercial deck it would be the slide to cut, because it repeats slide 2's number without adding information. Keep it for foundations; drop it when you send this to a fund.
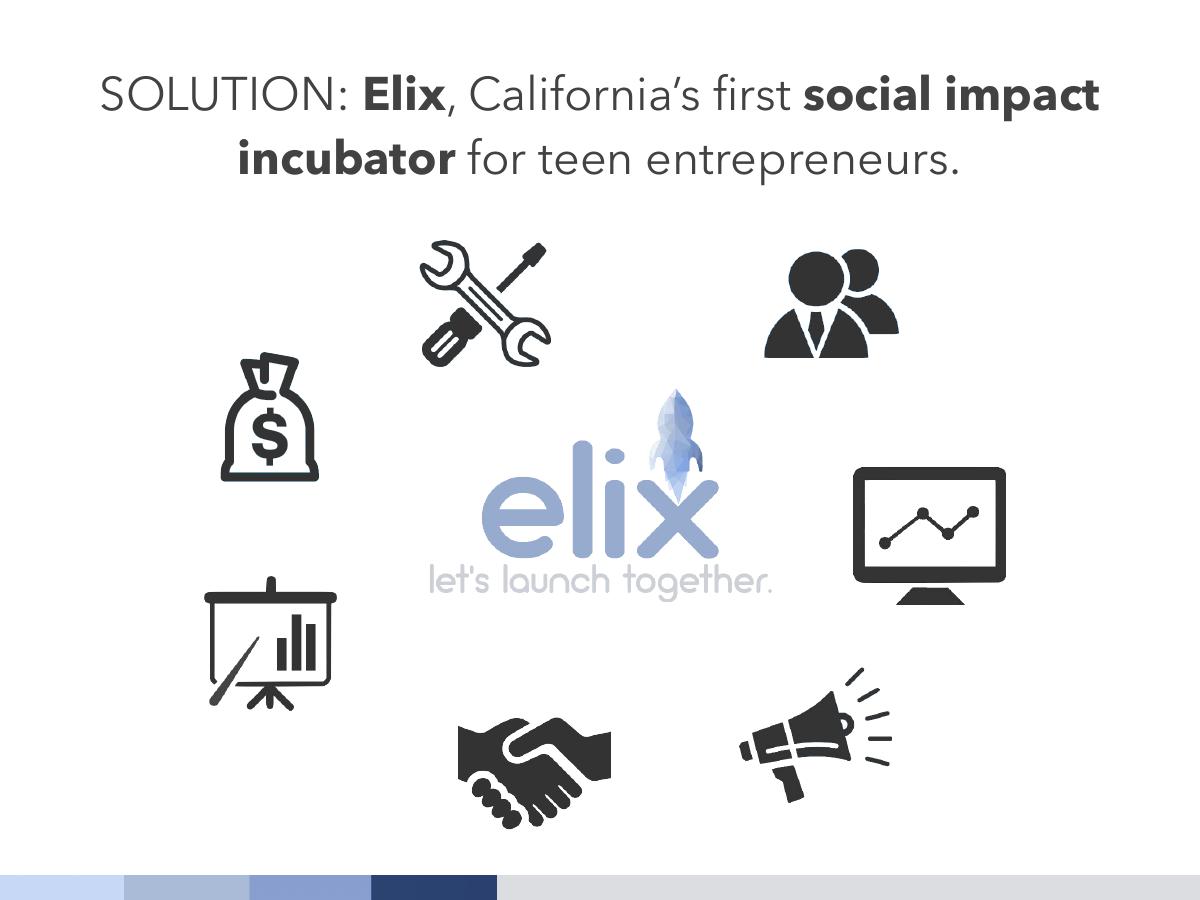
Slide 4 — Solution
"Elix, California's first social impact incubator for teen entrepreneurs."
Short, declarative, and it makes a firstness claim. Firstness claims are free to make and expensive to defend: the first question in the room is "first by what definition, and who did you check?" The deck never returns to substantiate it, and slide 12 later implies a $7 million "teen incubator" market — which by definition means Elix is not first into the category, only first into a specific slice of it. Two slides quietly contradicting each other is the kind of thing an investor notices and a founder does not.
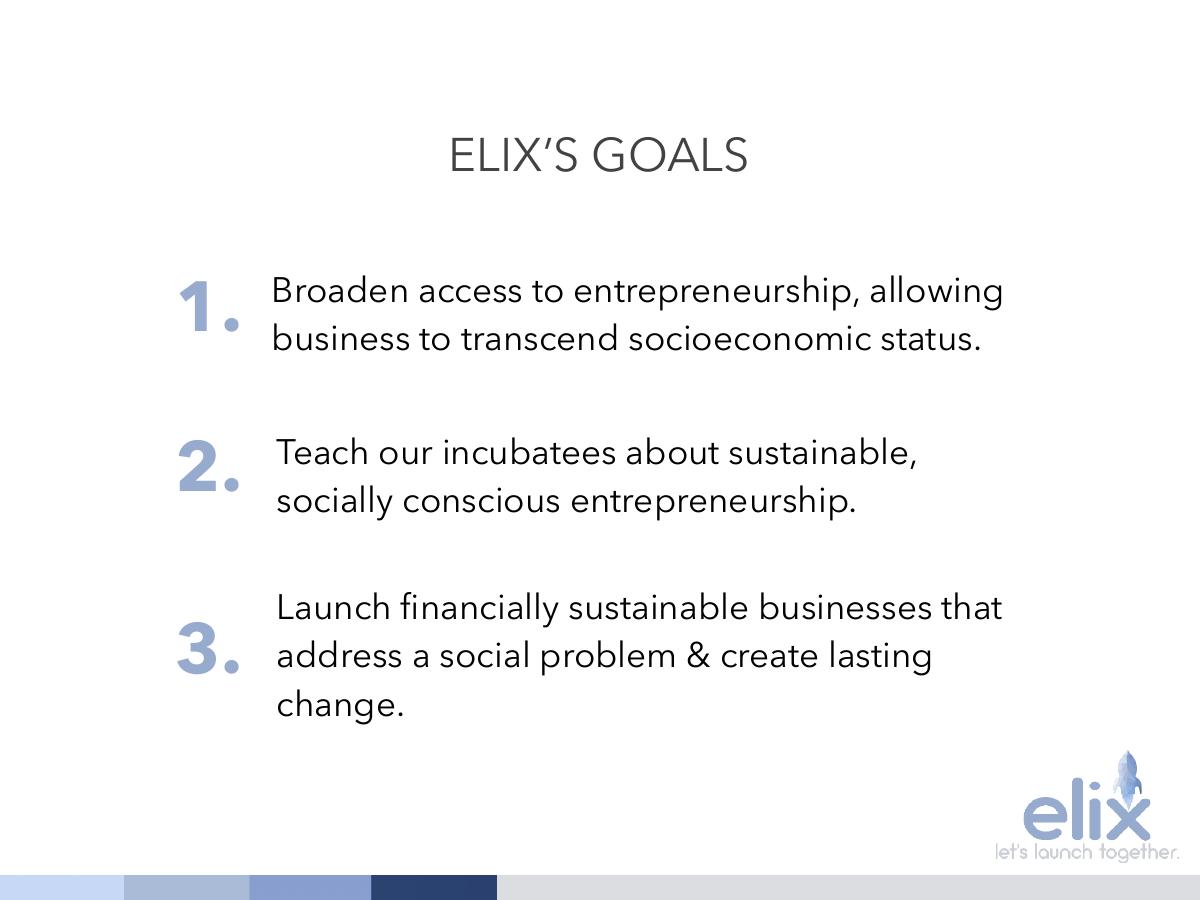
Slide 5 — Goals
Three numbered goals: broaden access to entrepreneurship so business transcends socioeconomic status; teach sustainable, socially conscious entrepreneurship; launch financially sustainable businesses that address a social problem.
These are mission statements, not goals. A goal has a number and a date attached. "Broaden access" cannot be failed, which means it cannot be succeeded at either. The deck does have real targets — 120 incubatees, 30 ventures launched — but they are buried on slide 11, six slides later. Moving those numbers up here would turn a soft slide into the accountability slide, and would make slide 11 a progress report rather than a first reveal.
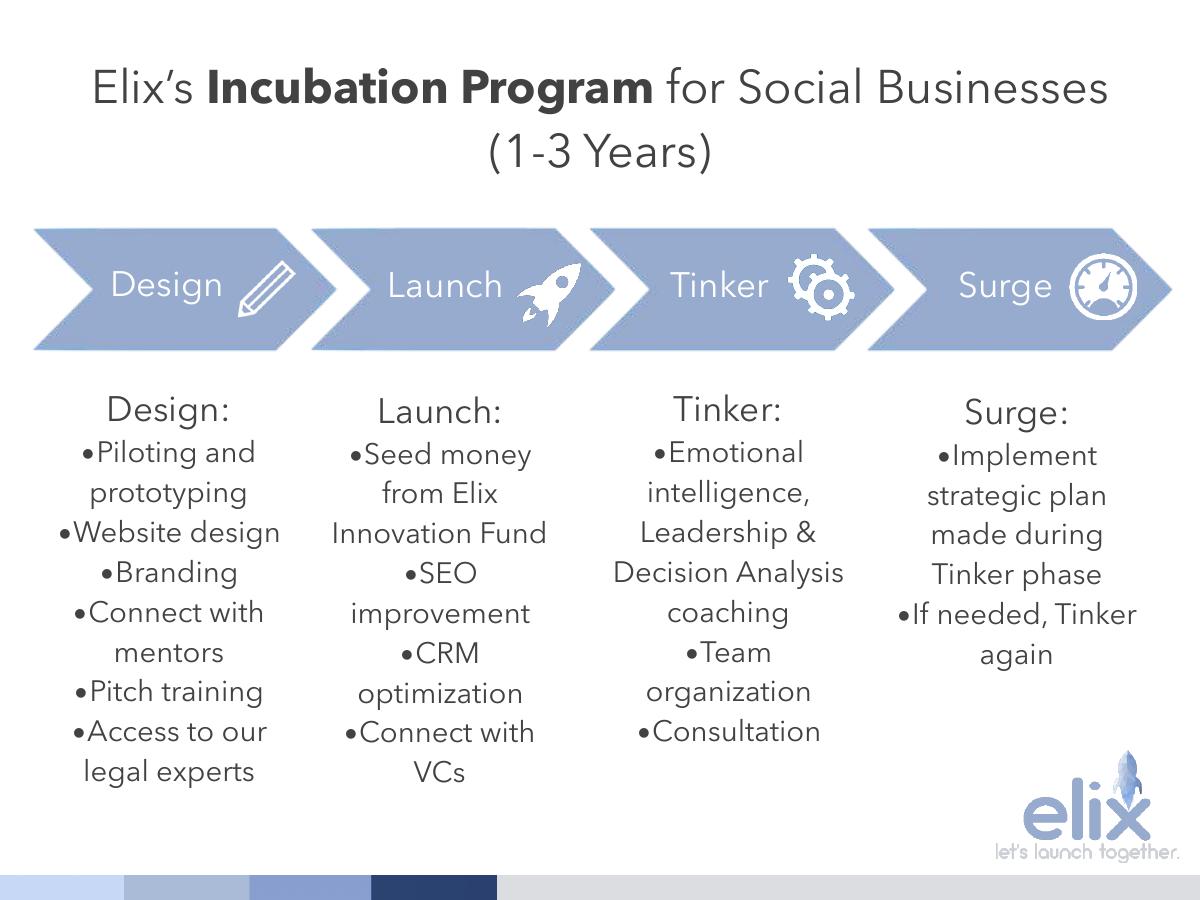
Slide 6 — The program
The four-phase incubation model over one to three years: Design (piloting and prototyping, website design, branding, mentor connections, pitch training, access to legal experts), Launch (seed money from the Elix Innovation Fund, SEO improvement, CRM optimisation, connections to VCs), Tinker (emotional intelligence, leadership and decision-analysis coaching, team organisation, consultation) and Surge (implement the strategic plan made during Tinker; if needed, Tinker again).
This is the best operational slide in the deck. It is specific, it is sequenced, it names deliverables rather than adjectives, and the "if needed, Tinker again" loop shows the team has thought about what happens when a venture stalls. The gap is capacity: nothing here says how many teens can be in a cohort, how many staff hours a cohort consumes, or what the cost per incubatee is. A one-to-three-year program with legal access and coaching is expensive per head, and this is the slide where an investor starts doing that division in their head. Give them the number before they guess it.
Slide 7 — Go-to-market
A diagram with four acquisition channels feeding into a persona at the centre — "low income 16 year old with a great social venture concept" — with arrows for social media ads (Instagram, Facebook), partnerships with school counsellors and clubs, and partnerships with community organisations (SPARK, Junior Achievement). A speech bubble on the right shows the referral loop: "Friends, can you join my company? Apply to Elix!"
Naming SPARK and JA is the right instinct: named partners are checkable, generic "community partnerships" are not. But the diagram never distinguishes between channels Elix has already opened and channels it intends to open. If those partnerships exist, this slide is proof of distribution. If they are aspirational, it is a wish list drawn as a flowchart — and the reader cannot tell which. One word per channel ("live" / "in discussion" / "target") fixes it.
There is also no cost per applicant anywhere. An incubator's real constraint is qualified applicant flow, and this slide is the only place that constraint gets addressed.
Slide 8 — Competition
A two-by-two positioning map: traditional business incubator versus social venture incubator on one axis, older incubatees versus younger incubatees on the other. Elix sits, predictably, in the corner nobody else occupies.
No competitor is named on the slide. This is the classic empty-quadrant problem: the axes have been chosen so that the founder wins by construction, which tells the reader about the founder's framing rather than about the market. Put five real logos on the map — Y Combinator, a local accelerator, a school-based entrepreneurship program, an established teen program — and the same corner becomes evidence. Leave it empty and an experienced reader assumes you did not look.
Slide 9 — Competitive advantages
Six claims: early market entrant for teen social impact incubators; incubatee incentive (Elix takes no equity in incubated companies); long incubation (one to three years, offering security and stability); value of a dollar (a social business incubator, so donations are recycled and never lose value); safety net (the Elix Innovation Fund supports incubatees struggling to make ends meet); and seed money (at least one installment).
"We don't take equity" is the standout — it is a genuine differentiator against every accelerator a reader will mentally compare this to, and it is exactly why teen founders and their parents would choose Elix. It also collides head-on with slide 13, which takes a 20% royalty on profits and a share of exit sales. Those two things can coexist, but the deck never reconciles them, and the reader will do it uncharitably: "no equity" reads as marketing once you see the royalty. Say it plainly instead — "no equity, revenue share instead" — and the advantage survives the next slide.
The rendering here is also visibly broken: a stray "1st to Market" fragment overlaps the "Value of a Dollar" text. It is a Keynote layering accident, and on a public copy it is the kind of detail that quietly signals nobody read the exported PDF before sending it.
Slide 10 — Portfolio
Six ventures, each with a one-line description: repurposing surplus technology from San Francisco tech companies for underserved communities; Savvy, an app for local election alerts, rides to the polls and coordinating protests; Cozy, disaster relief packages supporting the psychological wellbeing of children in disaster zones; a mobile app guiding California high schoolers through A-G college readiness requirements; a waterless mobile carwash using a plant-based solution; and Smart Paint, fusing nanotechnology and conventional chemistry into paint that can power your home.
This is the slide that should have been slide 3. Six actual ventures from teenage founders is the proof that the whole thesis is real, and it is sitting at slide 10 of 17, after the theory. The descriptions are also uniform — every venture gets one sentence of concept and zero traction. No users, no revenue, no pilot sites, no launch dates. Two ventures with a real number would beat six with none, and would make the impact projections two slides later land as extrapolation rather than hope.
Slide 11 — Impact measures
Labelled as a Q4 2018 projection: 500 devices matched, 60 peace marches organised, 96,000 water gallons saved, 120 incubatees, 30 ventures launched.
Labelling the projection as a projection is correct and rarer than it should be. The problem is that the metrics are downstream of the ventures, not of Elix. "96K water gallons saved" is the carwash's number; "500 devices matched" is the device-repurposing venture's. Elix's own performance is 120 incubatees and 30 ventures launched, and those two are printed smallest. An incubator is judged on cohort throughput and survival rate — what percentage of ventures make it out of Design, how many are still operating a year later. Neither appears.
There is also no baseline. A projection with no current number is just a number: how many incubatees does Elix have today, in April 2017? The deck never says.
Slide 12 — Market size
Three nested figures: $20 billion for incubators in 2015 (footnoted to the National Business Incubation Association's 2015 State of the Business Incubation Industry report), $7 million for teen incubators in 2015, and $1.5 million for Elix — described as 15% of the market.
The citation on the $20 billion is good practice. Everything after it falls apart. The $7 million teen-incubator figure carries no source at all, and it is the only number on the slide that matters — the $20 billion is not addressable by an organisation serving Californian teenagers. Then the arithmetic: $1.5 million is 21% of $7 million, not 15%. Either the market number or the share number is wrong, and a reader who checks one line of division on your market slide will check everything else too.
More fundamentally, the slide is upside-down. The honest framing for Elix is bottom-up: number of Californian high schools, realistic partnership conversion, cohort size, cost per incubatee, therefore revenue. A $20 billion top-line invites a comparison Elix cannot win and does not need.
Slide 13 — Business model
A 20% royalty on incubatee profits during incubation, plus a percentage of any exit sale on a "pyramidal scale": 15% of exit profits for years 1–5, 14% in year 6, 13% in year 7, 5% from year 15 onward. Grants and donations supplement. The worked example shows $5.00 of incubatee profit producing $1.00 of Elix revenue.
This is a genuinely original structure and it deserved more than one slide. A declining exit share that rewards founders for staying independent longer is a thoughtful answer to the criticism that accelerators clip young founders permanently. The $5.00 → $1.00 example is the right instinct too: show the mechanic on one unit before you scale it.
What is missing is the consequence. Twenty percent of profits from teenage social ventures in year one is, realistically, close to zero. The deck needs to say that out loud and then show which line actually funds operations — almost certainly grants and donations for the first several years, with royalties as a long-dated option. Instead royalties are presented first and donations are a trailing clause, which inverts the true weight of the model.
Slide 14 — Financial projections
A bar chart of "EIF Financial Projections" from Q1 2017 to Q4 2019, "based on our current growth rate", with an axis running to $800,000.
This is the weakest slide in the deck, and it is weak in a specific, fixable way. The chart has no legend, so a reader cannot tell whether the bars are revenue, funds raised, funds deployed, or assets in the Innovation Fund. "Based on our current growth rate" refers to a growth rate that appears nowhere in the deck — there is no historical figure anywhere, so there is no rate to grow from. And a projection ending at $800,000 by Q4 2019 is a claim about roughly $2 million of cumulative activity with zero supporting assumptions: no cohort count, no donor pipeline, no grant applications outstanding.
Three numbers and one label would repair it: what the bars measure, what the trailing-twelve-month actual is, and the two assumptions driving the curve.
Slide 15 — Partners, mentors and sponsors
Logo walls are load-bearing when the relationships are real and dangerous when they are not, because the reader cannot tell the difference and will assume the weakest interpretation. A one-line qualifier under each cluster — "provides pro bono legal", "hosts our Saturday sessions", "three mentors from" — turns decoration into diligence-ready evidence. As it stands, an investor's first email is "what exactly does each of these organisations do for you?", and any answer that arrives after the meeting is worth a fraction of the answer that was on the slide.
Slide 16 — Team
Five people: Isabella Liu (Founder & CEO), Haley Catton (CMO), Stash Pomichter (CFO & CIO), Brendon Wright (CTO), Andrew Yates (COO). Each has a "primary objective" statement and a short descriptor: "Debater, decision analyst, & ENTJ", "Yogini, chemist, & INFP", "Rower, coder, & ENTP", "Musician, mathematician, & ESTJ", "Statistician, engineer, & INTJ".
Naming the whole team, with roles and a stated objective per person, is more than many decks do. The Myers-Briggs types are a period detail that reads as youthful confidence — and they consume the space where the credential should be. What no investor can determine from this slide is whether any of these five has run a program, taught a cohort, raised a grant, or shipped a product. The objectives describe intent; the descriptors describe personality; the experience line is absent.
The other structural problem is titles. Five C-level roles on a team with no revealed revenue signals hierarchy over execution. "Programs", "Partnerships", "Finance" says the same thing and invites fewer questions.
Slide 17 — Contact
A single name, email address and phone number. No ask, no use of funds, no next step beyond "here is my phone number".
This is where the deck loses the most money. The final slide of a fundraising deck is the highest-attention real estate in the document, and Elix spends it on a business card. There is no amount requested anywhere in seventeen slides, no allocation of that amount across program, staff and the Innovation Fund, and no statement of what the money buys in outcomes — how many additional incubatees, over what period.
What this deck does better than most startup pitch decks
It cites its sources. Two footnotes in near-academic form, with publication and access dates. Most decks assert; this one references, and it changes how the whole document reads. · It labels a projection as a projection. Slide 11 says "2018 Q4 Projection" in the title. Decks that blur projected and actual get caught in diligence; this one does not. · The program slide is genuinely operational. Four named phases with concrete deliverables, an explicit duration and a documented failure loop is better process design than most seed-stage companies can show for their own product. · The business model is original and shown with a worked example. A declining exit share and a $5.00 → $1.00 illustration beats a paragraph of prose about "aligned incentives". · It names its acquisition partners. SPARK and Junior Achievement are checkable organisations, not "strategic partnerships". · The problem-to-stakes sequence is well built. Statistics, then a single line of human consequence, then the solution. The emotional beat lands because it is short and unillustrated. · Every team member is named with a role. Anonymous team slides are a recurring failure in decks of this era; Elix does not make that mistake.
Where this deck would fail in an investor meeting
There is no ask. No amount, no round type, no use of funds, no runway. Seventeen slides ending on a phone number. · The market slide does not divide. $1.5M of a $7M market is 21%, not the 15% printed on the slide — and the $7M figure has no source while the irrelevant $20B figure does. · "We take no equity" versus a 20% royalty. Slides 9 and 13 make claims the reader has to reconcile alone, and the uncharitable reading wins. · Zero traction anywhere. Six portfolio ventures and not one user, dollar, pilot or launch date. The deck asks to be believed on the strength of the model. · An unlabelled financial chart. Nobody can tell what the bars measure, and "based on our current growth rate" points at a rate the deck never discloses. · "California's first" is never substantiated — and slide 12's existing teen-incubator market quietly undercuts it. · An orphan "30%" on the problem slide and a text-overlap bug on slide 9: small errors, but on a credibility-through-numbers deck they compound. · Impact metrics belong to the portfolio, not to Elix. The two numbers that measure Elix's own performance are the smallest on the slide. · 4:3 Keynote export. Cosmetic, but it dates the document instantly on a modern screen.
Mission deck versus investor deck
Cover Name, date, "public copy" Name, date, one-line description of the business
Problem Cited statistics plus an emotional stakes slide Same, with the derived numbers shown as arithmetic
Proof Six ventures described, no metrics Two ventures with users, revenue or pilots attached
Competition Empty two-by-two, no names Named competitors placed on the same axes
Market $20B top-down, unsourced $7M slice Bottom-up: schools × conversion × cohort size × cost
Model 20% royalty plus grants, no revenue weighting Which line pays the bills in years 1–3, stated plainly
Financials Unlabelled bars to $800K Labelled axis, current actual, two named assumptions
Team Roles, objectives, Myers-Briggs types Roles plus the relevant thing each person has already done
Close Contact details Amount, allocation, milestones the amount buys
How you would rebuild this deck today
Add the ask slide and make it the close. Amount, split across program delivery, staff and the Innovation Fund, and the outcome it buys: "X raises cohort capacity from N to M by Q4." · Move the portfolio to slide 3. Six teen-founded ventures is the proof the entire deck is arguing for. Lead with the evidence, then explain the machine that produced it. · Attach one metric to two ventures. Devices matched to date, users on the A-G app, cars washed. Any real number beats six concept sentences. · Rebuild the market slide bottom-up. Californian high schools, realistic partnership rate, applicants per partner, cohort capacity, cost per incubatee. Delete the $20 billion. · Fix the 15% and source the $7M — or remove both figures. One wrong division on a market slide costs more credibility than a missing slide. · Reconcile equity and royalty on one line. "No equity. A 20% profit royalty during incubation, declining exit share after." State it on slide 9 so it survives slide 13. · Label the financial chart and put the trailing-twelve-month actual next to the projection, with the two assumptions that drive the curve written underneath. · Split Elix's metrics from the portfolio's. Cohort throughput, completion rate and one-year venture survival on one slide; aggregate social impact on another. · Qualify the logo wall. One line per partner describing what they actually provide. · Swap Myers-Briggs for track record and drop three of the five C-titles. · Split the deck in two. A grants-and-foundations version that keeps slide 3's emotional stakes, and an investor version that opens on portfolio traction and closes on the ask.
The transferable lesson
The Elix deck fails in the least glamorous way a deck can fail: it argues its case well and then never says what it wants. Everything an investor needs to become interested is in this file — a real problem with cited evidence, an operational program, six live ventures, an original revenue model, a full named team. What is missing is the last two inches: the amount, the allocation, the milestones, and a market slide whose numbers survive a calculator.
That pattern is close to universal. Most decks that get a polite pass are not missing conviction, they are missing arithmetic that holds and a close that asks. The 15%-that-should-be-21% on slide 12 is not a rounding error to the reader — it is the moment they stop taking every other number at face value. And a deck that ends on a phone number instead of an ask leaves the reader to invent the round themselves, which they will not do.
Before you send your own deck, check the two things this one missed: does every derived number on your market slide actually divide, and does your final slide state the amount, the use of funds and what the money buys? If either answer is no, you are asking a reader to do work they have no incentive to do.
Frequently asked questions
- Is the Elix deck a real pitch deck for investors?
- Yes. The cover reads "PITCH DECK — PUBLIC COPY, Elix Incubator, April 2017" and the file was produced in Keynote. It is the circulated version of a fundraising deck for a social-impact incubator, though it never states a funding amount, which suggests the ask lived in a separate private version or was delivered verbally.
- What is Elix Incubator?
- Elix pitched itself as California's first social-impact incubator for teen entrepreneurs. Its program ran one to three years across four phases — Design, Launch, Tinker and Surge — offering prototyping support, branding, mentors, pitch training, legal access, seed money from an internal Innovation Fund, and coaching, aimed particularly at low-income teenagers.
- How did Elix plan to make money?
- The deck describes a hybrid model: a 20% royalty on incubatee profits during incubation, plus a share of any exit sale on a declining scale — 15% of exit profits in years one to five, 14% in year six, 13% in year seven, and 5% from year fifteen. Grants and donations supplement that revenue.
- What is the biggest mistake in the Elix pitch deck?
- The absence of an ask. Across seventeen slides there is no funding amount, no use of funds and no round type, and the final slide contains only a name, email and phone number. The second biggest is the market slide, which prints $1.5 million as 15% of a $7 million market when the correct figure is 21%.
- Which Elix slides should founders copy?
- Three. The four-phase program slide, because it names deliverables and includes a failure loop. The business model slide, because it shows the mechanic on a single $5.00 unit before scaling. And the problem slide, because it footnotes its statistics with a source and access date rather than asserting them.
- How would you improve the Elix deck today?
- Add an ask slide with the amount, its allocation and the outcomes it buys. Move the six portfolio ventures to slide three and attach one real metric to at least two of them. Rebuild the market slide bottom-up from Californian schools and cohort capacity. Reconcile "no equity" with the 20% royalty on a single line. Label the financial chart's axis.