Dynamic Materials Corporation (DMC), trading as BOOM on the NASDAQ, utilized this August 2012 investor presentation to communicate its recovery and growth following the 2008 financial crisis. The deck highlights a diversified industrial model with three core segments: Explosive Metalworking, Oilfield Products, and AMK Welding. With a market capitalization of $212 million at the time of the presentation, DMC showcased a significant revenue rebound in 2011, reaching $208.9 million. The presentation emphasizes their dominant position in niche markets like explosion-welded plates, driven by globa…
Key takeaways
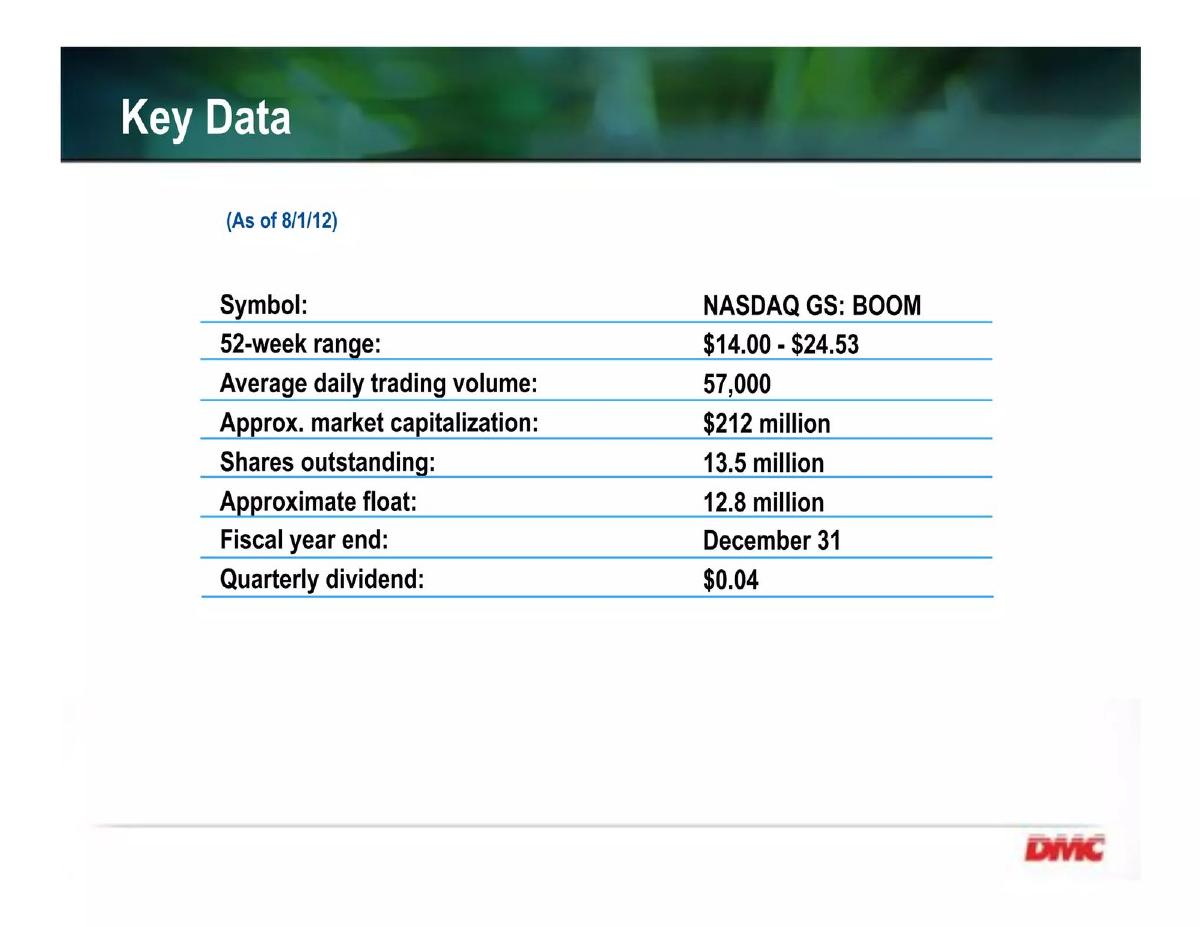
- The company trades on the NASDAQ under the symbol BOOM, with a $212 million market cap as of August 1, 2012 (Slide 2).
- Net sales saw a significant recovery in 2011, rising to $208.9 million from $154.7 million in 2010 (Slide 3).
- Explosive Metalworking is the primary revenue driver, accounting for 60% ($126.2 million) of 2011 total revenue (Slide 4).
- The Oilfield Products segment operates under the DYNAenergetics brand, contributing 35% of revenue (Slide 4 and 7).
- DMC serves nine primary industries, including Chemical, Oil & Gas, and Power Generation (Slide 6).
- Major energy service companies like Baker Hughes and Halliburton act as both competitors and customers (Slide 8).
- Gross profit margins improved to 29% in the first six months of 2012, up from 26% in the same period in 2011 (Slide 9).
- The deck lacks a formal 'Ask' slide or a specific breakdown of how new capital would be deployed, typical of a public company update rather than a startup raise.
Introduction and Market Positioning
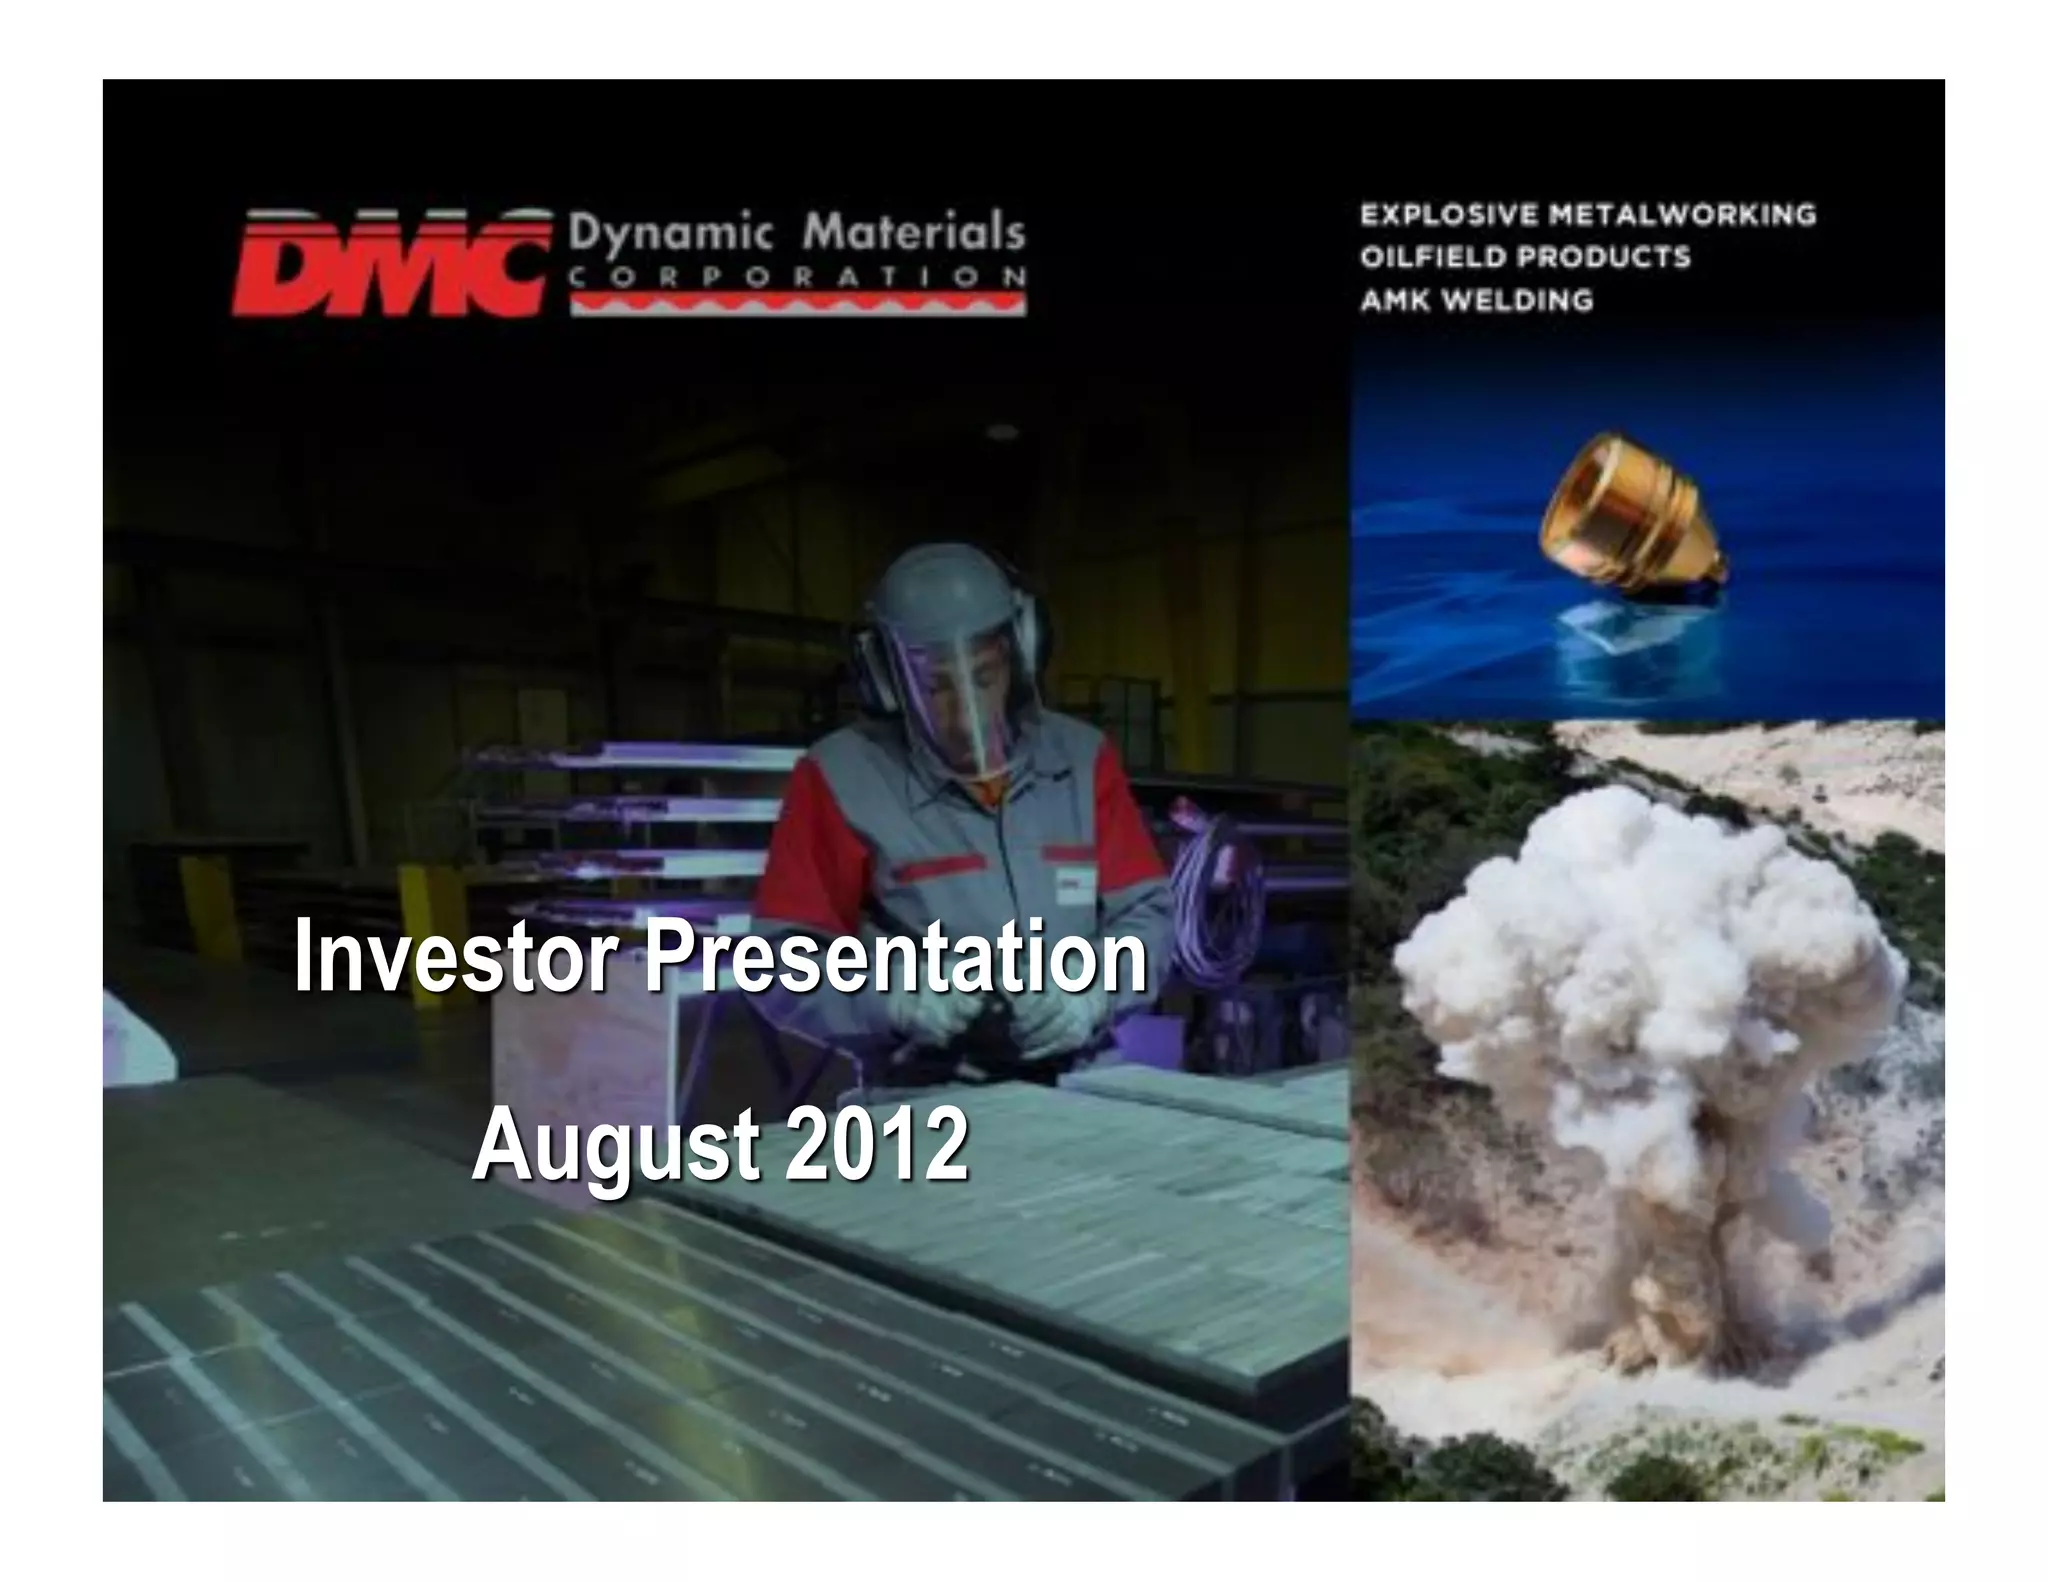
The Dynamic Materials Corporation (DMC) investor presentation from August 2012 serves as a comprehensive update for a publicly traded industrial entity. Unlike a seed-stage startup deck designed to sell a vision, this deck is designed to communicate operational stability, segment diversification, and financial recovery to the public markets. The cover slide immediately establishes the company's industrial identity, featuring imagery of heavy machinery, specialized components, and a controlled explosion, which represents their core technological advantage.
Slide 1: Title Slide
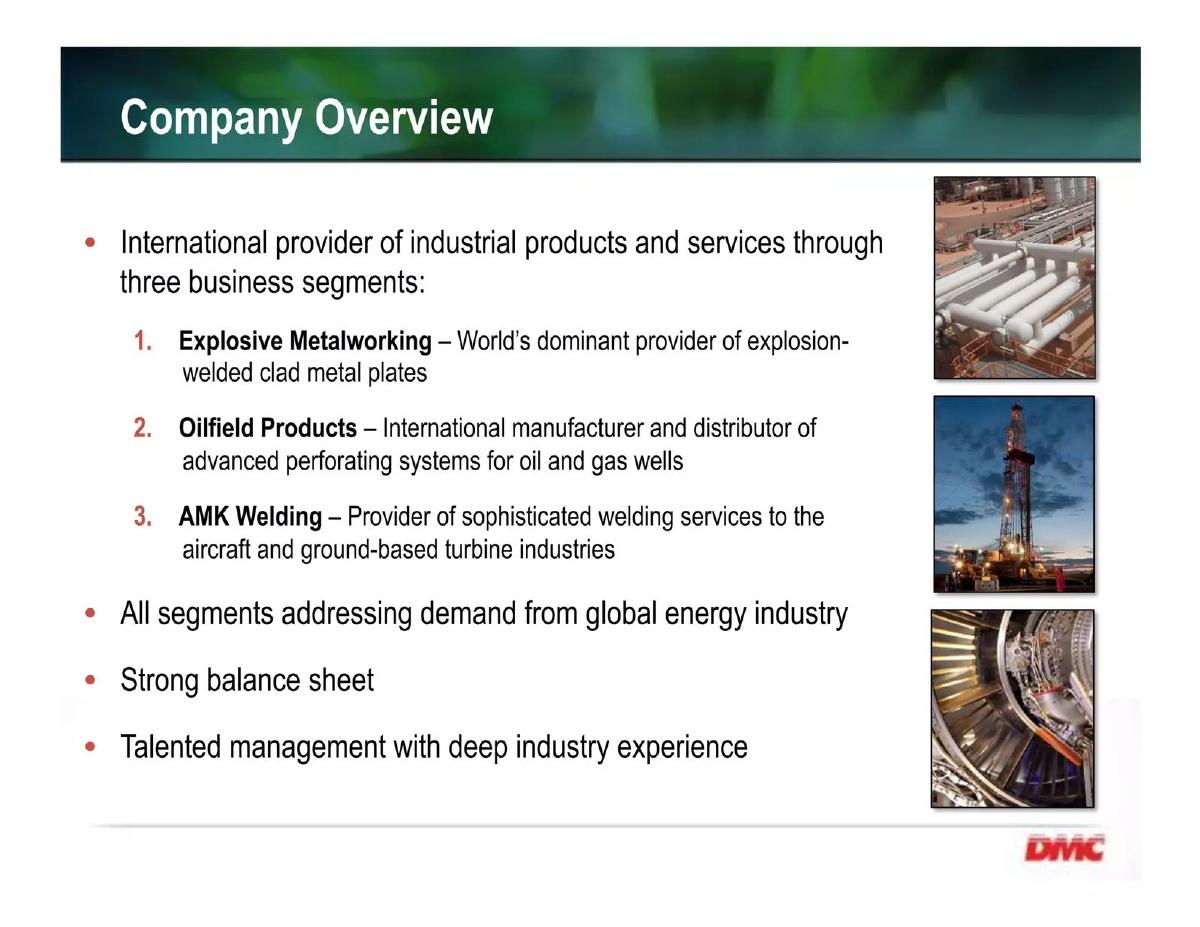
The title slide identifies the company as Dynamic Materials Corporation and lists their three primary business pillars: Explosive Metalworking, Oilfield Products, and AMK Welding. The date, August 2012, places this presentation in the post-recession recovery era, a context that becomes important when viewing the financial trends in later slides.
Slide 2: Key Data
Slide 2 provides the 'hard facts' required for public market investors. As of August 1, 2012, the company traded on the NASDAQ under the ticker BOOM. Key metrics include a 52-week range of $14.00 to $24.53, an average daily trading volume of 57,000 shares, and a market capitalization of $212 million. The inclusion of a $0.04 quarterly dividend is a signal of fiscal maturity and cash flow stability, intended to attract value-oriented investors.
Slide 3: Financial Highlights
This slide uses four bar charts to track Net Sales, Operating Income, Net Income, and Adjusted EBITDA from 2008 through the first six months of 2012. The data shows a 'V-shaped' recovery. Net Sales peaked at $232.6 million in 2008, bottomed out at $154.7 million in 2010, and rebounded to $208.9 million in 2011. The 2012 six-month figure of $98.9 million suggests a slight cooling or seasonality compared to the full-year 2011 performance. The Adjusted EBITDA chart follows a similar trend, showing a recovery to $32.9 million in 2011.
Slide 4: Revenue Breakdown
Slide 4 provides a granular look at where the money comes from. The 2011 revenue of $208.9 million is split across three segments: Explosive Metalworking ($126.2 million or 60%), Oilfield Products ($72.8 million or 35%), and AMK Welding ($9.9 million or 5%). This breakdown is crucial for investors to understand that while the company is diversified, its primary engine is the metalworking business.
Slide 5: Key Demand Drivers for Explosion Welded Plates
This slide focuses on the 'Why' behind the Explosive Metalworking segment. It identifies two macro-economic drivers: 'Corrosion' and 'Industrial CAPEX.' The slide uses imagery of a refinery and a large pressure vessel to illustrate that their products are essential components in heavy industrial infrastructure. This suggests that DMC's growth is tied to the global expansion of chemical plants and refineries.
Slide 6: Select End-Markets Served
DMC lists nine primary industries that utilize their explosion-welded products. These include Chemical, Oil & Gas, Metals & Mining, Marine, Power Generation, Alternative Energy, Industrial Refrigeration, Transportation, and Defense & Protection. By listing these, the company demonstrates that it is not overly reliant on a single industry, providing a hedge against sector-specific downturns.
Slide 7: Oilfield Products Segment Overview
This slide introduces the 'DYNAenergetics' brand. The imagery focuses on perforating equipment and specialized hardware used in oil and gas wells. This segment represents the company's move into the energy services value chain, providing high-margin, specialized consumable products for well completion.
Slide 8: Oilfield Products – Select Customers
The 'Logo Slide' for the Oilfield segment is impressive, featuring industry giants like Schlumberger, Baker Hughes, and Halliburton. A significant footnote explains a unique market dynamic: these major energy service companies are both competitors and customers. They turn to DYNAenergetics when distribution limitations or specific technical needs require third-party equipment, highlighting DMC's specialized niche.
Slide 9: Financial Performance Review
This table provides a deep dive into the P&L from 2009 to mid-2012. Notable data points include the Gross Profit margin, which rose from 24% in 2010 to 27% in 2011, and reached 29% in the first half of 2012. The Diluted EPS (Earnings Per Share) also showed a massive 133% growth in 2011 ($0.93) compared to 2010 ($0.40). This slide is designed to prove that the company is becoming more efficient as it scales back up.
Slide 10: Conclusion
The final slide is a simple 'Thank you' with the company logo. In a 30-slide deck (of which 10 are analyzed here), this usually precedes a Q&A session for analysts or institutional investors.
What Works in the Dynamic Materials Deck
The deck excels at segment clarity . By clearly delineating the three business units and providing specific revenue and margin data for each, the company makes it easy for an analyst to model their future performance. The use of a 'Key Data' slide (Slide 2) is an excellent practice for public companies, as it provides the immediate context of valuation and liquidity. Furthermore, the customer transparency on Slide 8, including the nuanced explanation of the competitor/customer relationship, builds significant credibility. It shows the company understands its complex position in the global supply chain.
What is Missing from the Dynamic Materials Deck
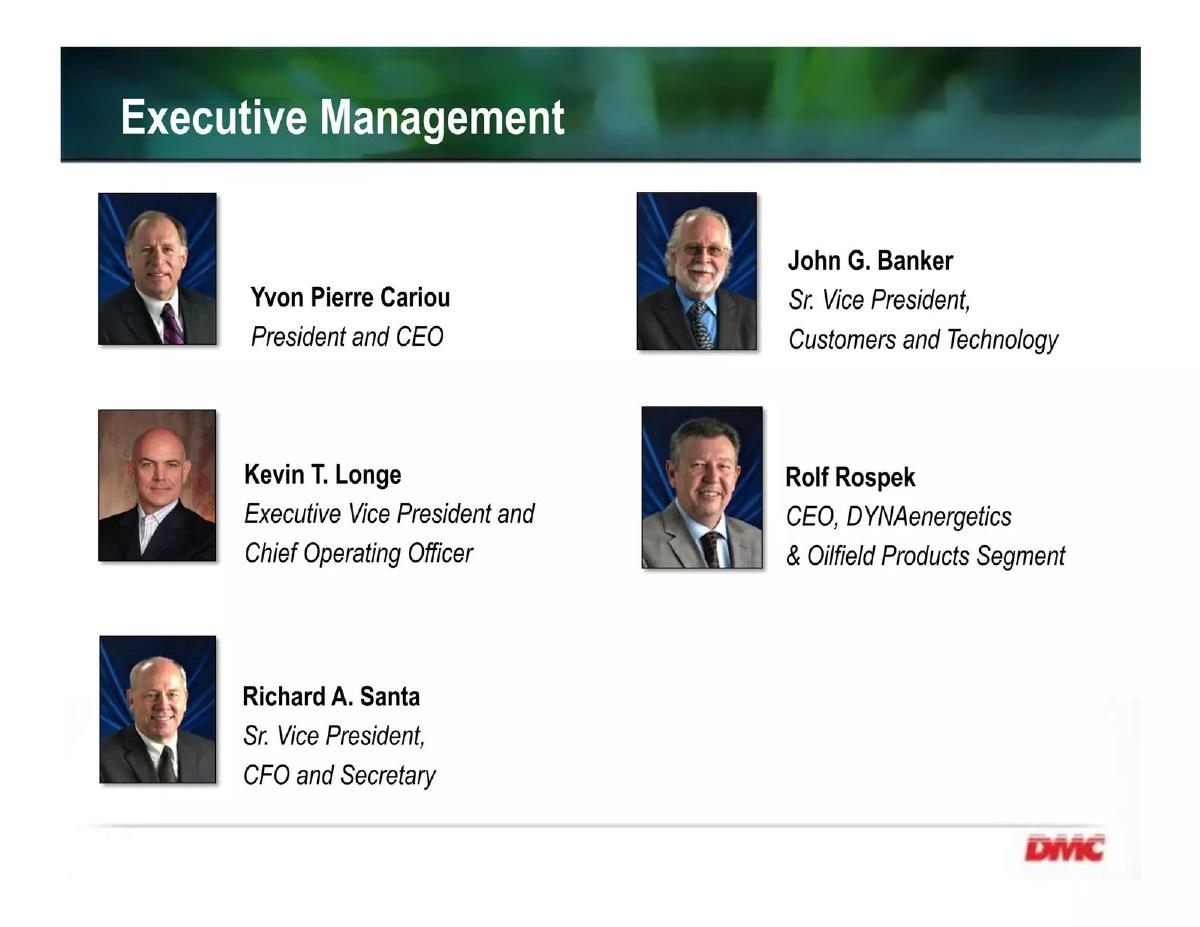
As a public company presentation, this deck lacks several elements found in startup pitches, which is expected but worth noting. There is no 'Team' slide in this selection, which is a missed opportunity to highlight the engineering expertise required for explosive metalworking. There is also no explicit 'Ask' or 'Use of Proceeds' slide. While public companies often use these decks for general IR (Investor Relations), a clear statement on strategic priorities for the next 12-24 months (e.g., M&A, R&D, or debt reduction) would have provided more direction for potential buyers. Finally, there is very little competitive analysis for the metalworking segment; the deck assumes the reader understands the niche nature of explosion cladding.
Founder Takeaways: What to Copy
Founders in the industrial or 'Hard Tech' space should emulate the Demand Driver slide (Slide 5). Instead of just saying 'the market is big,' DMC identifies the specific physical and economic catalysts (Corrosion and CAPEX) that force customers to buy their product. This connects the technology to a business necessity. Additionally, the Financial Performance Review (Slide 9) is a masterclass in presenting multi-year data. It doesn't just show revenue; it shows margins and EPS growth, which are the metrics that actually drive valuation in mature industries. If you are a late-stage founder, providing this level of transparency in your P&L trends is essential for winning over sophisticated investors.
Frequently asked questions
- What is the primary business of Dynamic Materials Corporation?
- DMC specializes in high-energy metalworking and oilfield technologies. Their largest segment, Explosive Metalworking, uses controlled explosions to bond dissimilar metals that cannot be welded by conventional means. This process creates 'clad' plates used in heavy industrial equipment for sectors like chemical processing and power generation, where corrosion resistance is critical.
- Who are the main customers for DMC's Oilfield Products?
- The company serves major global energy service providers. Slide 8 specifically lists FHE, Dialog, Pioneer Wireline Services, Horizontal Wireline Services, IPS, Voltage, Schlumberger, Baker Hughes, Halliburton, and Weatherford. Interestingly, the deck notes that some of these large players are both customers and competitors depending on the specific international location and distribution limitations.
- How did the company perform financially leading up to this 2012 presentation?
- The company experienced a volatile period following 2008. Net sales dropped from $232.6 million in 2008 to $154.7 million in 2010. However, 2011 showed a strong recovery to $208.9 million. By the first half of 2012, the company maintained steady sales of $98.9 million with improving gross margins of 29%.
- What are the key demand drivers for their metalworking segment?
- According to Slide 5, the two primary drivers are 'Corrosion' and 'Industrial CAPEX.' Because their products are used in the construction of large-scale industrial infrastructure (like the pressure vessel shown on the slide), their revenue is highly correlated with global spending on new plants and maintenance in the chemical and energy sectors.
- What is the corporate structure of the company's segments?
- DMC operates through three distinct business units. The Explosive Metalworking unit is the largest (60% of revenue). The Oilfield Products unit operates under the 'DYNAenergetics' brand (35% of revenue). The smallest unit, AMK Welding, provides specialized welding services and accounts for 5% of revenue.