Dutchie’s 2020 Series B deck is remarkably short, consisting of only nine slides. Despite its brevity, it effectively communicates a dominant market position in the rapidly expanding cannabis sector. The deck leans heavily on high-level traction metrics, specifically highlighting that 10% of all legal cannabis globally is purchased through their platform. With a focus on Gross Merchandise Volume (GMV) which reached an annualized $2.3B by Q2 2020, and a dispensary count that grew from 59 to 1,300 in two years, the narrative is one of unstoppable momentum. It omits standard sections like detail…
Key takeaways
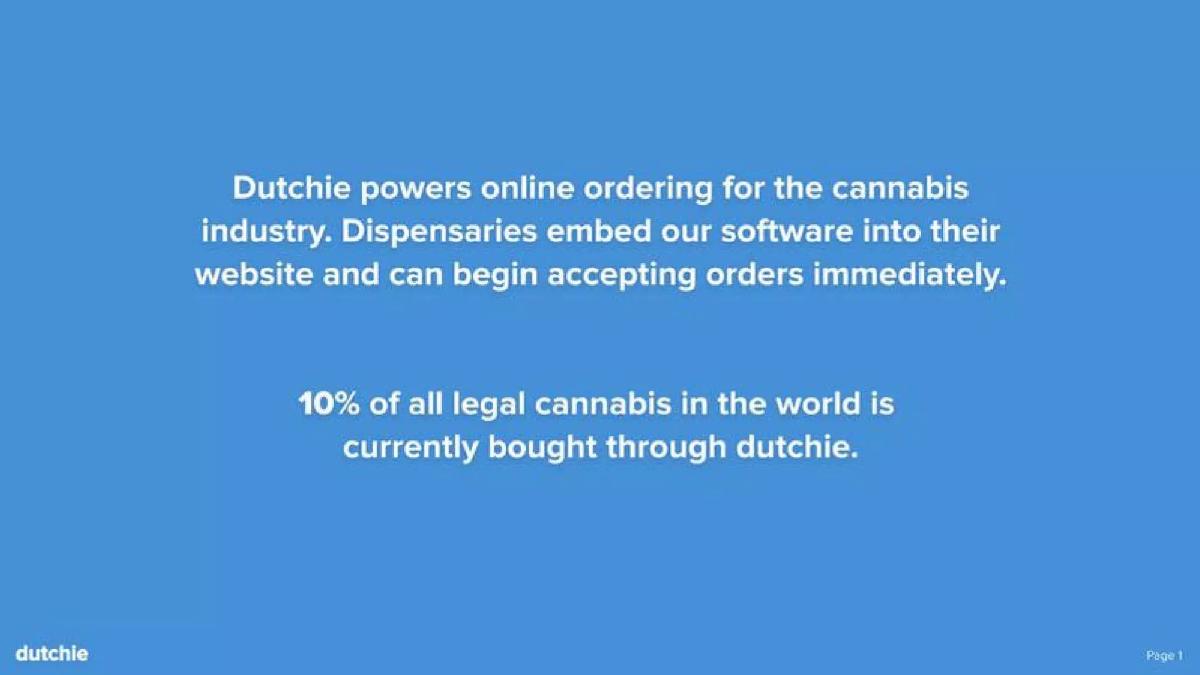
- Dutchie claims a massive market footprint, stating that 10% of all legal cannabis in the world is bought through their software (Slide 1).
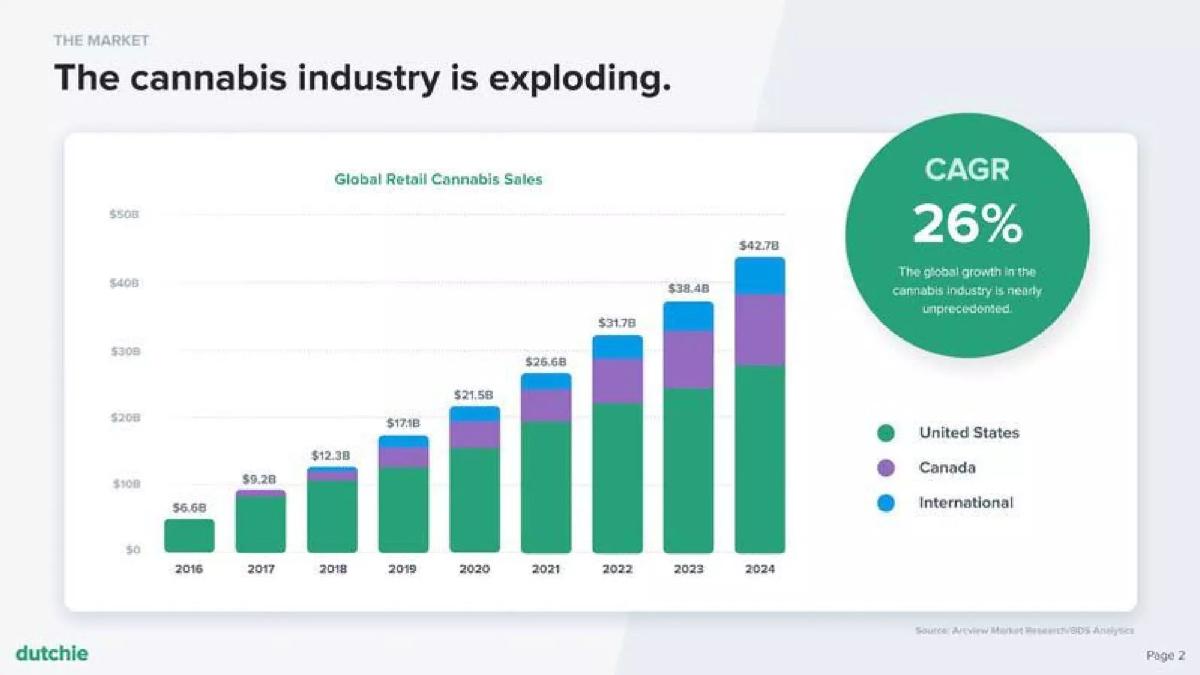
- The deck projects the global retail cannabis market to reach $42.7B by 2024, representing a 26% CAGR (Slide 2).
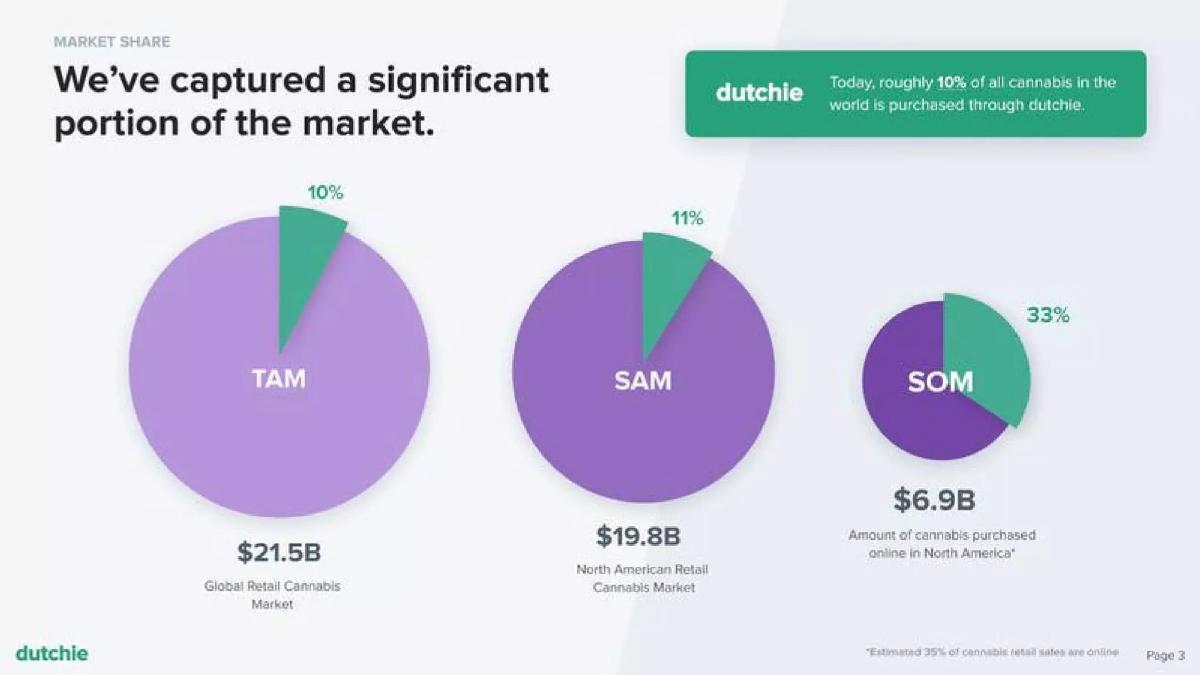
- Dutchie defines its Serviceable Obtainable Market (SOM) as $6.9B, representing the 35% of North American cannabis sales that occur online (Slide 3).
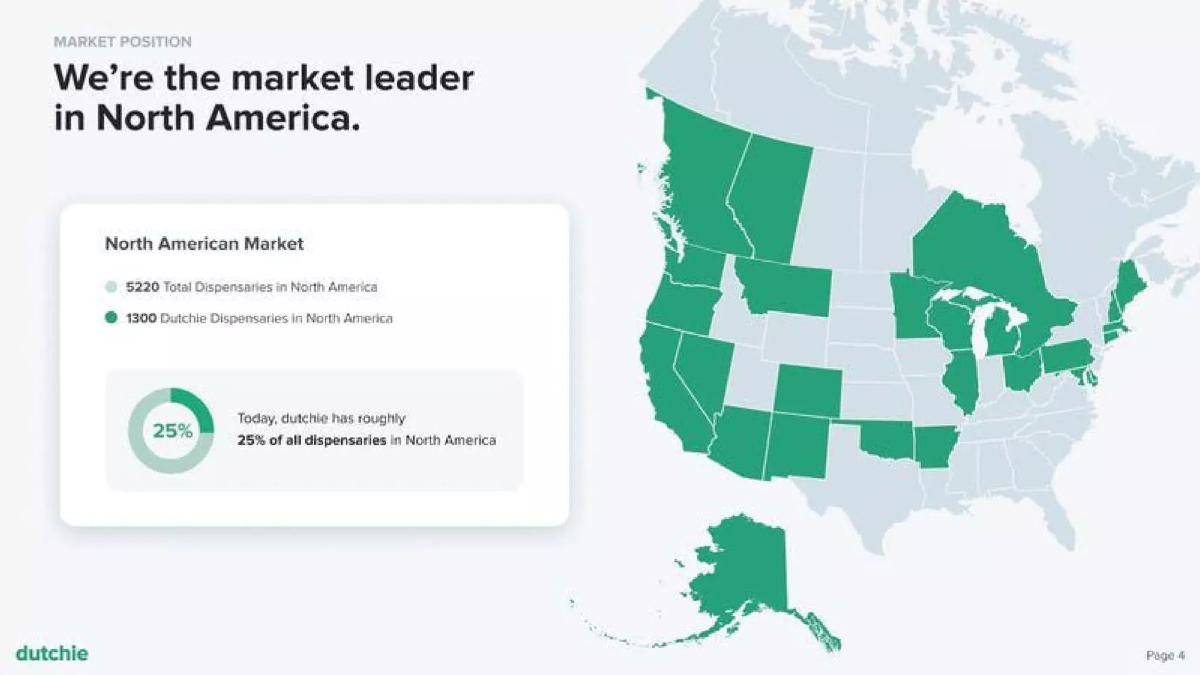
- The company achieved a 25% market share of all dispensaries in North America, totaling 1,300 locations (Slide 4).
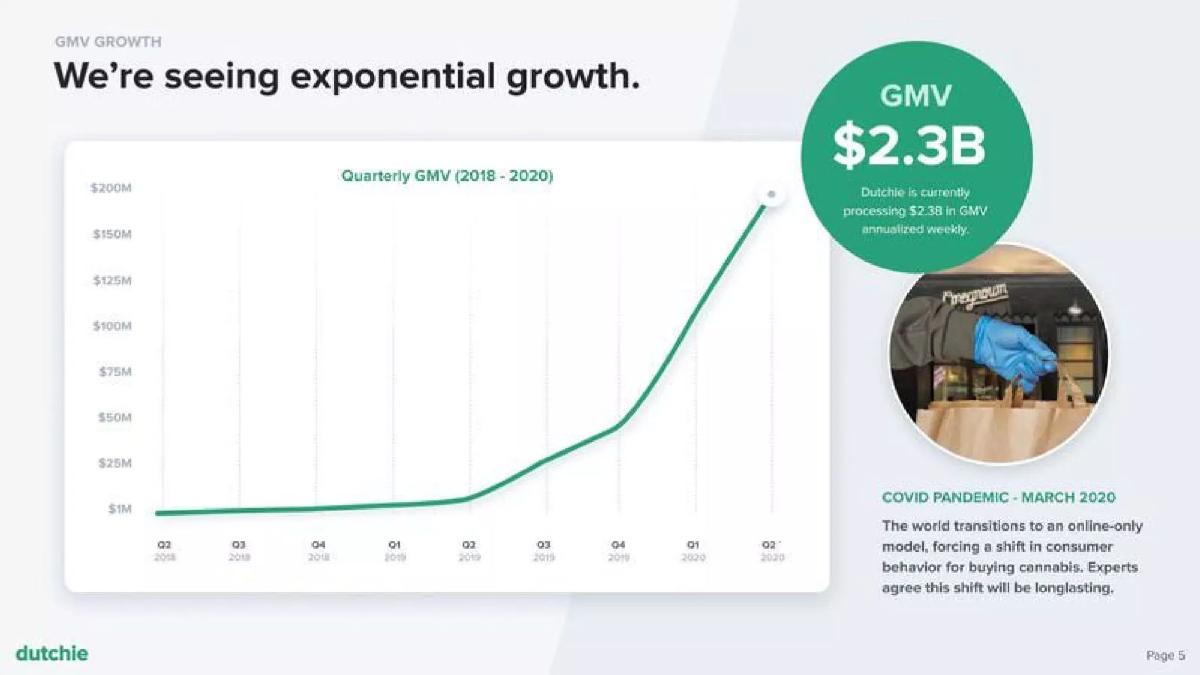
- Gross Merchandise Volume (GMV) saw an exponential spike to $2.3B annualized weekly by Q2 2020, credited partly to the COVID-19 pandemic (Slide 5).
- Dispensary adoption grew from 59 in Q2 2018 to 1,300 in Q2 2020, covering 30 states/provinces and 301 cities (Slide 6).
- The team slide emphasizes prior exit experience, noting the CEO co-founded GrubCanada, which was acquired by JustEat in 2012 (Slide 8).
- The deck completely omits a financial 'ask' slide, a competition slide, and a detailed business model or unit economics breakdown.
The Power of Brevity in a High-Growth Series B
The Dutchie Series B pitch deck is an anomaly in the world of venture capital presentations. While most Series B decks are exhaustive 20-to-30-slide documents detailing cohort analysis, churn rates, and multi-year projections, Dutchie opted for a lean, 9-slide narrative. This deck was used to raise $35 million in 2020, a year defined by the rapid acceleration of e-commerce due to global lockdowns. The deck’s primary strength is its focus on a single, undeniable truth: Dutchie had become the infrastructure for the legal cannabis industry.
By 2020, the cannabis sector was moving away from the 'Green Rush' speculative phase into an operational maturity phase. Dutchie positioned itself not as a cannabis company, but as a technology company powering a specialized retail vertical. The following teardown examines how they used minimal text and maximum data visualization to prove they were the inevitable market leader.
Slide 1: The Value Proposition
The deck opens with a bold, blue title slide that doubles as an executive summary. It defines the product in two sentences: "Dutchie powers online ordering for the cannabis industry. Dispensaries embed our software into their website and can begin accepting orders immediately."
Crucially, Slide 1 includes a massive 'anchor' metric: "10% of all legal cannabis in the world is currently bought through dutchie." This is a rare move. Most founders wait until the 'Traction' slide to drop their biggest number. By putting it on the cover, Dutchie immediately frames the conversation around market dominance. If an investor only reads the first slide, they already know the company's scale and core function.
Slides 2-3: Market Size and Captured Share
Slide 2, titled "The Market," uses a bar chart to show the industry's trajectory. It cites a 26% CAGR with global retail cannabis sales projected to grow from $6.6B in 2016 to $42.7B by 2024 . The chart is color-coded by region (United States, Canada, and International), showing that while the US is the largest driver, the growth is a global phenomenon. The source is attributed to Arcview Market Research/BDS Analytics, providing third-party credibility to the 'exploding' industry claim.
Slide 3 transitions from the total market to Dutchie’s specific slice of it. It uses three circles to represent TAM, SAM, and SOM. TAM is listed at $21.5B (Global Retail), SAM at $19.8B (North American Retail), and SOM at $6.9B . The SOM is the most important figure here, as it represents the "Amount of cannabis purchased online in North America." A footnote estimates that 35% of cannabis retail sales are online. Dutchie claims to have captured 33% of this SOM , reinforcing the 10% global market share claim from the cover slide. This logical flow—from the total world market to the specific digital niche they own—is a textbook example of how to present market sizing.
Slide 4: Geographic Dominance
Slide 4, "Market Position," uses a map of North America to visualize their footprint. The map highlights states and provinces in green where Dutchie has a presence. The data box on the left provides the hard numbers: 1,300 Dutchie Dispensaries out of 5,220 Total Dispensaries in North America . This results in a 25% market share of all physical locations. This slide is vital because it proves that Dutchie isn't just a regional player; they have successfully scaled across dozens of different regulatory environments in the US and Canada, which is one of the hardest hurdles in the cannabis industry.
Slides 5-6: The Exponential Growth Curves
Slide 5 focuses on "GMV Growth." The chart shows a relatively flat line through 2018 and early 2019, followed by a vertical spike starting in Q4 2019 and accelerating through Q2 2020. The headline metric is $2.3B in GMV (annualized weekly). A callout box addresses the elephant in the room: the COVID-19 pandemic . It notes that the transition to an online-only model forced a shift in consumer behavior that experts agree will be "longlasting." By including the photo of a gloved hand delivering a brown paper bag, Dutchie grounds the abstract GMV data in the reality of the 2020 retail environment.
Slide 6 mirrors this growth with "Dispensary Count." The bar chart shows the climb from 59 dispensaries in Q2 2018 to 1,300 in Q2 2020 . This slide adds two other important dimensions: 30 states/provinces and 301 cities . This demonstrates that their growth isn't just coming from existing customers doing more volume, but from a rapid, widespread acquisition of new retail partners.
Slide 7: Product and Design
Slide 7 is the only slide dedicated to the actual software interface. The headline, "We’re driven by product and design," is supported by a screenshot of a dispensary's online menu ('The Green Leaf'). Annotations point out that the software "embeds seamlessly into a dispensary’s website" and that "thoughtful product design leads to higher conversions." While this slide is light on technical details, it emphasizes the user experience (UX) for the end consumer, positioning Dutchie as the 'Shopify' of cannabis—a clean, white-label solution that stays out of the way of the dispensary's brand.
Slide 8: The Team and The Playbook
The final content slide (Slide 8) focuses on the founders and the organizational structure. The headline "We’ve been here before. We know the playbook" is a direct appeal to investor confidence. Ross Lipson (CEO) is credited with co-founding GrubCanada , which was acquired by JustEat in 2012. Zach Lipson (CPO) is credited with founding a design agency and a fintech platform acquired in 2017. This establishes that the founders have successfully navigated the full startup lifecycle from inception to exit.
The slide also includes a "Team Breakdown" showing a 95-person total headcount , with 30 in Engineering and 21 in Support. This shows a product-heavy organization. Finally, they list logos of core team members' former employers (GrubHub, HubSpot, DoorDash) and their current investors (Casa Verde, Gron Ventures, Thirty5 Ventures, Sinai, and DoorDash founding team members). This 'social proof' is incredibly dense, packing years of industry experience into a single slide.
What Works in This Deck
1. The 'Winner-Takes-All' Narrative: By focusing so heavily on market share (10% of global, 25% of all dispensaries), Dutchie makes it feel like the race is already over. For a Series B investor, this reduces the perceived risk of a competitor overtaking them.
2. Clarity of Metrics: The deck doesn't hide behind vanity metrics. It focuses on GMV, dispensary count, and geographic reach. These are the three most important levers for a marketplace/SaaS hybrid in this space.
3. Timing and Context: Slide 5’s mention of COVID-19 is a masterclass in turning a macro event into a micro advantage. They didn't just show a spike in sales; they explained why that spike represented a permanent shift in the market.
4. Founder-Market Fit: The connection between the CEO’s experience in food delivery (GrubCanada) and the current business (cannabis delivery/ordering) is seamless. It suggests that the 'playbook' for Dutchie is just an evolution of a proven model.
What Is Missing
1. The Financial Ask: There is no slide stating how much money is being raised or what the valuation expectations are. While this is common in decks that are leaked or used for initial intros, a complete fundraising deck usually includes an 'Ask' slide.
2. Unit Economics: For a Series B, investors usually want to see LTV (Lifetime Value), CAC (Customer Acquisition Cost), and churn rates. Dutchie provides none of this. They rely entirely on top-line growth to tell the story.
3. Competitive Landscape: The deck acts as if Dutchie has no competitors. In 2020, companies like Weedmaps and Leafly were also vying for the digital storefront. Omitting a competitive matrix is a confident move, but it leaves a gap in the strategic narrative.
4. Business Model: The deck never explains how Dutchie makes money. Do they charge a monthly SaaS fee? A transaction fee per order? A percentage of GMV? This is a significant omission for a Series B deck, though it was likely covered in the subsequent pitch meetings.
What a Founder Should Copy
1. The 'Big Number' Start: If you have a metric that proves you are winning the market, don't bury it on slide 12. Put it on the cover or slide 1. It changes the psychology of the investor from 'Should I invest?' to 'How do I get into this?'
2. Visualizing Market Share: The way Dutchie broke down TAM/SAM/SOM on Slide 3 is excellent. Specifically, defining the SOM as the 'online' portion of the market makes their 33% share look much more dominant than if they had only compared themselves to the total global market.
3. The Team Breakdown Chart: Instead of just listing names, showing the headcount by department (Slide 8) gives investors a clear picture of how the company is built. It shows that the company is prioritizing engineering and support, which are the engines of a scalable SaaS product.
4. Minimalist Design: The deck uses a consistent color palette (green and blue) and very little text. Each slide has one clear job. Founders often try to cram too much information into a deck; Dutchie proves that if your growth is strong enough, you can let the charts do the talking.
Conclusion
The Dutchie Series B deck is a high-conviction document. It assumes the reader already understands that cannabis is a growth industry and focuses entirely on proving that Dutchie is the dominant platform within that industry. While it lacks the granular financial detail typically seen at this stage, its success lies in its ability to communicate massive scale and momentum in under ten slides. It is a reminder that in fundraising, sometimes less is more—provided your 'less' includes a $2.3 billion growth curve.
Frequently asked questions
- Why is the Dutchie deck so short at only 9 slides?
- At the Series B stage, especially for a company with Dutchie's growth profile in 2020, the 'traction' speaks for itself. The deck is designed to validate a 'land grab' strategy. When a company can show they have captured 25% of all dispensaries in North America (Slide 4) and are processing $2.3B in GMV (Slide 5), they don't need to explain the basics of the business model. The brevity suggests a high-demand round where the founders are providing a summary of dominance rather than a defensive argument for their existence.
- How does Dutchie calculate its market share in this deck?
- Dutchie uses a three-tier market analysis on Slide 3. They cite a Total Addressable Market (TAM) of $21.5B for global retail cannabis, a Serviceable Addressable Market (SAM) of $19.8B for North American retail, and a Serviceable Obtainable Market (SOM) of $6.9B. The SOM is specifically defined as the 35% of cannabis retail sales that occur online. By claiming 33% of that SOM, they position themselves as the primary gateway for digital cannabis commerce.
- What role did the COVID-19 pandemic play in their fundraising narrative?
- Slide 5 explicitly calls out the 'COVID Pandemic - March 2020' as a catalyst. It notes that the world transitioned to an online-only model, forcing a shift in consumer behavior. By framing this shift as 'longlasting' according to experts, Dutchie turned a temporary global crisis into a permanent tailwind for their digital ordering platform, justifying the exponential GMV curve shown on the same slide.
- What is missing from the Dutchie Series B deck?
- The deck is missing several 'standard' slides: there is no formal 'Ask' (how much they are raising), no 'Use of Funds,' no 'Competition' analysis, and no 'Business Model' slide explaining their take rate or SaaS fees. It also lacks detailed unit economics like CAC or LTV. In a Series B, these are usually expected, but Dutchie likely relied on a separate data room for these details, using the deck only as a high-level vision and traction summary.
- How does the team slide contribute to the deck's credibility?
- Slide 8 focuses on 'The Playbook.' Instead of just listing titles, it highlights that CEO Ross Lipson co-founded GrubCanada (acquired by JustEat) and CPO Zach Lipson co-founded a fintech platform acquired by RetireUp. By listing 'Core team members' from GrubHub, HubSpot, and DoorDash, they signal that they are applying proven food-delivery and SaaS scaling tactics to the nascent cannabis industry, reducing perceived execution risk.