LovEarth's 13-slide seed deck, built in Google Slides and dated 26 June 2017, pitches an e-commerce superstore sharing 33% of profit with a charity the shopper picks, with charities acting as the acquisition channel in return. Structurally it is one of the more complete decks in this series — problem, solution, model, market, competition, financials, team, use of funds and milestones are all present, the assumption set is disclosed, and slide 8 fairly converts the 33%-of-profit claim into 8.3%-16.6% of purchase price to compare like-for-like against AmazonSmile's 0.5%. Its failure is arithmet…
Key takeaways
- LovEarth's 13-slide June 2017 seed deck pitches an e-commerce superstore that shares 33% of profit with a charity the shopper chooses, with the charity acting as the acquisition channel in return — summarised on slide 3 as 'Imagine AmazonSmile on Steroids.'
- The business-model math on slide 5 is correct to the dollar — $2.4M revenue, 35% margin, less $96,000 shipping and $72,000 card fees, leaving a $672,000 pool split 67/33 — but the slide never shows the $672,000, so the printed figures read as a 49.3% share rather than 33%.
- The three-year table repeats the error structurally: the column labelled 'Gross Profits' is actually gross profit after the donation, making the charity share read as 49.25% of gross profit in all three years instead of 33%.
- The deck uses three different gross-margin figures without reconciling them: 35% on slide 5, an implied 25%–50% band on slide 8, and 27.2% implied by slide 10's model.
- Net income in the three-year table cannot be derived from the four columns printed above it in any year, with unexplained gaps of roughly $18,000, $1.41 million and $4.19 million as revenue scales.
- Slide 8 is the strongest page: it converts LovEarth's 33% of profit into 8.3%-16.6% of purchase price so it can be compared like-for-like with AmazonSmile's 0.5%, producing $198-$396 to charity versus $12 on identical $2,400 spend — and it sits at slide 8 of 13.
- Market size is calculated on the wrong denominator: $2.16 trillion of 2012 US charity revenue, five years stale in a 2017 deck, when the addressable figure is supporter grocery spend.
- There is no ask slide, no valuation and no traction six weeks after the site went live: marketing is 6.3% of the $1.5M raise while 38% sits in an undefined 'cash reserve for expansion', and slide 9 introduces an unfunded Ethereum cryptocurrency called ECOS COIN.
What this deck actually is
Thirteen slides, widescreen at 669 x 405 points, built in Google Slides and printed to PDF through Mac OS X Quartz on 26 June 2017 . The file is 9.6 MB and was uploaded to a document-sharing platform that August. It is a genuine seed-stage investor deck for LovEarth Inc. (spelled with one "e" in the logo, frequently searched as LoveEarth), an e-commerce superstore that shares a third of its profit with a charity the shopper chooses.
It has the full skeleton: problem, solution, traction proxy, business model, market size, competition, differentiation against the incumbent, a roadmap item, three-year financials, team, use of funds and milestones. That alone puts it ahead of most decks in this series — nothing structural is missing, and the sequence is close to canonical.
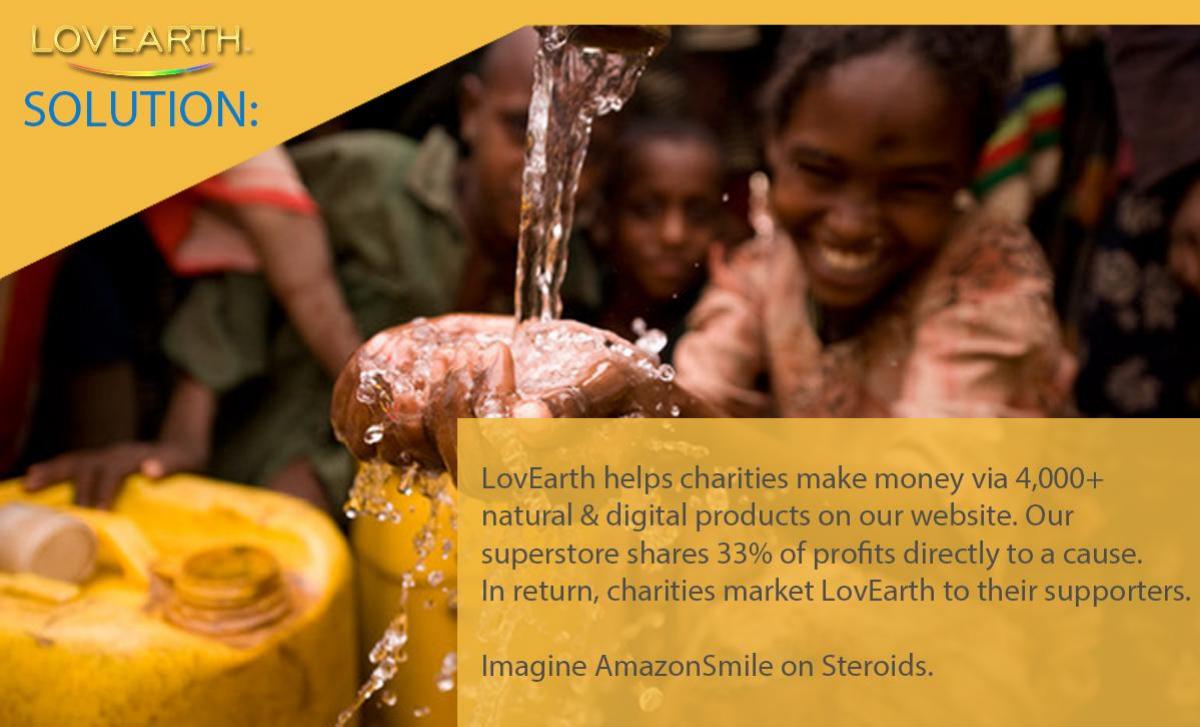
The proposition is legible in one line, which is rare: "LovEarth helps charities make money via 4,000+ natural & digital products on our website. Our superstore shares 33% of profits directly to a cause. In return, charities market LovEarth to their supporters." Then the deck adds the sentence that does more work than the other twelve slides combined: "Imagine AmazonSmile on Steroids."
So the failure here is not structure and not clarity. It is arithmetic. This deck's central promise is a percentage, and the percentage does not survive contact with the deck's own numbers — not on the business-model slide, and not in the three-year model. Everything else about the file is a competent seed deck built around a number that an investor will disprove with a calculator in under two minutes.
The 33% does not reconcile with the numbers printed beside it
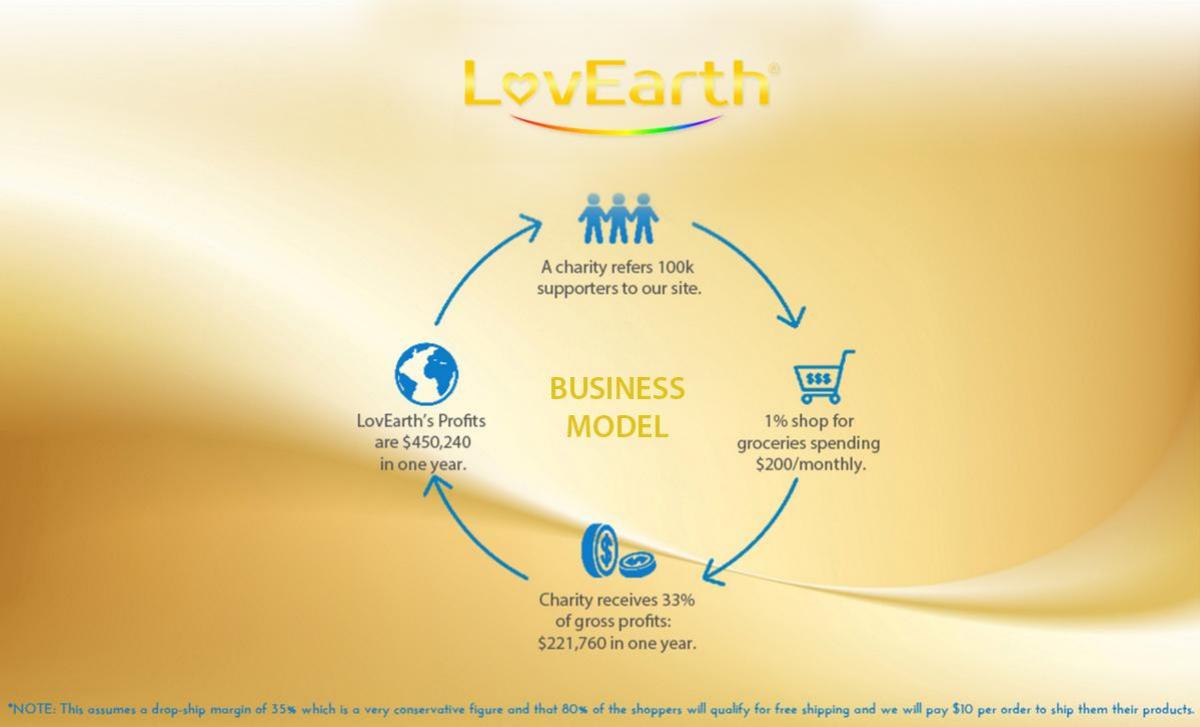
Slide 5 is a circular business-model diagram, and it is the deck's load-bearing page. Read clockwise:
A charity refers 100,000 supporters to the site. · 1% shop for groceries, spending $200 monthly. · Charity receives 33% of gross profits: $221,760 in one year. · LovEarth's profits are $450,240 in one year.
Work it through. 1,000 shoppers at $200 a month is $2,400,000 of annual revenue. The footnote assumes a 35% drop-ship margin, so gross profit is $840,000 . The same footnote says 80% of shoppers get free shipping at $10 an order: 12,000 orders, 9,600 shipped free, $96,000 . Subtract a 3% card-processing fee — $72,000 — and you land on $672,000 exactly. Split 67/33 and you get $450,240 to LovEarth and $221,760 to the charity, to the dollar.
The math is right. That deserves saying plainly, because it is unusual: someone built a real model behind this slide and the outputs tie out perfectly. But two things make it fail anyway.
First, the 3% processing fee that closes the gap is disclosed nowhere on slide 5 — it appears only in eight-point type at the bottom of slide 10, five slides later. A reader checking the slide as printed computes $840,000 minus $96,000 and gets $744,000, missing the stated pool by $72,000, and concludes the model is wrong.
Second and worse: the diagram never shows the $672,000 pool. The only profit figure on the slide is $450,240, and it sits immediately upstream of the arrow labelled "33% of gross profits." A reader doing the obvious thing — taking 33% of the only profit number on the page — gets $148,579 , not $221,760. The two figures shown are in a 67/33 relationship with a pool that was left off the slide, so the charity's share reads as 49.3% of LovEarth's stated profit .
You cannot print a headline percentage and then print two numbers next to it that appear to contradict it. Correct math communicated wrongly is indistinguishable, at reading speed, from wrong math.
The same mislabel is baked into the three-year model
Slide 10's table is the deck's most diligenced page, and the error propagates into it. The columns are Revenue, Gross Profits, Expenses, $ to Charities, Net Income:
Year 1: $7,504,049 revenue, $1,366,462 gross profits, $1,959,100 expenses, $673,034 to charities, $(611,085) net income · Year 2: $36,089,123 revenue, $6,571,708 gross profits, $2,952,800 expenses, $3,236,811 to charities, $2,208,461 net income · Year 3: $71,348,610 revenue, $12,992,342 gross profits, $3,466,900 expenses, $6,399,213 to charities, $5,336,111 net income
Run the ratio of charity share to gross profits: 49.25% in all three years. Identical to slide 5. The reason is the same — the column labelled "Gross Profits" is actually gross profit after the donation has already been removed. Add the two back together and the charity share is exactly 33.0% of the real pool in every year. The model is right; the column heading is wrong; and the wrong column heading appears on the one page an investor will screenshot into their notes.
That mislabel also destroys the margin story. As printed, gross margin reads 18.2% of revenue. Reconstruct the true pool and it is 27.2% . Neither is the 35% asserted on slide 5, and neither is the 25%–50% band implied by slide 8. Four slides, three different gross-margin assumptions, none cross-referenced.
Then there is the net income column, which does not reconcile under any reading. Take the true gross pool, subtract expenses, subtract the charity share: Year 1 gives $(592,638) against a stated $(611,085); Year 2 gives $3,618,908 against a stated $2,208,461; Year 3 gives $9,525,442 against a stated $5,336,111. The gaps — roughly $18k, $1.41M and $4.19M — grow with revenue and follow no visible rule. Something real is presumably being deducted, but the deck does not name it, so the bottom line is not derivable from the four columns above it. (The totals row, to its credit, adds up correctly in all five columns.)
One more thing the model asserts without support: revenue grows 9.5x from Year 1 to Year 3 while total expenses grow 1.77x , from $1.96M to $3.47M. A $71 million e-commerce business operated on $3.5 million of annual opex is the single least believable number in the file, and it is never defended.
The AmazonSmile comparison is the best slide in the deck
Slide 8 does something most decks get wrong. Rather than compare its own generous-sounding "33% of profit" against AmazonSmile's "0.5% of purchase price" — two different denominators, which would be a rigged comparison — it converts its own number into Amazon's unit. A shopper spending $200 a month for a year spends $2,400. Through AmazonSmile the charity receives $12 . Through LovEarth it receives $198 to $396 , because 33% of profit works out to 8.3%–16.6% of purchase price.
That is honest framing, a 16x to 33x differential, a linked source for the Amazon figure, and it makes the argument in one table. It is the page that should be doing the most work in the deck.
It sits at slide 8 of 13, after the market-size slide and the competition slide. The comparison against the only incumbent anyone will name in the meeting belongs at slide 3, immediately after the solution. And the implied margin band it uses — 25% to 50% — quietly contradicts the 35% used on slide 5 and the 27.2% implied by slide 10, which is precisely the kind of loose thread that turns a strong slide into a cross-examination.
Slide-by-slide walkthrough
Slide 1 — Website screenshot, used as the cover
A full-bleed screenshot of LovEarth.com: search bar, "33% of Profit to a Charity of your choice", "Free Shipping on orders over…", "The charity you are supporting will receive approx $3.17", and category tiles including LoveFlix, eCourses and Movies. There is no cover slide — no company name set as a title, no tagline, no date, no contact, no "Series Seed" marker. Leading with a live product is a strong instinct; doing it instead of a cover means the deck has no identity when it is forwarded as an attachment.
Slide 2 — Problem
"1.5 Million charities need a sustainable way to help fund their missions." One sentence, full bleed. It is the right problem, stated at the right length — and the 1.5 million figure carries no source, on a slide where a single citation would have cost nothing.
Slide 3 — Solution
The 4,000+ products, the 33% profit share, the reciprocal deal ("in return, charities market LovEarth to their supporters"), and "Imagine AmazonSmile on Steroids." The reciprocity is the actual insight here: the charity is simultaneously the beneficiary and the acquisition channel, which is a real answer to how a new marketplace acquires customers without an Amazon-scale budget. The deck states it once and never returns to it.
Slide 4 — 14,000,000+ supporters
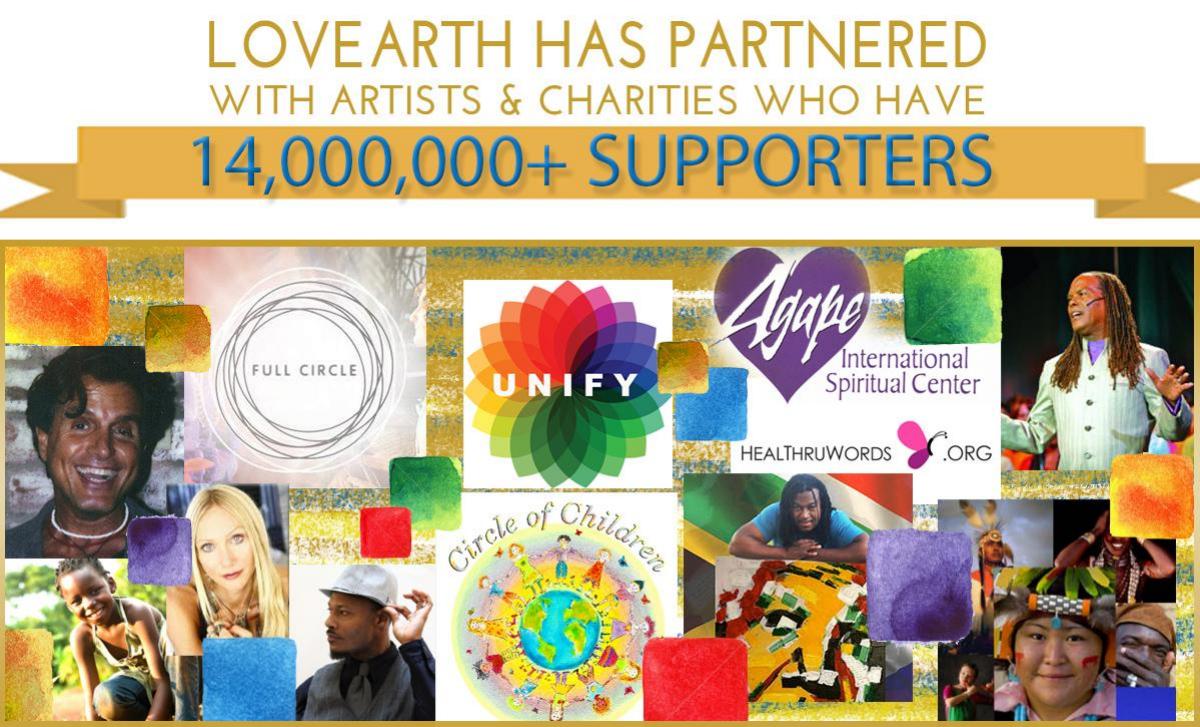
A logo wall of partner charities — Agape International Spiritual Center, HealthRuWords and others — under a headline claiming 14 million-plus supporters. This is the traction slide, and it is doing something the milestones slide contradicts: slide 13 says LovEarth has " begun to sign key charities." Begun-to-sign and 14 million supporters are not the same claim. Missing: how many charities are contracted, how many are in conversation, how the 14 million is counted, and whether a single one has yet referred a customer.
Slide 5 — Business model
The circular diagram analysed above. Right math, wrong presentation, one undisclosed assumption. Also note it assumes $200 per shopper per month, while slide 10 assumes an AOV of $77.90 at 2.13 orders a month, or $165.93 — a 17% difference between the two spend assumptions in the same deck.
Slide 6 — Market size
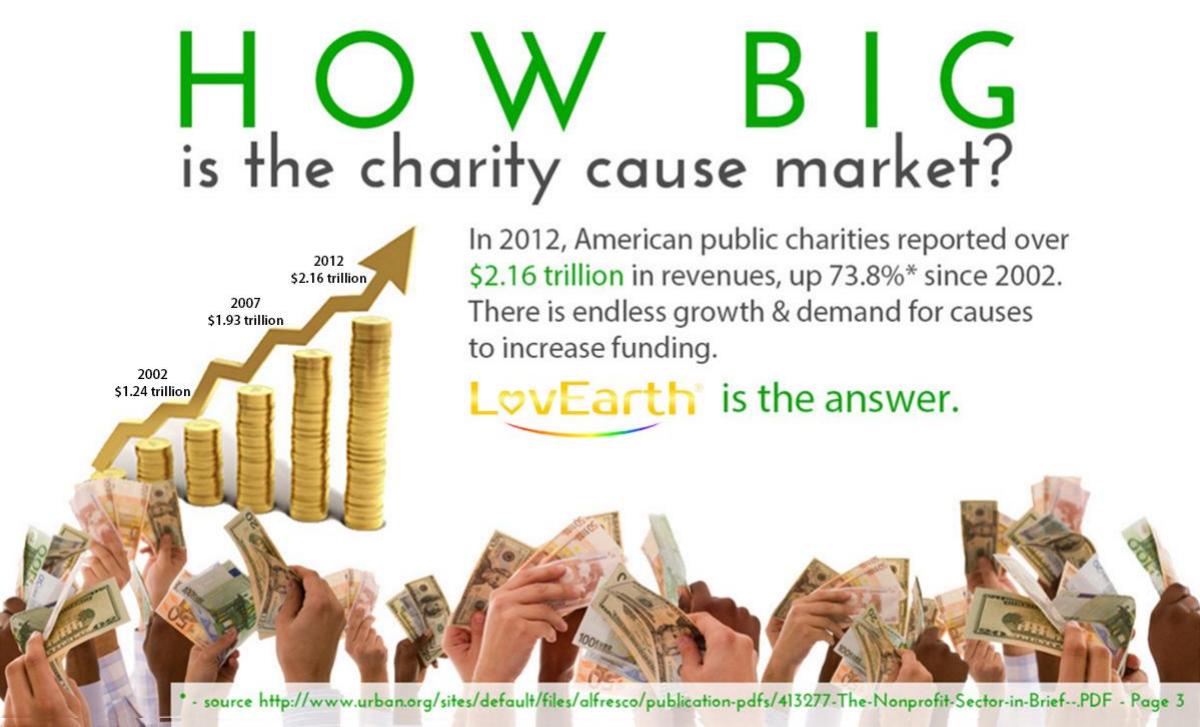
"In 2012, American public charities reported over $2.16 trillion in revenues, up 73.8% since 2002", with a 2007 comparison of $1.93 trillion and a linked Urban Institute source. The citation is genuine and specific, which is more than most decks manage. The problem is definitional: charity revenue is not LovEarth's market. LovEarth does not sell to charities, it sells groceries to their supporters and shares margin. The addressable number is US online grocery and natural-products spend among those supporters — a real figure, orders of magnitude smaller, and far more persuasive because it is defensible. Using 2012 data in a June 2017 deck adds a five-year staleness problem on top.
Slide 7 — Competition
A 2x2 with "Give Back" on the vertical axis and "Savings" on the horizontal, placing LovEarth alone in the top-right and AmazonSmile, Thrive Market and Jet clustered along the bottom. Named competitors is good; a 2x2 that puts you alone in the winning quadrant is the oldest self-serving chart in venture, and this one places LovEarth to the right of Amazon on savings with no price comparison anywhere in the file. The supporting line — low inventory and operating costs via a UNFI drop-ship partnership — is the strongest competitive fact on the page and it is set in small type beneath the chart. The source cited for "7.2% of total retail sales" is a 2015 article, again used in 2017.
Slide 8 — AmazonSmile comparison
Covered above: $12 versus $198–$396 on the same $2,400 of spend, with the Amazon terms linked. The best-argued page in the deck, positioned sixth.
Slide 9 — ECOS COIN
"In phase 2/3 we are planning our own cryptocurrency called 'ECOS COIN'", to sit alongside Visa and PayPal at checkout, built on Ethereum, "also open to the public for purchase." June 2017 was the peak of the ICO wave, so the instinct is of its time. In deck terms it is a liability: it is unfunded (no line for it in the use of funds), unscoped, and it introduces securities exposure that the deck never addresses — despite the next slide listing a Gunderson Dettmer securities lawyer among the team. A pre-revenue marketplace adding a token to slide 9 tells an investor that focus is negotiable.
Slide 10 — Financial projections
A 3-D bar chart plus the three-year table analysed above, with the assumptions footnoted: 35% product margin, $77.90 AOV, 2.13 purchases a month, 80% hitting free shipping at $10, 3% card fees. Disclosing the assumption set at all is genuinely good practice. The chart is 3-D, which distorts every bar it draws, and the "Gross Profits" column is mislabelled.
Slide 11 — Team
Six people, densely written. CEO Martin Dunkerton, RCA-trained, gold-award-winning and Royal Television Society-nominated BBC director and international producer. COO Dave Zielski, BSEE, principal software engineer at Lucent and NEC, co-founded and sold Seaside Naturals in 2008. President Stephen Huntsman, ventures including Selina Naturally, X-Prize and ESPN X-Games. Plus a securities attorney, a CPA and a film producer attached to a 2017/18 TV project.
Real careers, and the natural-products exit is directly relevant. But six of six bios are unusually long, the founder's experience is film and television rather than e-commerce, the technical lead is described as having been "gathered" as a tech team rather than named, and an outside attorney and an outside accountant are presented inside the team grid — which reads as padding to anyone who has raised before. A deck projecting $71 million of online grocery revenue has no named head of growth and no e-commerce operator.
Slide 12 — Use of funds
$1,500,000 total: capital expenditure $102,000; salaries $290,000; marketing $95,000; legal and financial $60,000; office operations $138,000; working capital $250,000; cash reserve for expansion $565,000. The columns sum correctly.
The allocation is the argument, and it undercuts the plan. Marketing is $95,000 — 6.3% of the raise — in a business whose Year 1 target is $7.5 million of revenue. The stated answer is that charities do the marketing, but that only works if the charity relationships are contracted, and slide 13 says they have merely "begun." Meanwhile $565,000, or 38% of the round, is an undefined "cash reserve for expansion" — the largest single line item is money with no job. And nowhere in thirteen slides is there an ask slide: no valuation, no instrument, no equity offered, no round structure, no close date.
Slide 13 — Milestones
Phase 1 (accomplished): site built with a tech team, UNFI deal signed, 4,000+ organic non-GMO products integrated, begun signing key charities and key artists/authors/producers. Phase 2 (current): live for beta testing, superstore shopping launched, ECOS COIN in initial development.
The UNFI supply deal is the hardest asset in the file and it is a bullet on the last slide. Nothing carries a date or a number — not one order, not one dollar of beta GMV, not one conversion rate, in a deck written six weeks after the site went live for sales. And the deck ends here: there is no Phase 3 , despite slide 9 referring to "phase 2/3", and no closing slide, no contact details and no next step.
What this deck does better than most startup pitch decks
The proposition is unmistakable by slide 3. Charities market us, we share a third of profit with them, here are 4,000 products. Most decks take eight slides to be this clear. · It converts its own metric into the incumbent's unit. Slide 8 restates "33% of profit" as 8.3%–16.6% of purchase price so it can be compared directly with AmazonSmile's 0.5%. That is intellectually honest and it makes the differential land. · It discloses its assumption set. Margin, AOV, purchase frequency, free-shipping rate, shipping cost and card fees are all printed under the model. Most seed decks show projections with no assumptions at all. · The model actually ties out. Slide 5's four figures reconcile to the dollar once the disclosed fees are applied. Somebody built a real spreadsheet. · It names a hard supply-side asset. The UNFI drop-ship partnership is a specific, verifiable, capital-light advantage — the kind of fact investors can check. · It names its competitors by brand. Amazon, Jet and Thrive Market, rather than "legacy players." · It cites external sources with links. Urban Institute for market data, Amazon's own terms page for the 0.5% figure.
Where this deck would fail in an investor meeting
No ask. Thirteen slides, a $1.5M use-of-funds table, and no valuation, instrument, round size, equity offered or close date. · The headline percentage appears contradicted by the numbers beside it. 33% of the profit figure shown on slide 5 is $148,579; the slide claims $221,760. · Three different gross margins across slides 5, 8 and 10 (35%, 25–50%, 27.2% implied), never reconciled. · A mislabelled column in the three-year table makes the donation read as 49.3% of gross profit rather than 33%. · Net income is not derivable from the four columns printed above it, in any of the three years. · Expenses grow 1.77x while revenue grows 9.5x — a $71M e-commerce operation on $3.47M of annual opex, undefended. · The market-size slide sizes the wrong market — charity revenue, not supporter grocery spend — using five-year-old data. · No traction whatsoever six weeks after going live: no orders, no GMV, no conversion rate, no repeat rate, no signed-charity count. · Marketing is 6.3% of the raise while 38% sits in an undefined expansion reserve. · An unfunded cryptocurrency on slide 9 of a pre-revenue grocery marketplace. · Advisors presented as team , and no named technical or growth lead. · No risks slide, no CAC, no cohort or retention assumption , and no contact details anywhere in the file.
What the deck claims vs what an investor can verify
Claim in the deck Where it appears What a reader can actually check
Charity gets 33% of profit Slides 1, 3, 5 The two figures on slide 5 sit in a 67/33 split of a pool the slide never shows; as printed the share reads as 49.3% 35% product margin Slide 5 footnote Slide 10 implies 27.2%; slide 8 implies 25–50% $2.16 trillion market Slide 6 US charity revenue in 2012 — not spend LovEarth can capture, and five years stale
Best on savings vs Amazon Slide 7 No price comparison anywhere in the deck 14,000,000+ supporters Slide 4 Slide 13 says charity signings have only "begun"; no contracted count given $71.3M revenue in Year 3 Slide 10 Requires $3.47M of total opex and a marketing budget of $95k in Year 1
UNFI drop-ship partnership Slides 7, 13 Specific, named and verifiable — the strongest claim in the deck
How you would rebuild this deck
Fix the slide-5 diagram first. Show the gross-profit pool ($672,000), then split it 67/33 into two labelled boxes. Move the 3% processing fee into the same footnote as the shipping assumption. Same math, zero ambiguity. · Relabel the financial table. "Gross Profit" must mean gross profit. Add a "Charity Share (33% of GP)" line beneath it and a reconciling line for whatever currently makes net income differ from the columns shown. An investor who cannot reproduce your bottom line stops reading the model. · Pick one gross margin and use it everywhere. If it is 27.2% after shipping and fees, say 27.2% on every slide and show the bridge from 35% once. · Move the AmazonSmile table to slide 3. $12 versus $198–$396 on identical spend is the whole pitch. It should be the second thing the reader sees. · Resize the market honestly. Supporters reachable through signed charities, multiplied by realistic online grocery spend, times a defended conversion rate. A credible $400M is worth more than an incredible $2.16 trillion. · Replace the 14 million headline with a contract count. "N charities signed, M in pipeline, X supporters reachable under executed agreements, first referral cohort converted at Y%." One real cohort beats eight logos. · Put beta data on the traction slide. Orders, AOV, repeat rate and referral conversion since May 2017 — even if the numbers are small. Small real numbers validate the model; no numbers invalidate it. · Defend the opex curve or change it. Show headcount, fulfilment and marketing scaling with revenue toward Year 3, or drop the Year 3 figure to something the cost base supports. · Cut ECOS COIN. Move it to an appendix. It is unfunded, unscoped, and it converts a focused commerce story into a 2017 token story. · Rebalance the use of funds. Marketing at 6.3% and an undefined reserve at 38% is backwards. Name what the reserve buys, or move it into channel spend and defend it with a CAC estimate. · Add an ask slide and a cover. Amount, instrument, valuation, use of proceeds, close date, contact details, date on the file.
The transferable lesson
LovEarth's deck fails on the one axis nobody expects to fail on: it is too honest to survive its own presentation . The model behind slide 5 is real and correct. The assumptions are disclosed. The comparison against Amazon is fair. And none of that matters, because the slide shows a $450,240 profit figure directly above a "33%" arrow pointing at $221,760, and a reader with a phone calculator concludes in ninety seconds that the founder cannot do percentages.
That is the lesson worth taking to your own deck. An investor does not audit your spreadsheet; they spot-check your slide. Every number you print is an invitation to a two-minute test, and the only numbers that survive are the ones whose inputs are visible on the same page. If your headline percentage requires the reader to know a pool you did not show, using a fee you disclosed five slides later, your correct model will be scored as a wrong one — and you will never find out why, because nobody tells you they stopped believing you on slide 5.
The second lesson is about labels. A column heading that says "Gross Profits" when it means gross profit net of donations is a thirty-second fix that, left in place, makes your headline promise look like it is being overstated by 50%. Nothing in fundraising is more expensive than a word that is almost right.
And the third: when your traction slide claims fourteen million supporters and your milestones slide says you have "begun to sign" charities, the reader believes the smaller claim and discounts the larger one — plus everything else on the slide it appeared on. Consistency is not a stylistic preference. It is the mechanism by which each of your claims either supports or destroys the next.
Frequently asked questions
- Is the LovEarth deck a real investor pitch deck?
- Yes. The 13-slide file, built in Google Slides and dated 26 June 2017, is a seed-stage investor deck for LovEarth Inc. It has the full canonical structure — problem, solution, traction, business model, market size, competition, financial projections, team, use of funds and milestones — and a $1.5 million use-of-funds table. What it lacks is an ask slide stating valuation, instrument or round terms.
- What is LovEarth (LoveEarth)?
- LovEarth Inc. was a US e-commerce superstore, live for beta in May 2017, selling 4,000+ organic and non-GMO grocery products through a UNFI drop-ship partnership plus digital goods such as courses and film. Its model shared 33% of profit with a charity chosen by the shopper, and in return charities promoted LovEarth to their supporter bases. The deck also proposed an Ethereum token called ECOS COIN.
- Which LovEarth slides should founders copy?
- Two. Slide 8, which restates LovEarth's 33%-of-profit as 8.3%-16.6% of purchase price so it can be compared directly against AmazonSmile's 0.5% — honest unit conversion instead of a rigged comparison. And the assumption footnote under slide 10, which prints margin, average order value, purchase frequency, free-shipping rate and card fees, letting a reader rebuild the model.
- What is the biggest weakness in the LovEarth deck?
- Presentation of correct math. Slide 5 shows a $450,240 profit figure directly above an arrow labelled '33% of gross profits' pointing at $221,760 — but 33% of $450,240 is $148,579. The numbers reconcile perfectly against a $672,000 pool the slide never displays, so a reader with a calculator concludes the founder cannot do percentages. The same mislabel repeats in the three-year table.
- How many slides is the LovEarth pitch deck?
- Thirteen slides, widescreen at 669 x 405 points, produced in Google Slides and printed to PDF via Mac OS X Quartz on 26 June 2017, then shared publicly that August. The file is 9.6 MB. There is no cover slide — slide 1 is a screenshot of the LovEarth.com homepage — and no closing slide, contact details or Phase 3 on the milestones page.
- How did LovEarth compare itself to AmazonSmile?
- On $2,400 of annual spend, AmazonSmile donates 0.5% of purchase price, or $12. LovEarth calculated its 33% profit share as 8.3%-16.6% of purchase price, or $198 to $396 — a 16x to 33x differential, with Amazon's own terms page cited as the source. It is the deck's best-argued comparison, though the implied 25%-50% margin band contradicts the 35% used elsewhere.