DoggyHut is not a real company. Its 13-slide 'Deck for Series A Round' was published in March 2018 by Iskender Dirik of Microsoft ScaleUp Berlin as a teaching example, complete with a footnote reading 'Source numbers (fake)' and a CTO named Elon Muscle. The structure - purpose, problem, market build-up, why now, 12% take rate, roadmap grid - is genuinely worth copying, but the deck has no ask slide, no product screenshot, no named competitors and one growth annotation that does not survive a calculator.
Key takeaways
- The DoggyHut pitch deck is a fictional sample Series A deck published in March 2018 by Iskender Dirik, then Managing Director at Microsoft ScaleUp Berlin, not a deck from a real company that raised money.
- The deck openly labels its own market data as invented: the market slide footnote reads 'Source numbers (fake): www.unicornunited.com/dog_world_statistics'.
- DoggyHut's team slide lists fictional founders including 'Elon Muscle, CTO' educated at 'Stanaudi', with a claimed prior marketplace exit of $1.1bn after three years.
- The revenue model is a single 12% take rate split into a 2% traveller transaction fee and a 10% host commission, and every GMV-to-revenue pair elsewhere in the deck reconciles to it.
- The roadmap slide fuses traction and plan on one axis across four funding stages with a 'NOW' marker and a headcount breakdown by function, which doubles as the hiring plan the round buys.
- The Series B growth annotation is wrong: 14% month-on-month compounding over 24 months produces more than 23x, not the '400% Growth' the slide claims.
- In 13 slides DoggyHut never shows a product screenshot and never names a single competitor inside its own competition 2x2, despite naming Airbnb and Booking.com on the problem slide.
- There is no ask slide: the $2m Series A figure appears only as a cell inside the roadmap table, and the deck closes on the author's contact details instead.
What this deck actually is
Before anything else, this deck needs a warning label, because it is not what most people assume when they download it.
DoggyHut is not a real company. The 13-slide deck labelled "Deck for Series A Round." is a teaching artefact — a fully worked, deliberately fictional Series A deck published in March 2018 by Iskender Dirik, then Managing Director at Microsoft ScaleUp Berlin (Microsoft for Startups), as the companion to a blog article about how to build a Series A deck. The closing slide says so explicitly: "This pitch deck and the related blog article are presented by: Iskender Dirik, MD at Microsoft ScaleUp / Microsoft for Startups Berlin."
The deck does not hide it. The market slide footnote reads "Source numbers (fake): www.unicornunited.com/dogworldstatistics". The team slide lists "Elon Muscle, CTO" educated at "Stanaudi", who worked at "Coogle", alongside a CEO from "Harvhard" who worked at "Macrosoft" and a CMO from "Racket Internet". Every number in the roadmap is invented. Every founder is a joke name.
So why tear it down at all? Because it is one of the most downloaded "pitch deck examples" on the internet, and thousands of founders have copied its structure without noticing that they are copying a model answer rather than a deck that actually raised money. A model answer is useful — but only if you can see which parts are genuinely instructive and which parts are only plausible because the author got to invent the underlying business. That distinction is the whole point of this teardown.
Read this deck the way you would read a worked example in a textbook: study the sequence, steal the slide logic, and then be brutally honest that your own numbers will not line up as neatly as a fictional marketplace's do.
Slide-by-slide walkthrough
Slide 1 — Cover
A flat yellow field, a black paw-print mark, the wordmark "Doggy Hut" in a rounded serif, and one line bottom-right: "Deck for Series A Round." Nothing else. No date, no company legal name, no contact detail, no confidentiality line.
The one thing this cover does well is state the round. An investor opening the file knows in half a second what conversation they are being invited into. That is a real, copyable habit: put the round on the cover so the reader calibrates every subsequent number against the right expectation.
What it omits is what a real cover needs — the month and year (so the numbers can be dated), and a legal entity. Because this is a sample deck those omissions are harmless. On your deck they are not: an undated deck that circulates for six months gets read as if its traction is current.
Slide 2 — Company Purpose
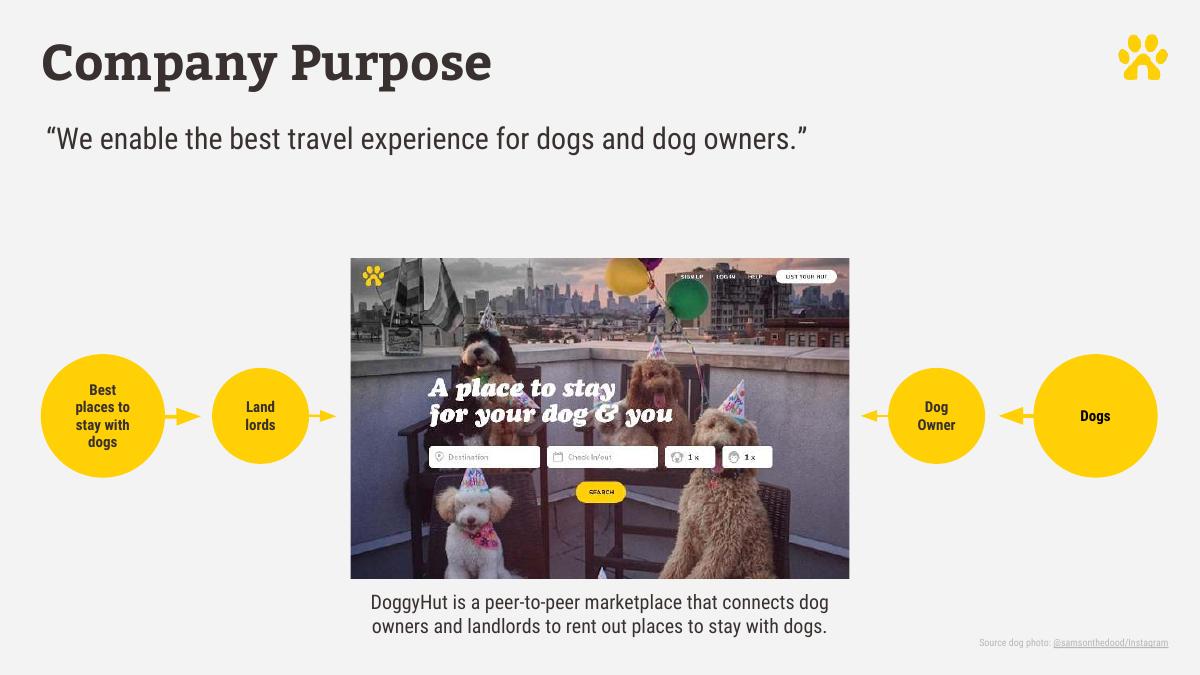
A single sentence in quotation marks: "We enable the best travel experience for dogs and dog owners." Beneath it, a three-node diagram — "Best places to stay with dogs", "Land lords", "Dog Owner"/"Dogs" — and one explanatory line: "DoggyHut is a peer-to-peer marketplace that connects dog owners and landlords to rent out places to stay with dogs."
This is the strongest slide in the deck and the one most worth copying. It separates two things founders routinely fuse: the purpose (the emotional, durable statement) and the mechanics (peer-to-peer marketplace, two named sides, one transaction). An investor can repeat both back after one read, which is the actual test a company purpose slide has to pass — because the person who has to sell you internally on Monday will only remember one sentence.
Note the discipline of naming both sides of the marketplace explicitly. "Dog owners and landlords" tells the reader immediately that this is a two-sided liquidity problem, which frames every later slide about host acquisition.
Slide 3 — Problem
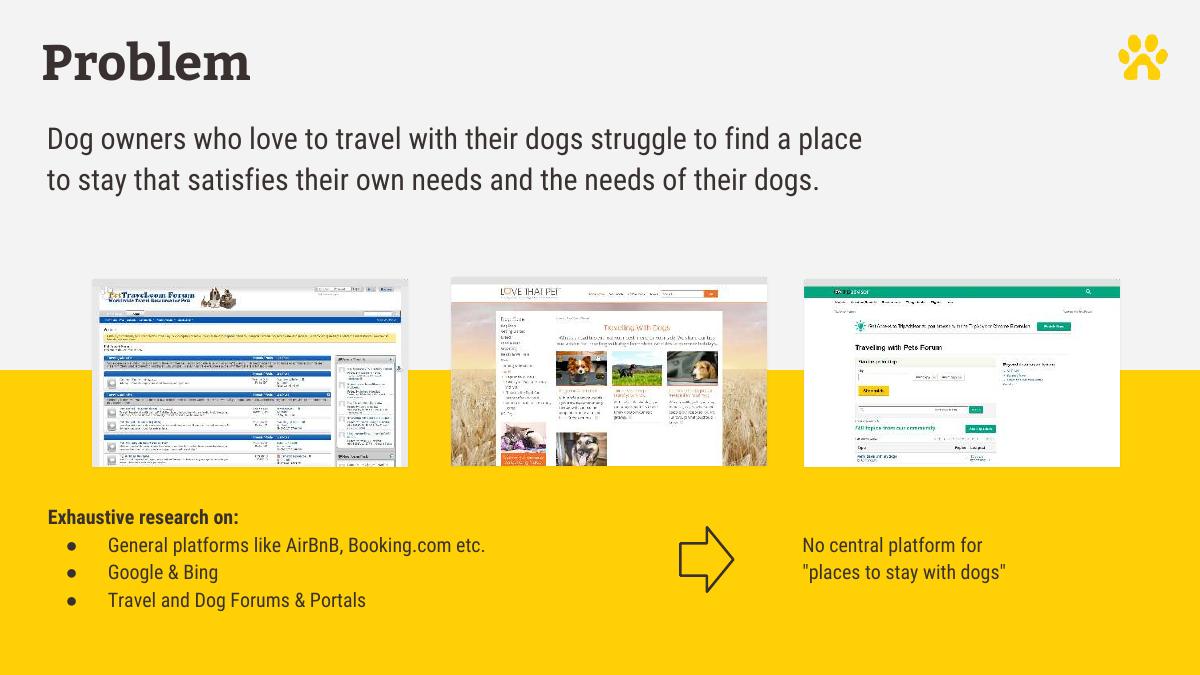
"Dog owners who love to travel with their dogs struggle to find a place to stay that satisfies their own needs and the needs of their dogs." Below it, a small block headed "Exhaustive research on:" listing general platforms like Airbnb and Booking.com, Google and Bing, and travel and dog forums and portals — concluding "No central platform for 'places to stay with dogs'".
What makes this slide work is that it does not merely assert a gap; it shows the search that was run to find the gap. "We looked at the general platforms, the search engines and the vertical forums, and there is no central platform" is an argument with a method attached. Most problem slides are an adjective ("frustrating", "broken") and a stock photo.
What is missing — and would be non-negotiable in a real deck — is any evidence from the customer. There is no quote, no survey n, no count of forum threads, no screenshot of a dog owner asking the question in public. The slide proves the absence of a competitor; it does not prove the presence of demand. Those are different claims, and only the second one makes a business.
Slide 4 — Solution
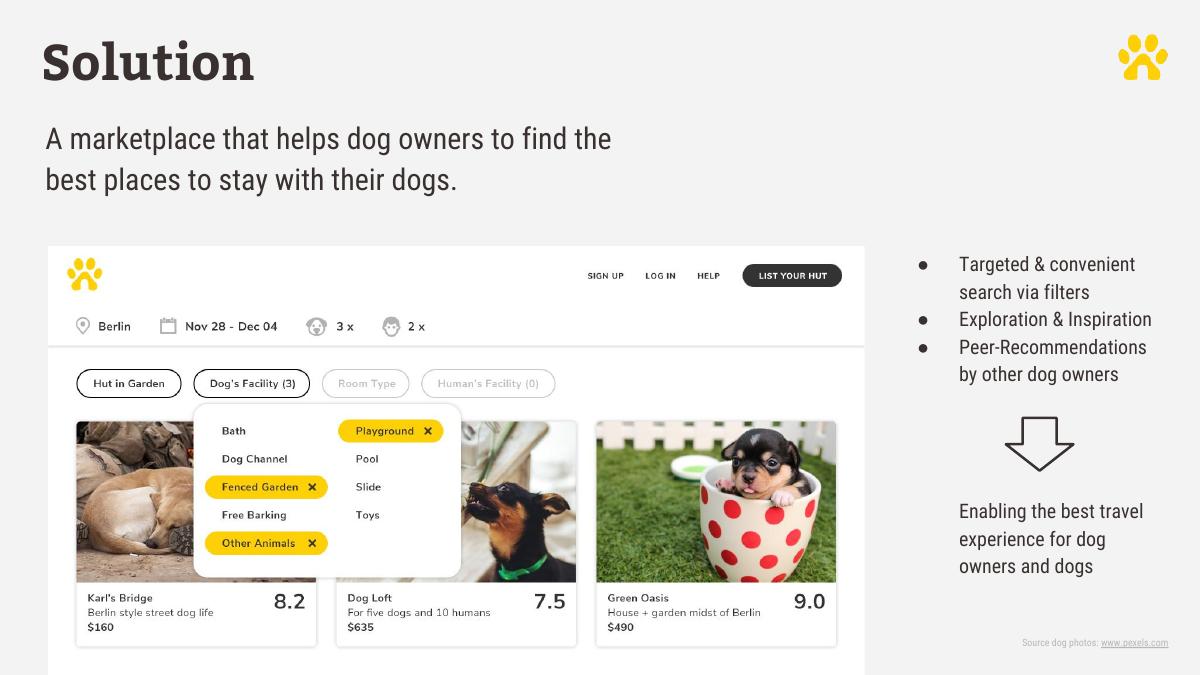
"A marketplace that helps dog owners to find the best places to stay with their dogs", with three bullets: targeted and convenient search via filters; exploration and inspiration; peer-recommendations by other dog owners. It closes on the purpose line again: "Enabling the best travel experience for dog owners and dogs."
Three feature pillars is the right number and the right altitude — these are capabilities, not a feature list. But this is where the sample-deck seams start to show: there is no product screenshot anywhere on the slide, and none anywhere in the deck. A Series A deck for a live marketplace with, by its own later claim, 18,000 listings and 190,000 active users, and no image of the product, would be an immediate and obvious flag. The reason it is absent here is that there is no product to screenshot.
If you are copying this structure, treat "solution" as a slide that must contain evidence the thing exists: one real screen, annotated with the three pillars.
Slide 5 — Market
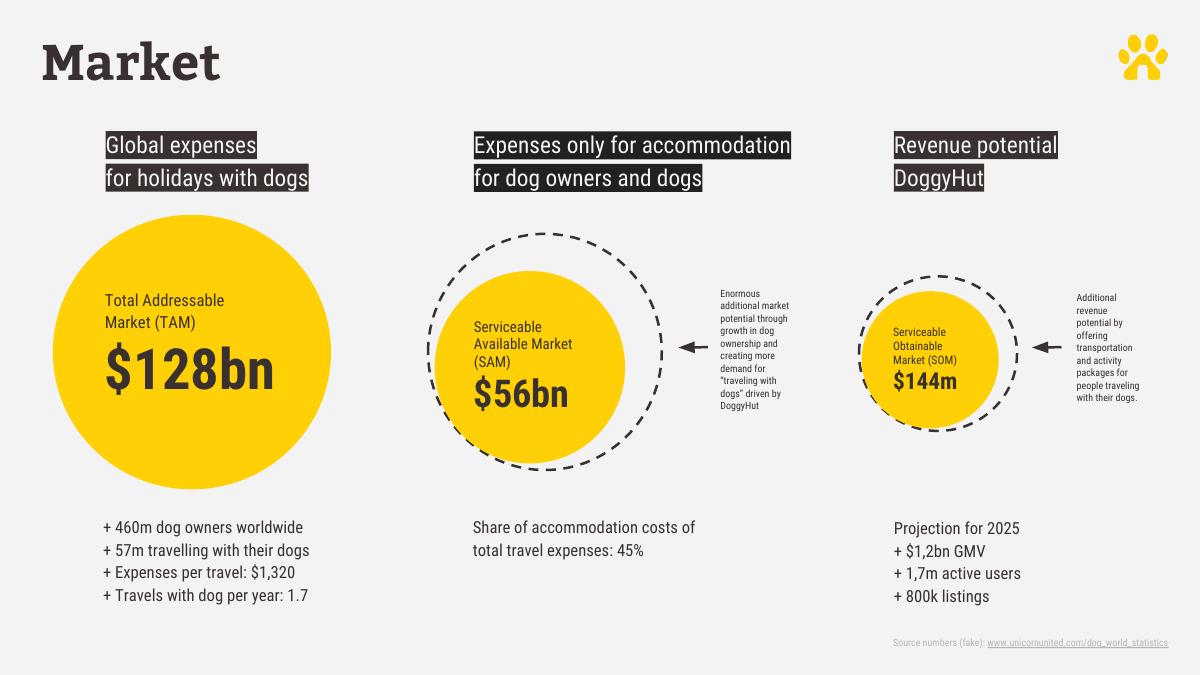
The classic TAM/SAM/SOM chevron. TAM $128bn ("Global expenses for holidays with dogs"), SAM $56bn ("Expenses only for accommodation for dog owners and dogs"), SOM $144m ("Revenue potential DoggyHut"). The build-up is shown, which is the important part: 460 million dog owners worldwide, 57 million travelling with their dogs, $1,320 expenses per trip, 1.7 trips with dog per year, and a stated 45% accommodation share of total travel spend. The SOM is a 2025 projection of $1.2bn GMV, 1.7m active users and 800k listings. A note on the right adds "additional revenue potential by offering transportation and activity packages".
Structurally this is the correct way to size a market: publish the multiplication so the reader can attack an assumption rather than the conclusion. 57m × $1,320 × 1.7 × 45% lands in the tens of billions, which is consistent with the $56bn SAM. The chain is auditable — that is the lesson.
And then the footnote: "Source numbers (fake): www.unicornunited.com/dogworldstatistics". Every input is invented. The 45% accommodation share, the 1.7 trips, the 460m dog owners — none of it is sourced to anything real. In the sample deck that is honest labelling. In your deck, the equivalent is a market slide with no citations at all, which is the single most common reason a market slide gets ignored: a partner who cannot check your inputs cannot defend them to their own partnership.
One structural note worth flagging even in a fictional deck: the SOM is expressed as $144m of revenue while the same box lists $1.2bn of GMV. At the deck's own 12% take rate, $1.2bn GMV yields $144m — so the two numbers do reconcile. That internal consistency is deliberate and is exactly the check a real deck should be able to pass.
Slide 6 — Why now
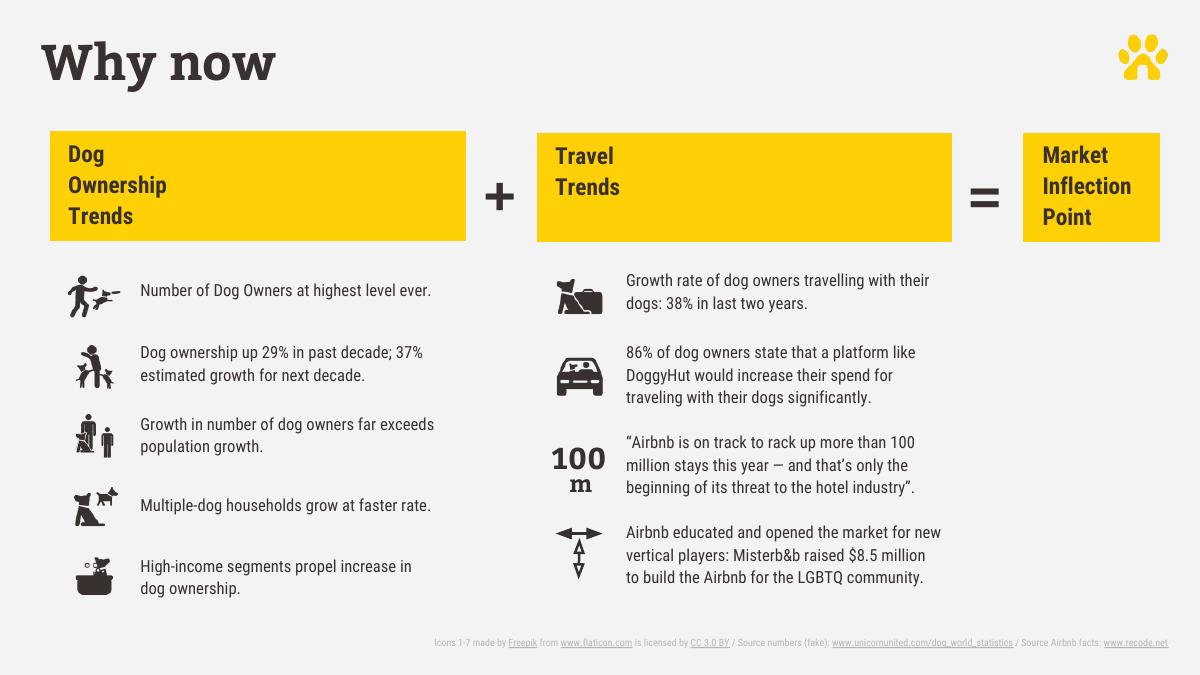
Two columns feeding an equals sign labelled "Market Inflection Point". Left column, dog ownership trends: highest number of dog owners ever; ownership up 29% in the past decade with 37% estimated growth for the next; growth exceeding population growth; multiple-dog households growing faster; high-income segments propelling the increase. Right column, travel trends: 38% growth in dog owners travelling with dogs over two years; 86% of dog owners saying a platform like DoggyHut would significantly increase their spend; the Airbnb "100 million stays" datapoint; and the precedent that "Misterb&b raised $8.5 million to build the Airbnb for the LGBTQ community."
This is the most instructive slide in the deck, and it is the one most founders skip entirely. The argument is structured as an intersection: a demand-side trend plus a behaviour-side trend equals a timing window. That is what "why now" means, and this slide models it cleanly.
The Misterb&b line does the heaviest lifting of anything in the deck. It is a real, checkable, third-party datapoint — a vertical Airbnb raised real money — and it converts "is a vertical marketplace fundable?" from an opinion into a precedent. Note the footnote separates its sources: the dog numbers are flagged fake, the Airbnb facts are attributed to recode. That split is itself the teaching point: the fabricated numbers are the ones that would have needed real sourcing, and the author knew it.
The "86% of dog owners state that a platform like DoggyHut would increase their spend" line is the kind of statistic to be most suspicious of in a real deck. Stated-intent survey data about a hypothetical product is the weakest form of evidence there is, and a partner will say so.
Slide 7 — Competition
A 2×2 with "General" and "Animal focussed" on the x-axis and "Online Travel Agency (OTA)" to "Marketplace" on the y-axis, DoggyHut placed in the top-right quadrant. Beside it, four USPs: best product experience for the "dog use case"; marketplace model; an AI solution to acquire hosts (tagged "Secret Sauce"); and "+ AAA Team".
The axes are chosen honestly, in that they are the two dimensions that actually separate the players rather than two flattering adjectives. That is more than most 2×2s manage.
But the quadrant is empty apart from DoggyHut. No competitor is named anywhere on the slide — not Airbnb, not Booking.com, not BringFido, not the dog-friendly filters that the OTAs already ship. The problem slide named the general platforms; the competition slide, where naming them matters, does not. An empty competitive map reads as "we have not looked", and the fix is trivial: place the real logos in the quadrants you claim they occupy and let your position be a comparison rather than an assertion.
"AAA Team" as a listed USP is filler. So, arguably, is "marketplace model" — a business model is not a defensibility claim when your competitor can add the same model in a quarter.
Slide 8 — Revenue Model
"We take in total a 12% commission on each transaction": a 2% transaction fee from travellers plus 10% commission from landlords on every booking made through the platform.
This is a near-perfect revenue slide, and it is perfect because of what it does not contain. One take rate, split by side, one sentence. No tiers, no future upsells crowding the primary model, no revenue "streams" that are actually ideas. A reader can hold 12% in their head for the rest of the deck and check every later number against it — which, as noted on the market slide, actually works.
The only thing a real deck would need to add: evidence that the take rate holds. Realised take rate versus headline take rate, and what discounting has been necessary to acquire supply. Headline take rates on marketplaces have a habit of eroding the moment hosts get leverage.
Slide 9 — Marketing/Sales
A demand table with channel mix for Q4/2017 (actual) versus Q4/2019 (estimated): performance marketing 77% falling to 55%; SEO/content 17% rising to 20%; viral 3% to 5%; direct and other 3% to 20%. Below it: blended CAC $244 rising to $284, CLV $1,053 rising to $1,428, payback 15 months falling to 10 months. The supply side is a description of an "AI Solution" that "identifies automatically hotels, holiday resorts and owners of dog friendly apartments and vacation houses", with onboarding via a "Host Acquisition Team (HAT)".
The good habit here is showing the channel mix as a shift over time and being honest that it is 77% paid today. Most decks bury paid dependence. Presenting it as a stated migration — paid down, direct and organic up — is how a Series A operator actually talks.
The numbers, though, are exactly where the fictional deck flatters itself in ways a real one cannot. CAC rising while payback shortens only works because CLV rises faster, and CLV is a projection with no retention curve behind it — no cohort chart, no repeat-booking data, no churn. And note the internal tension the deck never addresses: a 15-month payback at Series A is long for a consumer marketplace, and the plan is to fund growth into that payback with a $10m Series B. A real partner would spend the whole meeting on this slide.
"AI Solution" as supply strategy is, in 2018 terms, a scraper plus a sales team. Calling the sales team the "Host Acquisition Team" does not change the unit economics of human onboarding, and there is no cost per host onboarded anywhere in the deck.
Slide 10 — Team
Three founders in a table: Marc Saltberg (CEO), education "Harvhard", Business Economics MSc, career "Macrosoft", dog Billy, 1 yr. Elon Muscle (CTO), "Stanaudi", Data Science PhD, career "Coogle", dog Larry, 11 yrs. Larissa Layer (CMO), "VVHU", Master in Management, career "Racket Internet", dog Oli, 7 yrs. A footer row spans all three: "Founded together the leading Unicorn Marketplace" and "Exit for $1.1bn after 3 years".
The joke names make this slide unusable as evidence, but the schema is worth stealing outright. Four rows — education, career, personal relevance to the problem, and shared founding history — is a better team slide than the LinkedIn-headshot-and-logo-soup most decks ship. In particular, the "Dog" row is a small stroke of genius: it is the founder-market-fit row, expressed in one word per founder, and it answers "why you" without a paragraph.
The footer row is the real lesson. "Founded together the leading unicorn marketplace, exit for $1.1bn after 3 years" is the single most fundable sentence a team slide can contain, and it is placed as a band across all three founders rather than buried in one bio. If you have a shared track record, that is where it goes.
It is also worth saying plainly: this fictional team is a Series A investor's fantasy. Repeat marketplace founders with a billion-dollar exit will raise on this deck regardless of the market slide. Do not conclude from this example that your deck can be this thin on evidence.
Slide 11 — Roadmap
Four columns — Foundation Q1/2016, Seed Q2/2016 (actuals), Series A Q4/2017 (actuals, marked "NOW"), Series B Q4/2019 (estimated) — across nine metric rows. Funding: $500k by "A+ Capital", then $2m, then $10m. GMV run rate: $2.5m, $25m, $125m, with growth annotations of "900% Growth, 14% MoM" and "400% Growth, 14% MoM". Revenue run rate: $300k, $3m, $15m. Bookings per month: 280, 1.8k, 9k. Active users: 3.3k, 190k, 550k. Listings: 1.8k, 18k, 300k. Bookings per customer per year: 1.2, 1.5, 1.7. Average booking value: $745, $1.2k, "$1.4". Headcount: 5, 18, 55, each broken down by function.
This is the best-constructed slide in the deck and the one to copy most literally. It is a traction slide and a use-of-funds slide fused into one grid, with a "NOW" marker so the reader knows which column is history and which is plan. The headcount row broken down by function is effectively the hiring plan the Series A money buys. Very few real decks present past, present and planned on a single consistent axis like this.
Now the arithmetic, because that is what a teardown is for. The Series A column shows $25m GMV run rate and $3m revenue run rate — a 12% take rate, exactly matching slide 8. Good. The Series B column shows $125m GMV and $15m revenue — again 12%. Also good. The seed column, however, shows $2.5m GMV and $300k revenue, which is 12% too. Consistent throughout. This is what internal coherence looks like, and it is the discipline most real decks fail: a take rate stated on one slide should be reconstructible from every other slide.
Two things do not survive the same scrutiny. First, bookings and GMV disagree: 1.8k bookings per month at $1.2k average booking value is $2.16m per month, or roughly $26m annualised — close enough to the $25m GMV. But at seed, 280 bookings at $745 is $209k per month, roughly $2.5m annualised. That also holds. At Series B, 9k bookings at "$1.4" (presumably $1.4k, a typo) is $12.6m per month, or $151m annualised, against a stated $125m GMV run rate — a 20% overshoot. In a real deck that is the discrepancy a partner circles.
Second, "900% Growth, 14% MoM" between Q2/2016 and Q4/2017 covers 18 months; 14% monthly compounding over 18 months is roughly 10x, so the annotation is internally sound. The Series B claim of 400% growth at 14% MoM over 24 months is not: 14% monthly for 24 months is over 23x, not 5x. The two annotations use the same monthly rate for two very different multiples. Even the model answer has a slide with a number that does not survive a calculator.
Slide 12 — Vision
"In 5 years, DoggyHut will be the global No. 1 go-to inspiration and booking platform for every dog owner traveling with their dog(s), serving >1.5m users and >50k bookings per month."
Correctly placed — vision after the numbers, not before them, so it reads as an extrapolation of the roadmap rather than a substitute for it. And correctly quantified: a vision slide with two numbers in it is a commitment; a vision slide without numbers is a mood.
The 1.5m users figure is, notably, lower than the market slide's 2025 projection of 1.7m active users, and 50k bookings per month is well above the roadmap's 9k at Q4/2019. Neither is wrong, but a careful reader will notice the vision slide and the market slide are quoting different user counts for roughly the same horizon.
Slide 13 — Contact
The reveal: "This pitch deck and the related blog article are presented by: Iskender Dirik, MD at Microsoft ScaleUp / Microsoft for Startups Berlin."
There is no ask slide. There is no email address for a founder, no round terms, no lead investor status, no use of funds beyond the headcount row on the roadmap. The deck says "Deck for Series A Round." on slide 1 and "$2m" in a roadmap cell on slide 11, and that is the entirety of the ask.
For a teaching deck that is fine. For your deck it is the single most expensive omission on this list — and it is worth noticing that the most-copied sample Series A deck on the internet does not model the ask slide at all.
What this deck does better than most startup pitch decks
It states the round on the cover. One line, bottom-right, and the reader calibrates everything that follows. · It separates purpose from mechanics. One quoted sentence for why, one plain sentence for what — both memorable after a single read. · It shows the market build-up, not just the total. Population, penetration, frequency, price and share are all on the slide, so the reader can argue with an input instead of dismissing the output. · It treats "why now" as an intersection of two trends. Demand trend plus behaviour trend equals inflection point, with a real funded precedent (Misterb&b) as the anchor. · The revenue model is one number. 12%, split 2% and 10% by side, and every GMV-to-revenue pair in the deck reconciles to it. · The channel mix is shown as a migration over time. 77% paid today, declining to 55%, stated openly rather than hidden. · The team slide has a founder-market-fit row. One word per founder — the dog's name — does the job of a paragraph. · The roadmap fuses traction and plan on one axis with a "NOW" marker, including a headcount breakdown that doubles as the hiring plan. · The vision slide is quantified and placed after the numbers, so it extrapolates rather than substitutes.
Where this deck would fail in an investor meeting
Every market number is fabricated and labelled as such. Instructive as a template; fatal as a deck. The real-world equivalent — an unsourced market slide — is the most common reason a partner stops reading. · There is no ask slide. No amount, no use of funds, no runway, no round structure. "$2m" appears only as a cell in a table. · There is no product screenshot anywhere in 13 slides — for a company claiming 190,000 active users and 18,000 listings. · The competition 2×2 names no competitors. The problem slide names Airbnb and Booking.com; the competition slide, where it counts, names nobody. · No retention or cohort data behind the CLV. $1,053 rising to $1,428 with no repeat-rate curve is an assumption presented as a metric. · A 15-month CAC payback is not addressed as a risk. It is presented, then improved by assumption to 10 months, with no explanation of the mechanism. · The Series B growth annotation does not survive a calculator. 14% MoM over 24 months is not 400% growth. · Series B bookings × average booking value overshoots the stated GMV by roughly 20%. · Vision and market slides quote different user counts for broadly the same horizon. · "AAA Team" and "marketplace model" are listed as USPs. Neither is a defensibility claim. · No unit economics per host. A human "Host Acquisition Team" is the supply strategy, with no cost attached to it anywhere. · No dates on the cover. Every "actual" in the deck is undated relative to the file.
Sample deck versus a real Series A deck
Element DoggyHut (sample, 2018) What a real Series A deck must do
Market numbers Invented, footnote says "fake" Every input cited to a named, dated source
Traction Roadmap table of clean round numbers Charts from the actual data warehouse, with the ugly months visible
Product Described in three bullets, never shown At least one real screen, annotated
Retention CLV stated, no curve Cohort retention chart and repeat-booking rate
Competition Empty 2×2 with only your own logo Named competitors placed on the same axes
Team Fictional names, invented $1.1bn exit Real names, verifiable history, and the gaps you are hiring for
Ask None; "$2m" appears only in a table cell Amount, use of funds, runway bought, milestones unlocked
How you would rebuild this deck as a real Series A deck
Keep the running order exactly. Cover → purpose → problem → solution → market → why now → competition → revenue model → go-to-market → team → roadmap → vision → ask. That sequence is the deck's genuine contribution and it works. · Add a 14th slide: the ask. Amount, use of funds by category, months of runway bought, and the three milestones that make the next round obvious. Put it before contact details, not after. · Re-source every market input. Replace the fake footnote with a named source and a year per input: dog ownership counts, travel frequency, accommodation share of trip spend. Keep the multiplication visible. · Put competitors in the 2×2. Airbnb, Booking.com and the animal-focused incumbents belong in the quadrants you say they occupy; your position only means something in contrast. · Insert a product slide between solution and market. One real screen showing the dog filters, one showing a listing, one showing a booking. Three annotations, no chrome. · Replace CLV with a cohort chart. Repeat bookings by cohort month is the number a marketplace investor actually underwrites; CLV is the output, not the evidence. · Show host economics. Cost per host onboarded, listings per HAT rep per month, and what the "AI solution" changes about that cost. Supply is the hard side of this marketplace and the deck spends one paragraph on it. · Recheck every derived number with a calculator. Bookings × average value must equal GMV; GMV × take rate must equal revenue; the stated MoM rate must produce the stated multiple over the stated period. This deck passes two of those three checks and fails the third. · Date the cover. Month and year, legal entity, one contact. · Keep the "Dog" row. Whatever your market is, add the one-line founder-market-fit row to the team slide. It is the cheapest credibility on the page.
The transferable lesson
The most valuable thing about the DoggyHut deck is also the most uncomfortable: it looks better than almost every real deck you will read, and it looks better precisely because the author controlled the underlying business. Every number reconciles because someone chose the numbers. The market builds up cleanly because the inputs were reverse-engineered from the conclusion. The team is unimpeachable because it was written to be.
Your deck cannot do that. Your take rate is what hosts actually accept, your CAC is what the auction actually charges, and your retention curve bends where it bends. So use this deck the way it was meant to be used — as a structure — and then apply the one test it passes that most real decks fail: does every derived number in your deck reconcile with every other number in your deck? Take rate against GMV and revenue. Bookings against average value and GMV. Growth rate against the period and the multiple.
That single audit — running a calculator across your own slides before anyone else does — is the difference between a deck that survives a partner meeting and a deck that gets one polite email. Even the fictional model answer failed one of its own checks. Yours will fail more than one unless you go looking.
Frequently asked questions
- Is DoggyHut a real company?
- No. DoggyHut is a fictional startup invented for a sample pitch deck. The deck was published in March 2018 by Iskender Dirik, then Managing Director at Microsoft ScaleUp Berlin (Microsoft for Startups), as a companion to a blog article about building a Series A deck. The closing slide credits him directly, and the team slide uses joke names such as Elon Muscle and universities called Harvhard and Stanaudi.
- Did the DoggyHut pitch deck raise any money?
- No, because there was no company to fund. The deck shows a $500k seed from 'A+ Capital', a $2m Series A and a $10m Series B, but all of these are invented illustrations inside a teaching example. No real funding round is associated with DoggyHut, and the market slide explicitly footnotes its source numbers as fake.
- Why is the DoggyHut deck so widely shared as a pitch deck example?
- Because its structure is unusually clean. It runs cover, company purpose, problem, solution, market, why now, competition, revenue model, marketing and sales, team, roadmap, vision, contact - in that order, with one idea per slide. Founders download it as a template. The risk is copying its confidence without noticing that its numbers were chosen rather than measured.
- Which DoggyHut slides should founders actually copy?
- Four. The company purpose slide, which separates the mission sentence from the marketplace mechanics. The market slide, which shows the full multiplication rather than just a headline TAM. The revenue model slide, which is one 12% take rate split by side. And the roadmap grid, which puts past, present and planned metrics on a single axis with a 'NOW' marker and a headcount breakdown.
- What is wrong with the DoggyHut deck?
- Twelve things, chiefly: fabricated market data, no ask slide, no product screenshot in 13 slides, a competition 2x2 with no competitors named in it, CLV stated with no cohort or retention data behind it, a 15-month CAC payback presented without addressing the risk, and a Series B growth annotation claiming 400% growth at 14% month-on-month, which over 24 months would actually compound to more than 23x.
- What is DoggyHut's business model in the deck?
- A peer-to-peer marketplace connecting dog owners with landlords renting places that accept dogs. It monetises with a total 12% commission per transaction: a 2% transaction fee charged to travellers plus a 10% commission charged to hosts on every booking made through the platform. Supply is acquired by an 'AI solution' that finds dog-friendly properties, with onboarding handled by a human Host Acquisition Team.