Domino Data Lab’s 2020 pitch deck is a masterclass in enterprise positioning, moving beyond simple tool utility to claim the status of a 'system of record.' At the Series E stage, the narrative shifts from product features to market maturation and financial predictability. The deck highlights a massive $60B enterprise spend on AI/ML and utilizes high-profile third-party validation from Gartner and Forrester to cement its leadership. Key to the successful $43M raise was the demonstration of a robust 'land and expand' model, showing initial deals of $500k ACV growing to $2.4M. While it lacks gr…
Key takeaways
- Enterprises are projected to spend $60B on AI/ML annually, excluding salaries, creating a massive greenfield opportunity (Slide 2, 4).
- Domino positions itself as the 'open system of record' for enterprise AI/ML, acting as a central gateway for various tools and infrastructures (Slide 5, 7).
- The company holds a 'Leader' position in Forrester's Notebook-based Predictive Analytics and ML Solutions wave (Slide 8).
- A specific case study shows an initial $500k ACV deal expanding to $2.4M ACV over two years (Slide 9).
- Domino has captured 20% of the Fortune 100, including 4 of the top 10 pharma companies and 3 of the top 5 ratings agencies (Slide 12).
- The market is maturing, with the percentage of wins originating from budgeted initiatives nearly quadrupling over the tracked period (Slide 15).
- Net retention shows a clear upward trend, increasing significantly between year 1 and year 3 after the initial land (Slide 14).
- The leadership team features executives with backgrounds from Bridgewater, Microsoft, Salesforce, and Adobe (Slide 16).
The Narrative: From Tool to Infrastructure
Domino Data Lab’s 2020 pitch deck is designed for a late-stage audience. At Series E, investors are less interested in the 'how' of the technology and more interested in the 'where' of the market and the 'how much' of the growth. The deck follows a classic enterprise software narrative: identify a massive, chaotic spend; position the product as the only solution for order; and prove that the world’s largest companies are already paying for it.
Slides 1-5: The Problem and the Opportunity
The deck opens with a bold market claim on Slide 2 : "Enterprises will spend $60B on AI/ML this year, excluding salaries." This immediately establishes the scale of the opportunity. Slide 3 uses a visual metaphor of children playing soccer to describe the current state of enterprise AI as a "mess of disorganized people, tools, and infrastructure."
Slide 4 and Slide 5 introduce the core thesis: this chaos creates a "greenfield system-of-record opportunity," and Domino is the "only open system of record for enterprise AI/ML." By using the term "system of record," Domino is positioning itself alongside foundational enterprise categories like CRM (Salesforce) or ERP (SAP), which implies high stickiness and long-term value.
Slides 6-8: Product and Validation
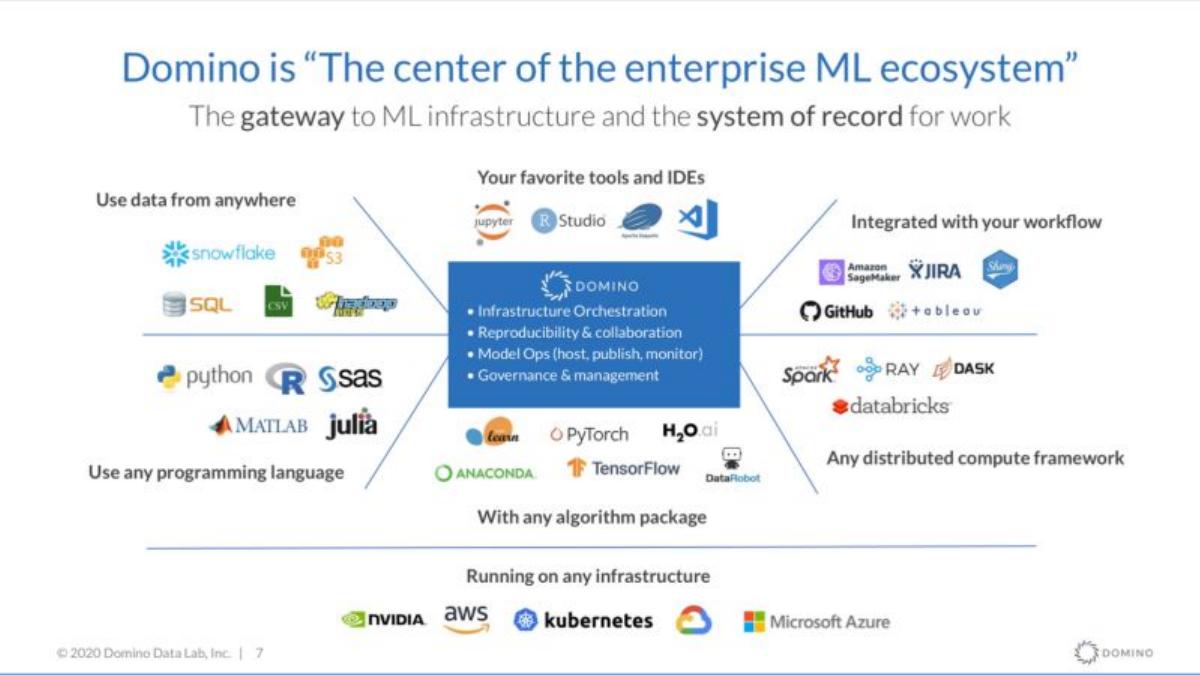
Slide 7 provides the technical architecture of this "system of record." It shows Domino at the center, orchestrating data from sources like Snowflake and S3, supporting languages like Python and R, and running on infrastructure like AWS and Kubernetes. This slide is crucial for showing that Domino is an "open" platform that doesn't require customers to rip and replace their existing stacks.
Slide 8 shifts to external validation. It features the Forrester Wave for Notebook-based Predictive Analytics, where Domino is circled as a Leader. It also includes a quote from Gartner praising Domino’s support and service scores. For a Series E investor, this third-party proof reduces the perceived risk of the technology and the company's ability to serve large clients.
Slides 9-10: The Enterprise Case Studies
The deck uses two specific case studies to prove its value proposition. Slide 9 details a customer that started with a $500k ACV deal in 2016 and expanded to a $2.4M ACV firm-wide platform by 2018. It attributes this growth to Domino’s flexibility and infrastructure orchestration. Slide 10 focuses on a major health insurance company with a $1.2M ACV , highlighting the need for "workforce orchestration" for over 1,000 researchers and the elimination of "shadow IT."
Slides 11-13: Market Size and Penetration
Slide 11 breaks down the market into three tiers: the current $12B market (2M users), a 5-year projection of $30B (6M users), and a future $65B market driven by new products and pricing. Slide 12 is perhaps the most impressive slide in the deck, stating that Domino has captured 20% of the Fortune 100 . It lists specific penetrations: 4 of the top 10 pharma companies, 8 of the largest global banks, and 3 of the top 5 ratings agencies.
Slide 13 visualizes the "Land vs Expand" model across 12 major customers (C1 through C12). The chart shows that for many of these top-tier clients, the expansion revenue (light blue) is significantly larger than the initial land (dark blue), proving the company's ability to grow within its existing footprint.
Slides 14-15: Retention and Maturation
Slide 14 discusses retention and LTV. While it uses placeholders like "x%" for Gross Churn and "xxx%" for Net Retention, the accompanying bar chart shows that Net Retention increases every year a customer stays with the platform, peaking at Year 3. This suggests that the longer a customer uses Domino, the more valuable they become.
Slide 15 argues that the market is maturing. It shows two charts: one showing that the percentage of wins from budgeted initiatives is growing, and another showing that New Lands ASP (Average Selling Price) is on an upward trajectory. This is a signal to investors that the sales cycle is becoming more professionalized and lucrative.
Slides 16-19: Team and Growth
Slide 16 introduces the leadership team, highlighting experience from Bridgewater, Microsoft, Salesforce, Adobe, and Amazon . This is a "scale-up" team, not a "startup" team. Slide 17 claims that "Q4 was our largest yet," listing a flurry of new enterprise lands and expansions across F500 and G2K companies.
The deck concludes its data presentation on Slide 18 with an ARR growth chart. While the Y-axis lacks specific dollar amounts, the bars show consistent year-over-year growth from FY 2018 through a projected FY 2021E , with the largest jump occurring in the most recent periods.
What Works in This Deck
The "System of Record" Positioning: By claiming this specific category, Domino moves away from being a "nice-to-have" tool and becomes a "must-have" infrastructure component. · Heavy Use of Logos and Verticals: Instead of just saying they have customers, they break them down by industry (Pharma, Banking, Insurance), which proves they have solved the specific regulatory and security needs of those sectors. · Land and Expand Visualization: Slide 13 is a very effective way to show the long-term value of an enterprise customer without needing to show a full P&L. · Market Maturation Argument: Showing that more deals are coming from budgets (Slide 15) is a sophisticated way to prove that the industry has moved past the "experimental" phase.
What Is Missing
Specific Financials: For a Series E round, the use of "X%" and "XXX%" for churn and retention is unusual. Investors at this stage usually require hard numbers in the main deck. · The Ask: There is no slide detailing how much money is being raised or how it will be allocated (e.g., R&D vs. Sales expansion). · Competitor Comparison: While the Forrester Wave shows competitors, the deck doesn't explicitly explain why Domino wins against specific rivals like DataRobot or Databricks in a head-to-head evaluation. · Unit Economics: There is no mention of LTV/CAC ratios or payback periods, which are standard metrics for late-stage SaaS companies.
What Other Founders Should Copy
The Problem Visual: Using a simple, relatable image (the soccer kids) to explain a complex technical problem (disorganized ML infrastructure) is highly effective. · The "Gateway" Diagram: Slide 7 is a perfect example of how to show your product as a central hub that adds value to an existing ecosystem rather than competing with it. · The Maturation Metric: Tracking whether your sales come from "budgeted initiatives" is a great way to prove market timing and product-market fit to late-stage investors. · Third-Party Validation: If you are a leader in a Gartner or Forrester report, make it a centerpiece of your deck. It carries more weight than any internal metric.
Frequently asked questions
- What is the primary value proposition of Domino Data Lab according to the deck?
- Domino positions itself as the 'system of record' for enterprise AI and machine learning. Rather than being just another tool, it acts as a central orchestration layer that integrates with existing data sources (like Snowflake and S3), programming languages (Python, R), and compute frameworks (Spark, Kubernetes). This allows large organizations to manage the 'mess' of disorganized people and infrastructure while ensuring reproducibility and governance.
- How does Domino demonstrate its 'land and expand' capability?
- The deck uses a specific, anonymized case study on Slide 9 to show a 2016 initial deal of $500k ACV for a 'Data Science Center of Excellence' that grew into a $2.4M firm-wide platform by 2018. This is supported by Slide 13, which provides a bar chart of 12 major customers, showing that in many cases, the 'expansion' revenue significantly outweighs the 'initial land' revenue.
- What evidence of market validation does the deck provide?
- Domino relies heavily on third-party analyst validation. Slide 8 features a Forrester Wave chart placing Domino in the 'Leaders' category and a quote from Gartner's Magic Quadrant identifying them as a 'Visionary.' Additionally, Slide 12 lists impressive market penetration statistics, such as serving 8 of the largest global banks and 6 of the largest global insurance companies.
- What does the deck reveal about the maturity of the AI/ML market in 2020?
- Slide 15 argues that the market is maturing rapidly. It shows two key trends: first, that a much higher percentage of sales wins are now coming from pre-budgeted enterprise initiatives rather than ad-hoc departmental spends. Second, the Average Selling Price (ASP) for 'New Lands' is increasing, suggesting that enterprises are committing larger sums of money upfront for data science platforms.
- What critical fundraising information is missing from this deck?
- As a late-stage (Series E) deck, it is surprisingly light on specific financial figures. While it shows growth trends for ARR and ASP, it uses 'X%' and 'XXX%' placeholders for gross churn and net retention on Slide 14. It also lacks a specific 'Ask' slide detailing how the $43M would be spent, and it does not provide a detailed breakdown of unit economics like Customer Acquisition Cost (CAC).