Travel Market Size Slides: 7 Real Startup Examples
How travel startups size their market: trips booked, travel spend, customers × revenue, or property listings.
Travel Market Slide: Trips, Spend and the Share You Can Book
Travel is one of the largest consumer spending categories, which makes a huge headline easy to find and hard to use. What investors want is the step from all travel to the trips, customers or listings your product can actually serve, and a unit they can check. The slides below take that step in different ways, and some skip it.
TL;DR
Start from a unit you serve (trips, travelling customers, companies or listings), multiply by what each is worth, and show the share you can win. Lola is the clearest example: 600K US companies with 20-500 employees at $10k annual revenue per customer gives a $6B US market. Airbnb's early slide counts trips instead (2 billion+, 560M budget and online, 84M at 15%). Headlines of total travel spend ($1.3 trillion, $150 billion) show scale but not what a startup could book.
Travel market slides from real pitch decks
Each example shows the slide above its analysis and links to the full teardown. Slides that build the market from a unit and a price come first. Claims are as shown on the slides; comments and calculations are ours.
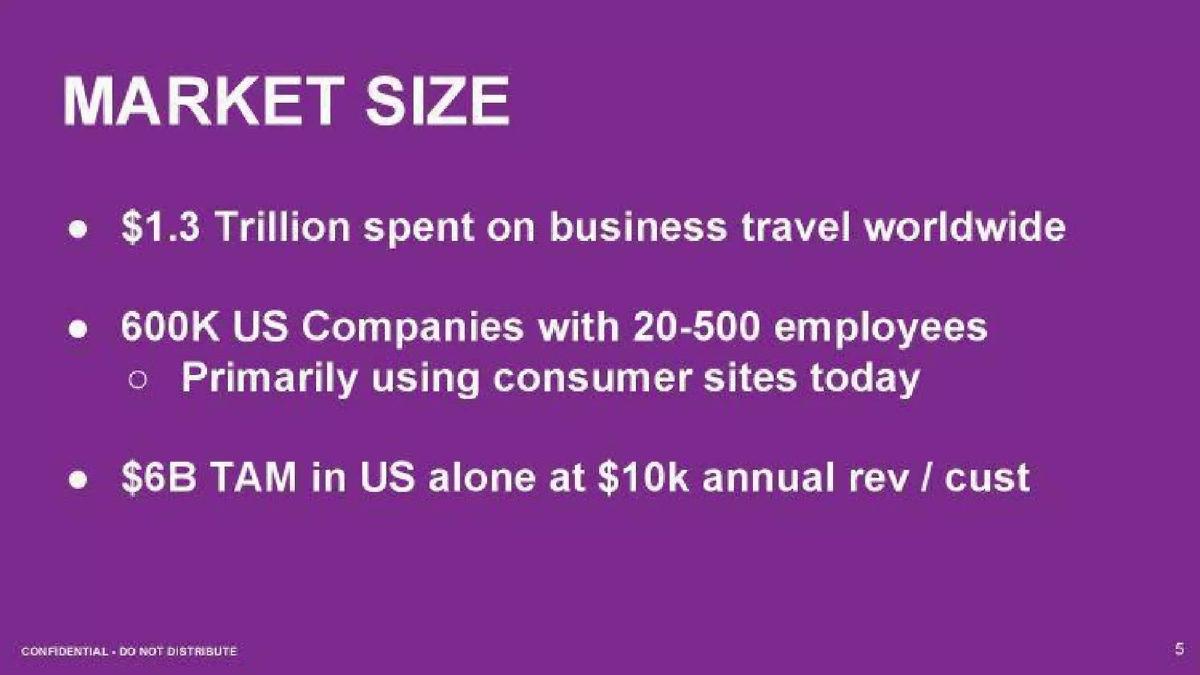
Lola market slide — slide 5
Business travel booking for small and mid-sized companies, US.
Lola deck, slide 5. Exact stored slide matched to this analysis.
Our analysis: Customers × revenue per customer, below a spend headline.
Evidence and limitation: It narrows from worldwide spend to a counted customer group and states revenue per customer. Our check: 600,000 × $10,000 = $6B, so the TAM follows from the two inputs shown. The $10k per customer is Lola's own revenue assumption, not travel spend, which is the right unit for its business; the slide doesn't explain where the $10k comes from, and gives no sources.
What a founder can adapt: "[N] [customers] × $[revenue]/yr = $[X] ([source]). Of $[total spend] in [category]."
Supporting analysis
What the deck claims: "$1.3 Trillion spent on business travel worldwide." "600K US Companies with 20-500 employees. Primarily using consumer sites today." "$6B TAM in US alone at $10k annual rev / cust."
Presentation choice: Investors can rebuild the $6B and challenge each input.
When it does not fit: Leaving the revenue-per-customer basis unexplained.
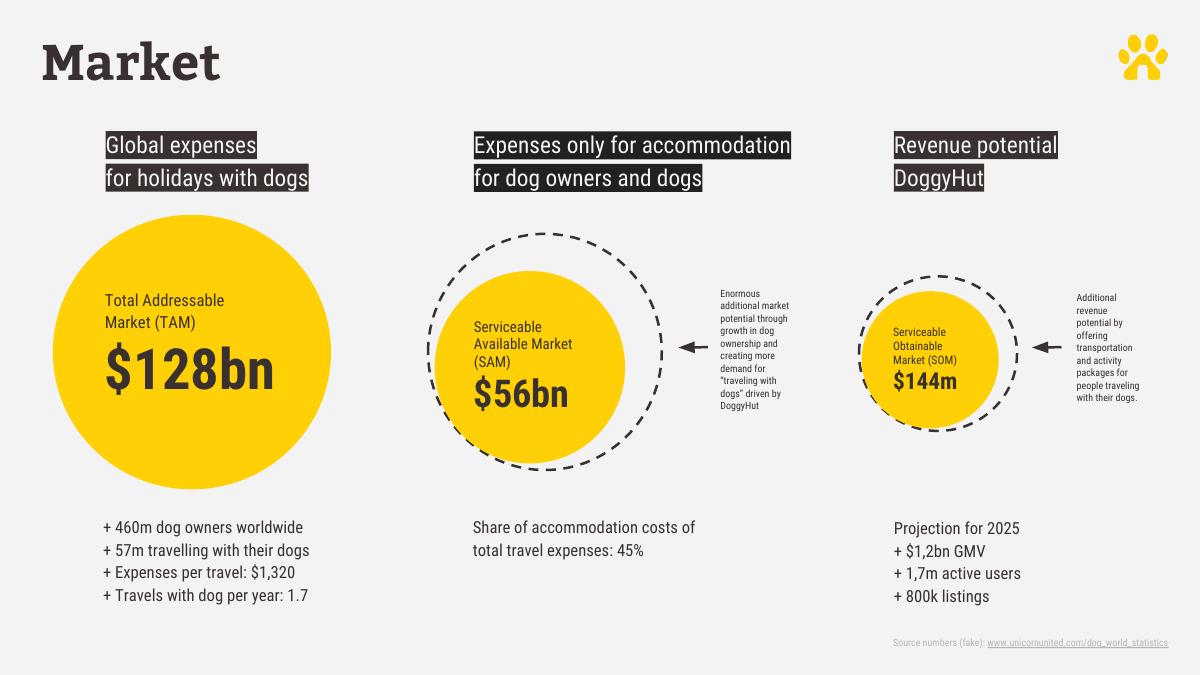
Marketplace for dog-friendly holiday accommodation.
DoggyHut deck, slide 5. Exact stored slide matched to this analysis.
Our analysis: Travellers × spend × trips, narrowed to accommodation, then revenue.
Evidence and limitation: Each tier shows its inputs. Our check: 57m × $1,320 × 1.7 ≈ $127.9bn, matching $128bn; 45% of $128bn ≈ $57.6bn, close to the $56bn shown. The SOM is labelled revenue and set against $1.2bn GMV; $144m is 12% of that (our calculation), which reads as a take rate but the slide doesn't state it. The source line at the bottom is too small to read on the image.
What a founder can adapt: "[N] travellers × $[spend] × [trips]/yr = $[TAM]; [share]% on [category] = $[SAM]; $[GMV] × [take]% = $[revenue]."
Supporting analysis
What the deck claims: TAM "$128bn" ("Global expenses for holidays with dogs"): "+ 460m dog owners worldwide + 57m travelling with their dogs + Expenses per travel: $1,320 + Travels with dog per year: 1.7". SAM "$56bn" ("Expenses only for accommodation"): "Share of accommodation costs of total travel expenses: 45%". SOM "$144m" ("Revenue potential DoggyHut"): "Projection for 2025 + $1,2bn GMV + 1,7m active users + 800k listings".
Presentation choice: Every number can be traced to an input on the slide.
When it does not fit: An unstated take rate between GMV and revenue.
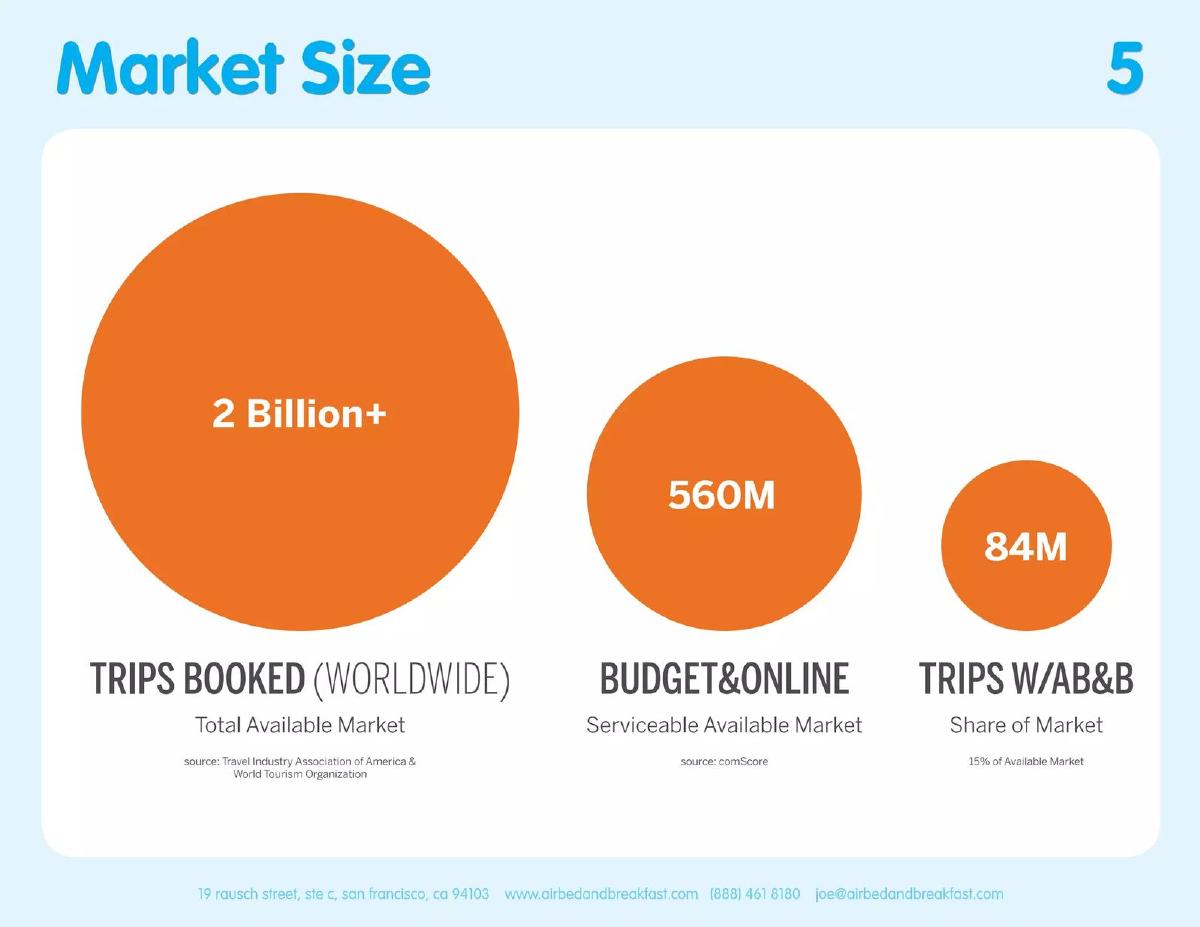
Early AirBed&Breakfast deck: book rooms with locals.
Airbnb deck, slide 5. Exact stored slide matched to this analysis.
Our analysis: Same unit at every tier, with sources, but no value per trip.
Evidence and limitation: All three tiers use the same unit, trips, and each narrows the one above. Our check: 15% of 560M = 84M. The slide counts trips, not revenue, and doesn't say what a trip is worth to the company, so investors have to supply the price per booking themselves. A 15% share is a large assumption for an early company and the slide doesn't justify it.
What a founder can adapt: "[N] trips ([source]) → [M] [segment] ([source]) → [share]% = [K] trips × $[revenue/trip] = $[X]."
Supporting analysis
What the deck claims: "2 Billion+ Trips Booked (Worldwide) Total Available Market" (source: Travel Industry Association of America & World Tourism Organization). "560M Budget&Online Serviceable Available Market" (source: comScore). "84M Trips W/AB&B Share of Market" ("15% of Available Market").
Presentation choice: A consistent unit makes the narrowing easy to follow.
When it does not fit: Stopping at a trip count with no value per trip.
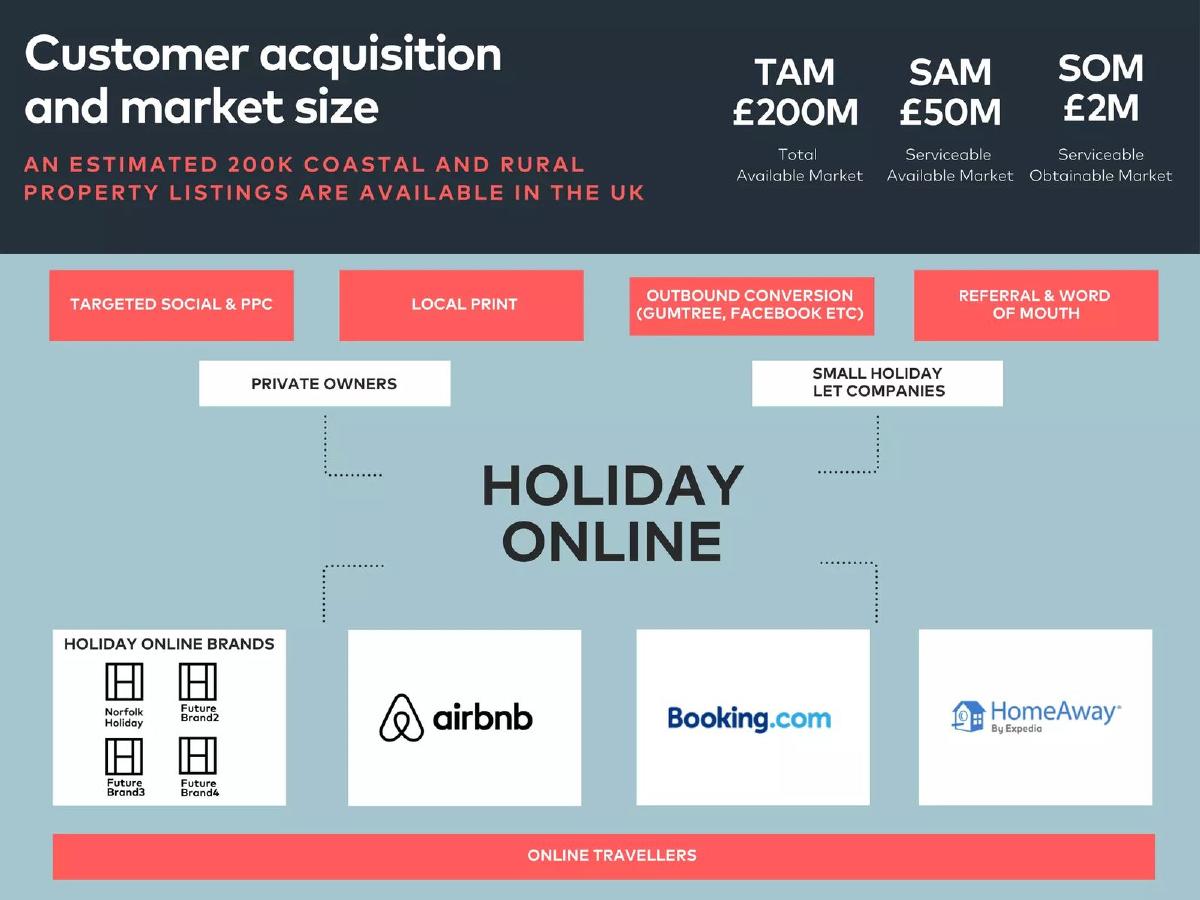
Holiday-let listing brands for coastal and rural UK properties.
Holiday Online deck, slide 8. Exact stored slide matched to this analysis.
Our analysis: Listings count with an implied fee per listing.
Evidence and limitation: It counts supply (listings) in a defined geography and ties the market to how it will reach owners. Our calculation: £200M ÷ 200,000 listings = £1,000 per listing, which implies a yearly fee per property, but the slide doesn't state a price or how the SAM and SOM were narrowed. No sources are shown.
What a founder can adapt: "[N] listings × £[fee]/yr = £[TAM]; [segment] [M] listings = £[SAM]; [K] listings in [years] = £[SOM]."
Supporting analysis
What the deck claims: "Customer acquisition and market size." "An estimated 200K coastal and rural property listings are available in the UK." "TAM £200M Total Available Market; SAM £50M Serviceable Available Market; SOM £2M Serviceable Obtainable Market." Channels: targeted social & PPC, local print, outbound conversion (Gumtree, Facebook etc), referral & word of mouth; private owners and small holiday let companies; Airbnb, Booking.com, HomeAway shown alongside.
Presentation choice: For a supply-side business, listings are the right unit.
When it does not fit: An implied price the slide never states.
iSmartAfrica deck, slide 6. Exact stored slide matched to this analysis.
Our analysis: Clear regional narrowing, then a unit mix-up at the share.
Evidence and limitation: TAM and SAM narrow sensibly from all travel to online travel in one region. The SOM is labelled as monthly active users but shown with a dollar sign, so it mixes units: investors can't tell whether it means 100 million users or $100M of bookings. No sources or years are given.
What a founder can adapt: "$[TAM] travel ([source]); $[SAM] online; [N] users × $[spend] × [take]% = $[SOM]."
Supporting analysis
What the deck claims: "$30+B African travel and tourism market size, Total Available Market" (TAM). "$7+B Online travel market in Africa, Serviceable Available Market" (SAM). "$100+M Monthly active users in Africa, Share of Market" (SOM).
Presentation choice: The TAM-to-SAM step is the right one for an online travel platform.
When it does not fit: A dollar sign on a user count.
Tripea deck, slide 3. Exact stored slide matched to this analysis.
Our analysis: Sourced tables, but no link to the company's own share.
Evidence and limitation: It shows its sources and the tables behind both headlines. Our reading: the $309B headline is the 2010 column; the same table gives $523B for 2016, so the headline uses the older figure. The 150 million visitors are across the ten biggest travel sites, which shows demand for travel sites generally, not for Tripea. There's no step from either figure to Tripea's revenue.
What a founder can adapt: "$[X] online travel ([year], [source]); [N] visitors × [conversion]% × $[revenue] = $[Y]."
Supporting analysis
What the deck claims: "Market Validation: 150 Million unique monthly visitors." "Market Size: US$309 Billion Total Addressable Market Opportunity w/ 24% CAGR." Tables: "Unique monthly visitors by website" (TripAdvisor 27,000,000 … top 10 total 152,500,000; source ebizmba.com) and "Online travel sales by region" (worldwide US$309B in 2010, US$523B in 2016, CAGR 24%; source newmediatrendwatch.com).
Presentation choice: Showing the source table lets investors check the headline.
When it does not fit: Visitor totals for other sites presented as your validation.
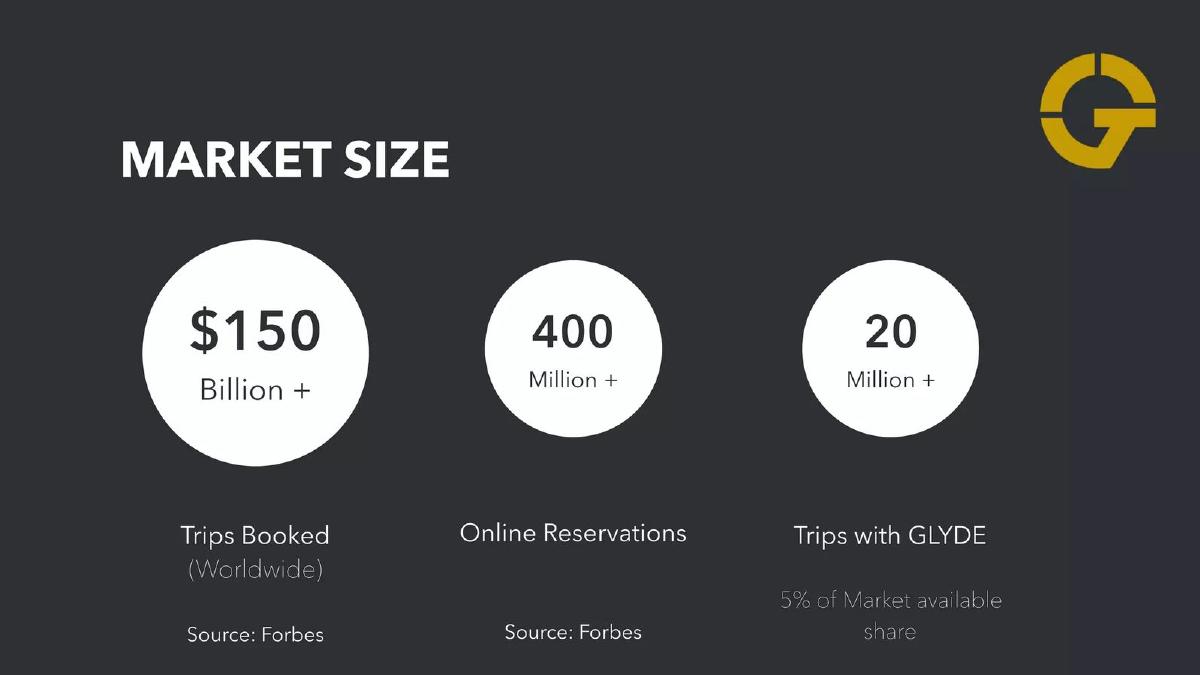
Glyde deck, slide 5. Exact stored slide matched to this analysis.
Our analysis: Three tiers in two different units.
Evidence and limitation: Weaker example. The first tier is in dollars and the next two in reservations and trips, so the tiers don't narrow in one unit. Our check: 5% of 400M = 20M. It follows Airbnb's three-circle layout but without the consistent unit that makes Airbnb's readable, and gives no value per trip.
What a founder can adapt: "[N] trips → [M] online → [share]% = [K] trips × $[revenue/trip] = $[X]."
Supporting analysis
What the deck claims: "Market Size." "$150 Billion + Trips Booked (Worldwide)" (Source: Forbes). "400 Million + Online Reservations" (Source: Forbes). "20 Million + Trips with GLYDE" ("5% of Market available share").
Presentation choice: Investors can't follow a narrowing that changes unit.
When it does not fit: Switching from dollars to counts between tiers.
What improved: Our illustrative rewrite of Glyde's slide in a single unit; bracketed text is a placeholder, not company fact.
What's different about travel market sizing
Travel figures come as gross booking value, trips, nights or visitors, and a booking company usually keeps only a commission or fee on that value. A market stated in bookings is not the same as the revenue a startup would earn. Say whether your figures are gross travel spend or your own revenue, and keep the unit consistent from the widest tier to your share.
What investors check
Which traveller, trip type and geography is counted. Whether each tier narrows the one above it in the same unit. Whether the figure is spend, bookings or revenue. Whether the share is stated and plausible, and whether sources and years are shown.
How we read each slide
We quote the text on the slide images and mark our own arithmetic as ours. We have not checked any market figure or source. Page numbers are pages in the original deck file. Six images were already stored and were checked against the decks; one was rendered from its deck PDF.
Common mistakes
Gross bookings as revenue. State what you keep per booking.
Changing units between tiers. Keep trips, dollars or users throughout.
Other sites' traffic as validation. Show your own demand.
Unexplained share. Justify the percentage you assume.
Diagnostic checklist
Unit defined.
Segment and geography stated.
Revenue per unit shown.
Same unit at every tier.
Sources and years cited.
Frequently asked questions
How should a travel startup size its market?
Count the units you serve and multiply by what each is worth to you. Lola shows 600K US companies × $10k annual revenue per customer = $6B.
How did Airbnb show market size in its early deck?
In trips: 2 billion+ trips booked worldwide, 560M budget and online, and 84M trips as a 15% share. The unit is consistent, but the slide gives no value per trip.
How we chose these examples
Corpus: published pitch deck teardowns on StartupFundraising.com. Founder-uploaded private decks are excluded.
Selection (2026-09-26): we searched teardown slide text for market-size wording together with travel, tourism, hotel, trip or booking terms, reviewed nine candidate slides from the deck files, and kept seven.
Excluded: Fly Nimbus (TAM and SAM given without any link to its surprise-trip segment), AdventureClicknBlog (growth claim and India figure without a path to its own market). Other Airbnb deck versions in the library repeat the same slide; we show one.
Page numbers are pages in the original deck files. Lola, DoggyHut, Airbnb, iSmartAfrica, Tripea and Glyde images were already stored and were checked pixel-for-pixel against fresh renders; Holiday Online was rendered from its deck PDF.
Market figures and sources are quoted from the slides and not independently verified. Calculations (products, shares, implied prices) are ours and marked as such.
Review: slide images were checked on 2026-09-26 and matched to company, deck and page (editorial model review). No person has yet completed an editorial review of this page. We make no claim that any slide caused a fundraising outcome.