Bottom-Up Market Sizing: 7 Real Pitch Deck Examples
How to size a market bottom-up on a pitch deck slide: buyers × price, where the price comes from, and how to check the arithmetic.
Bottom-Up Market Sizing: Showing Buyers × Price on Your Market Slide
A bottom-up market size multiplies the number of buyers by what each one pays. This guide compares seven real market slides to show how to present that calculation so an investor can check it in a few seconds.
TL;DR
Show the multiplication on the slide: who the buyers are, how many there are, what each one pays and the result. Anima does it in three lines: 5M designers + 15M front-end developers, $400 per seat per year, $8B a year. ComplYant adds its buyer groups up to 90.4 million, multiplies by a $600 average price and then by a 15% share. PayU takes its price from a survey of what users said they would pay ($15 a month). MySwimPro sources every buyer count to SFIA research and narrows to a 1 million-person beachhead. Check the arithmetic: CorgiAI shows 33,000 businesses × $700k a year as $21B, but that multiplication gives $23.1B. GamerzClass shows users and spend side by side without multiplying them, and Catch Commander counts buyers carefully but never gives a price, so it has no market value at all.
Market slides built bottom-up
Each example shows the exact stored slide above its analysis and links to the full teardown. Stronger examples first. Figures are quoted as shown on the slides; we checked the arithmetic but have not verified the inputs.
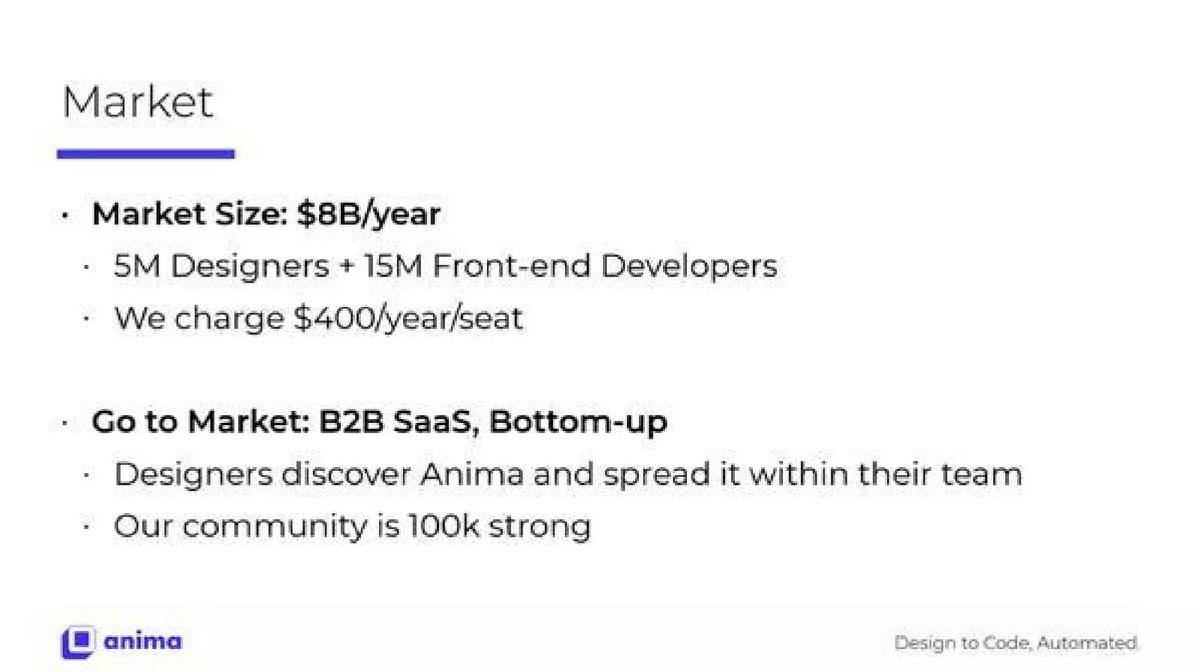
Anima market slide — slide 5
Design-to-code software. A text-only market slide with three market lines and a go-to-market note.
Anima deck, slide 5. Exact stored slide matched to this analysis.
Our analysis: The simplest complete bottom-up calculation in this set: buyers, own price, result.
Evidence and limitation: 20 million seats × $400 a year = $8 billion a year. The arithmetic matches, and the price is the company's own.
What a founder can adapt: Write your market as three lines: who buys, what you charge, the total per year.
Supporting analysis
What the deck claims: "Market Size: $8B/year." "5M Designers + 15M Front-end Developers." "We charge $400/year/seat." "Go to Market: B2B SaaS, Bottom-up."
Presentation choice: An investor can check it in seconds, and using the real seat price ties the market to the business model.
When it does not fit: No source is given for the 5M and 15M counts; add one in a footnote.
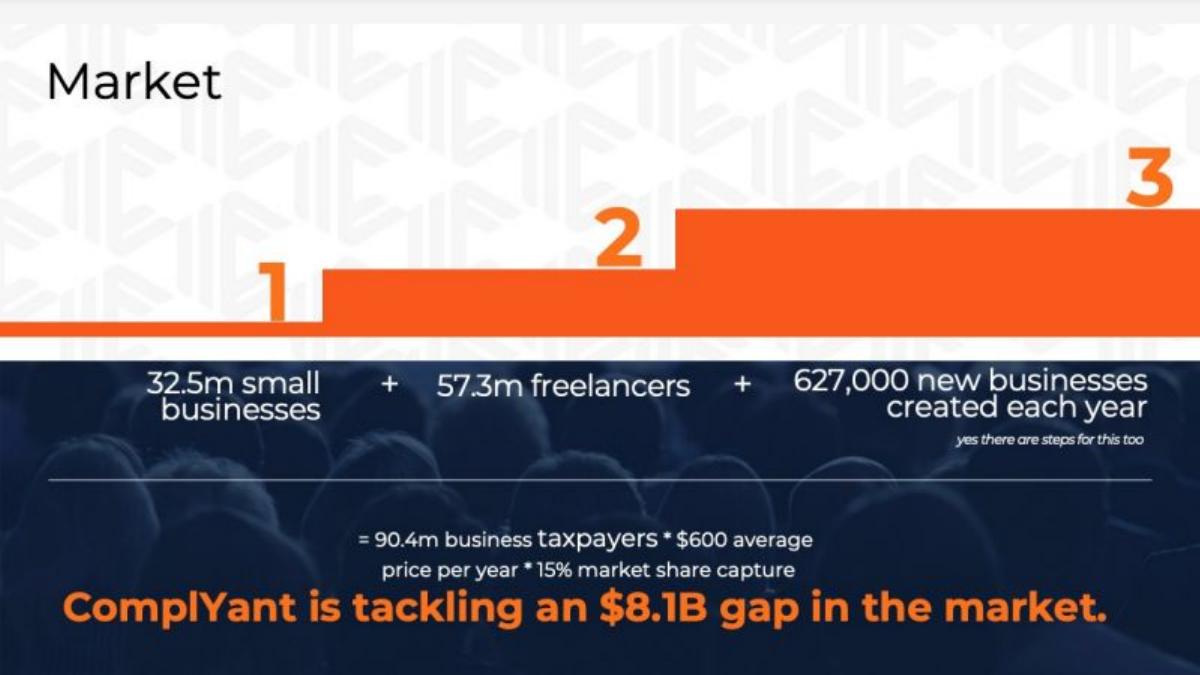
Tax compliance for small businesses. Three buyer groups added up, then multiplied by price and share.
ComplYant deck, slide 5. Exact stored slide matched to this analysis.
Our analysis: Every step is visible, including the share assumption, so an investor can argue with any single input.
Evidence and limitation: 32.5m + 57.3m + 0.627m = 90.4m. 90.4m × $600 = about $54.2B; 15% of that is about $8.1B. The arithmetic matches.
What a founder can adapt: If you have several buyer types, add them in one line before multiplying.
Supporting analysis
What the deck claims: "32.5m small businesses + 57.3m freelancers + 627,000 new businesses created each year = 90.4m business taxpayers * $600 average price per year * 15% market share capture." "ComplYant is tackling an $8.1B gap in the market."
Presentation choice: Adding named buyer groups shows the founders thought about who pays, not just how big tax software is.
When it does not fit: The $8.1B is a 15% share, not the market; call it your target and show the $54B total. Adding new businesses per year to a count of existing ones mixes a flow with a stock.
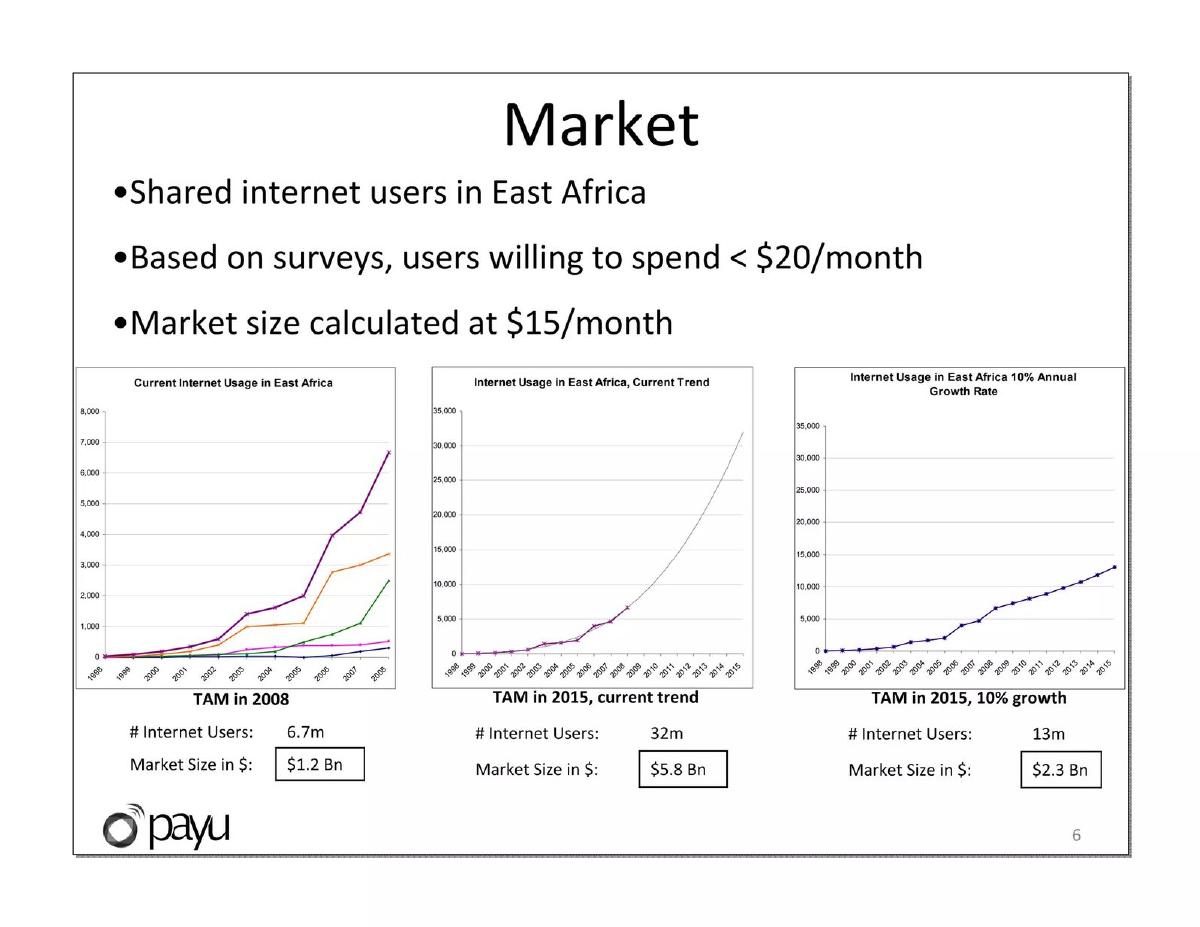
Shared internet access in East Africa. Three market sizes from three user scenarios, with a surveyed price.
PayU deck, slide 6. Exact stored slide matched to this analysis.
Our analysis: The price comes from what users said they would pay, and the company uses a figure below that ceiling.
Evidence and limitation: 6.7m × $15 × 12 = about $1.2B; 32m gives about $5.8B; 13m gives about $2.3B. The arithmetic matches for all three.
What a founder can adapt: If you haven't set your price yet, use a survey or a competitor's price, say which, and pick a conservative figure.
Supporting analysis
What the deck claims: "Based on surveys, users willing to spend < $20/month." "Market size calculated at $15/month." Charts show 6.7m users ($1.2 Bn) in 2008, 32m ($5.8 Bn) on current trend and 13m ($2.3 Bn) at 10% annual growth for 2015.
Presentation choice: A surveyed price answers the question most bottom-up slides skip: would these buyers really pay this much?
When it does not fit: Say how many people the survey covered and who ran it.
Swim training app. Three nested buyer groups, each with addressable revenue and a footnoted source.
MySwimPro deck, slide 3. Exact stored slide matched to this analysis.
Our analysis: The best-sourced buyer counts in this set, narrowed to a beachhead the company defines precisely.
Evidence and limitation: Each revenue figure is about $100 per swimmer. The counts are sourced; the $100 price is implied rather than stated.
What a founder can adapt: Narrow from everyone in the category to the group you will sell to first, and cite each count.
Supporting analysis
What the deck claims: "Total Fitness Swimmers 26.3m" → $2.6B. "Lap Swimmers 9.4m" → $940M. "Beachhead 1m" → $100M. Footnotes cite the SFIA Research Group for the first two counts and define the beachhead as lap swimmers aged 25-44 actively pursuing a fitness goal.
Presentation choice: A defined beachhead shows where the first sales come from, not just how big the category is.
When it does not fit: State the price per swimmer on the slide instead of leaving the reader to divide.
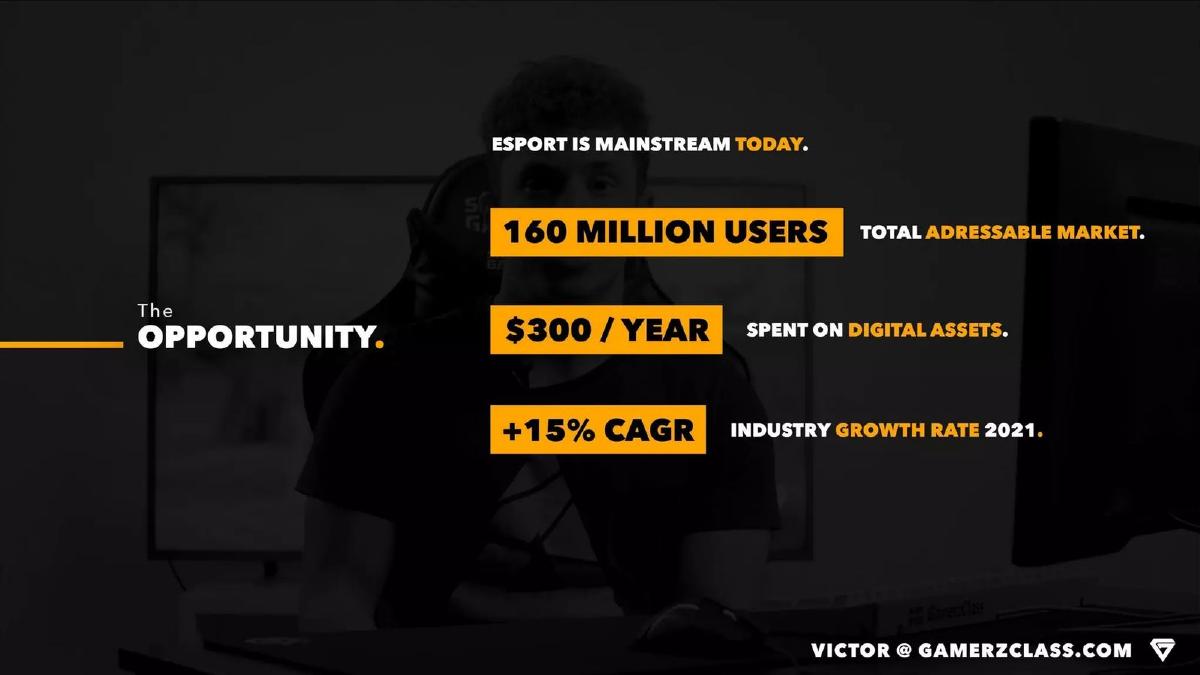
Esports coaching. Three stacked figures on a dark photo.
GamerzClass deck, slide 6. Exact stored slide matched to this analysis.
Our analysis: It looks like a bottom-up slide but stops before the calculation, and the price is not what this product sells.
Evidence and limitation: Users and spend are shown side by side, but never multiplied, and the $300 is spending on digital assets, not on coaching.
What a founder can adapt: Use the price of what you sell and do the multiplication yourself.
Supporting analysis
What the deck claims: "160 Million Users" labelled "Total Adressable Market." "$300 / Year spent on digital assets." "+15% CAGR industry growth rate 2021."
Presentation choice: Contrast: an investor can multiply 160 million × $300 to get $48B, but that describes game spending, not a coaching market.
When it does not fit: Don't label all users of a category as your addressable market.
Connected fishing scale. A bulleted market slide with nested buyer groups beside product images.
Catch Commander deck, slide 4. Exact stored slide matched to this analysis.
Our analysis: Half of a bottom-up calculation: the buyers are there, the price and the result are not.
Evidence and limitation: Careful buyer segmentation and an annual unit count, but no price anywhere on the slide.
What a founder can adapt: If you have a unit count, multiply it by your expected price and show the result.
Supporting analysis
What the deck claims: "Target Market: 46 MM anglers in the U.S." "Super Users: … 1.2 MM bass focused, super users…" "Highly Dedicated Users: … another 750,000…" "Estimated Number of Scales Sold in US: 800,000 units per year."
Presentation choice: Contrast: 800,000 units a year × a price would have been a strong, checkable market size.
When it does not fit: Don't stop at counts; without a price the investor can't tell how big the business could be.
Whether buyers, price and result are all on the slide, where the price comes from and whether the arithmetic matches.
Example
Buyers
Price
Result shown
Arithmetic
Anima
20M seats
$400/year (own price)
$8B/year
Matches
ComplYant
90.4M taxpayers
$600/year average
$8.1B (15% share)
Matches
PayU
6.7M–32M users
$15/month (survey)
$1.2B–$5.8B
Matches
MySwimPro
26.3M → 1M (sourced)
Implied ~$100
$2.6B → $100M
Matches implied price
CorgiAI
33,000 businesses
$700k/year
$21B
Gives $23.1B
GamerzClass
160M users
$300/year (games, not coaching)
None
Not multiplied
Catch Commander
46M → 750k anglers
None
None
No price
Key Takeaways
Show buyers, price and result together, so the investor can redo the sum.
Say where the price comes from: your pricing, a survey or a competitor.
Count the people who would pay, not everyone near the category.
Check that the multiplication on the slide gives the number on the slide.
Label a market-share assumption as your target, not as the market.
Build your bottom-up market size
Fill in each line, then do the multiplication and write it on the slide.
Buyer. Who pays: the specific type of customer, not the whole category.
Count. How many of them there are, and the source for that number.
Price. What each pays per year: your price, a surveyed price or a competitor's, and which.
Result. Count × price per year. Multiply it yourself and round down, not up.
First group. The smaller group you will sell to first, with its own count and result.
Copyable framework: [Count] [buyers] × [price] per year = [result] per year. First: [smaller group] × [price] = [result]. Sources: [count source]; price from [our pricing / survey of N / competitor].
Illustrative example 1 — written by us
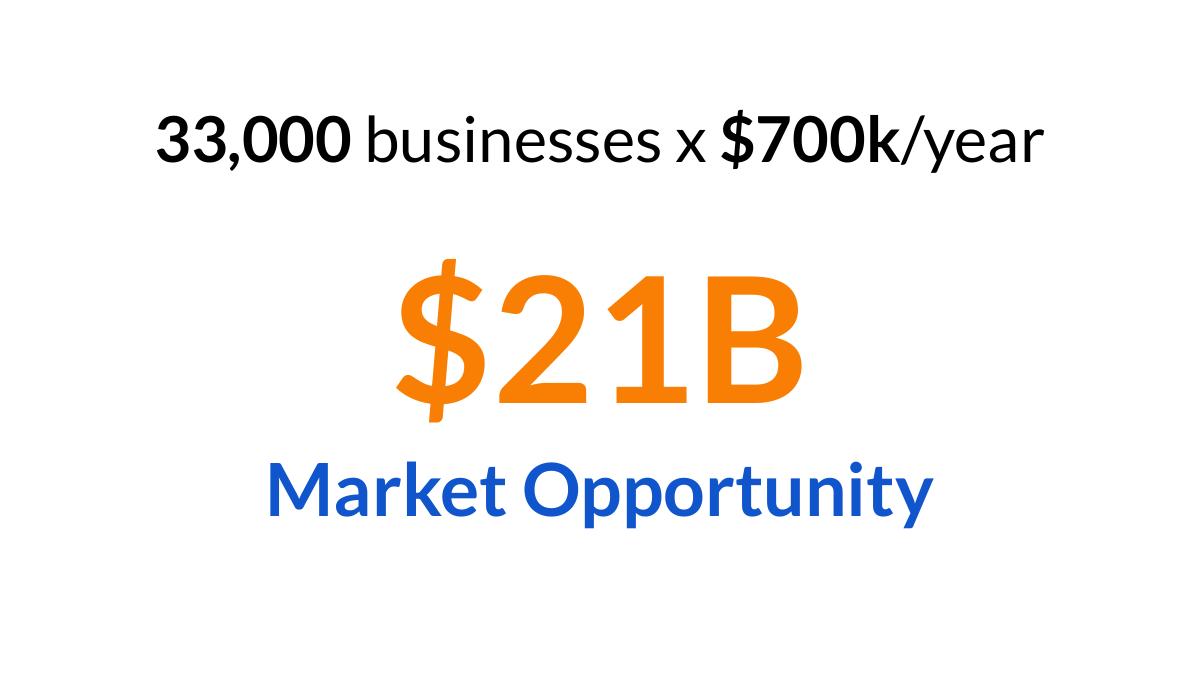
Before: 33,000 businesses x $700k/year. $21B Market Opportunity.
After: 33,000 [type of business] × $700k a year [what the spend is] = $23.1B a year. Source: [count source].
What improved: Our illustrative rewrite; not CorgiAI's wording. It corrects the result to match the inputs and names the buyer and spend.
What this guide adds
The TAM, SAM and SOM guide covers the three-ring format, and the market slides by stage guide shows how market slides change as a company grows. This page covers one method that works inside any format: building the number from buyers × price instead of quoting an industry report.
The fintech market guide mentions Esusu's bottom-up equation and the by-stage guide mentions Gaming Arts Motivator's; none of the seven slides here appears in another market guide. Anima, GamerzClass and MySwimPro appear in other guides for different lessons.
Top-down versus bottom-up
Top-down starts from a published industry total ("a $42 billion market") and takes a slice. It is fast, but the investor can't tell whether your product could ever reach that total.
Bottom-up starts from the buyers you could actually sell to and the price you would charge. It is slower, but every input can be checked and argued with, which is why investors tend to trust it more. It also forces you to decide who your customer is.
Three checks before you present
Is every input on the slide? Buyer count, price per buyer and period (per month, per year). If one is missing, the result can't be checked.
Does the arithmetic match? Multiply the numbers yourself. A mismatch, even a rounding one, is the first thing a careful investor will notice.
Would these buyers pay this price? A count of everyone near the category (all drivers, all internet users) is bigger than the number of people who would buy. Narrow it, or explain why they would all pay.
Common mistakes
Numbers that don't multiply. If buyers × price doesn't give the headline, the investor will find it.
Missing price. A count of buyers without a price is not a market size.
Everyone nearby counted. All drivers or all gamers is bigger than the group that would pay for your product.
Borrowed spend. Use the price of what you sell, not spending on something else.
Share presented as market. A 15% target is your goal; show the full market next to it.
Diagnostic checklist
Buyer, count, price and result all on the slide.
Arithmetic checked.
Source for the count.
Source for the price.
A first group you can reach.
Frequently asked questions
How we chose these examples
Corpus: published pitch deck teardowns on StartupFundraising.com. Founder-uploaded private decks are excluded.
Selection (2026-09-25): we searched stored slide text for market slides that combine a buyer count with a price or a multiplication, kept only slides with a stored slide image, then inspected each image. Eight slides qualified; HearHere was left out because its lesson overlapped with Anima and it already appears in another guide.
Anima, GamerzClass and MySwimPro also appear in other guides for different lessons; version 2 of our production rules allows reuse when the lesson is materially different.
Arithmetic: we recomputed each calculation from the figures shown on the slide. Inputs are quoted as shown; we have not verified them or the sources cited.
Review: stored slide text and images were checked on 2026-09-25 and matched to company, deck and slide number (editorial model review). No person has yet completed an editorial review of this page. We make no claim that any slide caused a fundraising outcome.