How real startups fill in TAM, SAM and SOM: customer counts behind each ring, beachhead markets, sourced percentages, and the common mistakes.
TAM, SAM and SOM Slides: Real Pitch Deck Examples
Seven market slides that use the TAM, SAM and SOM format, shown in full. The strongest say who is inside each ring and how the smallest number was worked out; the weakest leave a ring without a number or with one that doesn't fit inside the ring around it.
TL;DR
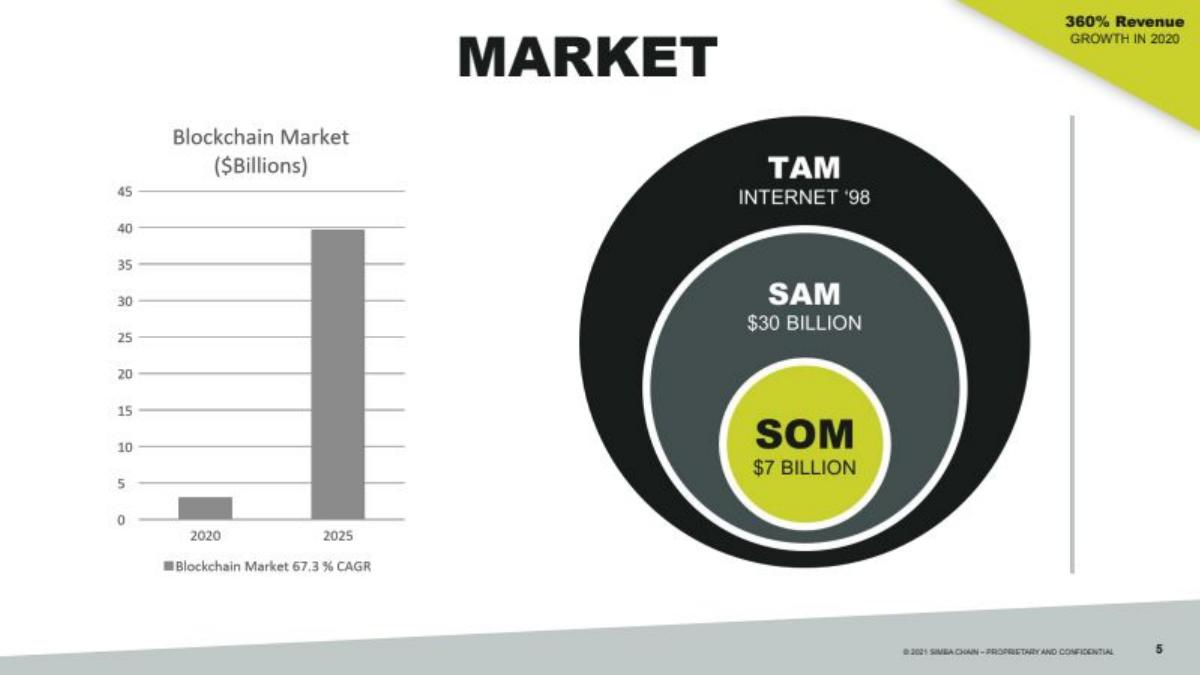
A good TAM/SAM/SOM slide says who is counted in each layer, not just how much it is worth. Docsumo defines each ring by customer type and count (100,000+ US financial service enterprises; 5,000 commercial lenders and insurers with 200+ employees; 1,000+ of those lenders). Nomuri Hostel builds all three from visitor counts with named sources and then shows how many visitors its own 200 beds can take (23,000). Everphone states SOM as a share of SAM (about 5%) and footnotes each figure. Dr. Ocean picks a beachhead (the Persian Gulf: 200 platforms, 10 devices per rig). Cheesefree shows the three layers for two countries side by side. SIMBA Chain gives no number for its TAM, and Homeroots Insights shows a SAM that is not part of its TAM; these are the weaker examples here.
TAM/SAM/SOM slides
Each example shows the exact stored slide above its analysis and links to the full teardown. Stronger examples first. Figures are as shown on the slides; we have not verified them.
Docsumo market slide — slide 4
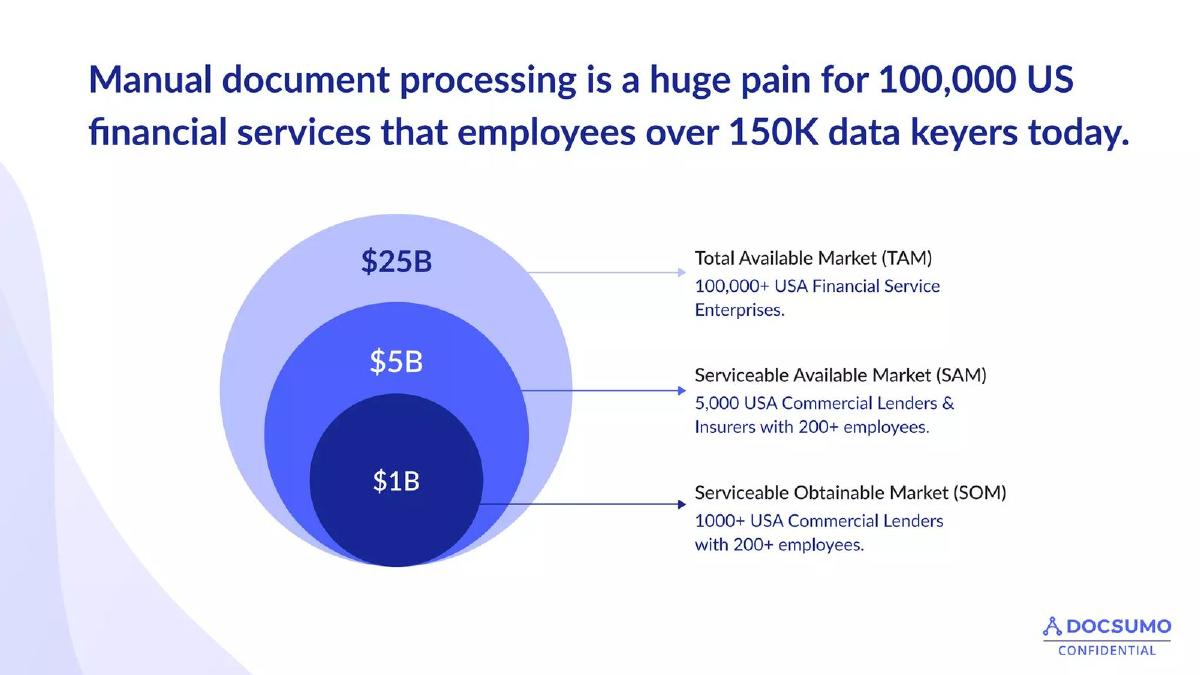
Document processing software. Nested circles with a customer definition for each.
Docsumo deck, slide 4. Exact stored slide matched to this analysis.
Our analysis: Each ring is a clearly narrower group of the same kind of customer, so an investor can see exactly who Docsumo is selling to.
Evidence and limitation: A customer count and type for every ring.
What a founder can adapt: Under each dollar figure, write how many customers and which kind.
Supporting analysis
What the deck claims: "Manual document processing is a huge pain for 100,000 US financial services that employees over 150K data keyers today." "$25B Total Available Market (TAM): 100,000+ USA Financial Service Enterprises." "$5B Serviceable Available Market (SAM): 5,000 USA Commercial Lenders & Insurers with 200+ employees." "$1B Serviceable Obtainable Market (SOM): 1000+ USA Commercial Lenders with 200+ employees."
Presentation choice: Defining rings by customer count makes the numbers checkable and shows focus.
When it does not fit: 1,000 lenders at $1B implies about $1M each a year; state the price per customer so the sum can be checked.
Lifestyle hostel in Budapest. Visitor counts with sources.
Nomuri Hostel deck, slide 6. Exact stored slide matched to this analysis.
Our analysis: The best worked example here: every ring is a narrower group of the same visitors, and the final target comes from the hostel's own capacity.
Evidence and limitation: Visitor counts for each ring, four named sources, and a capacity-based target.
What a founder can adapt: Add a fourth line: what you can actually serve in year one, and the sum behind it.
Supporting analysis
What the deck claims: "Total Addressable Market (TAM): Total number of tourists visiting Budapest in 2013, who paid for accommodation = 2 937 000 visitors." "Segmented Addressable Market (SAM): ... stayed either in hostel, 3- or 4-star hotel or AirBnB = 2 184 000 visitors." "Segmented Obtainable Market (SOM): New generation of tourists (typically between the age of 20 and 35) ... = 306 000 visitors." "NOMURI planned number of visitors** 23.000." "** 200 beds, 75% occupancy, 2.4 days and the average visit time calculated." Sources: Central Office of Statistics Hungary; Association of Hungarian Hotels and Restaurants; Skift.com; own calculations.
Presentation choice: Tying the smallest number to what the business can physically serve is the most convincing way to get to SOM.
When it does not fit: The figures are visitor counts, not money; add average spend per night to turn them into revenue.
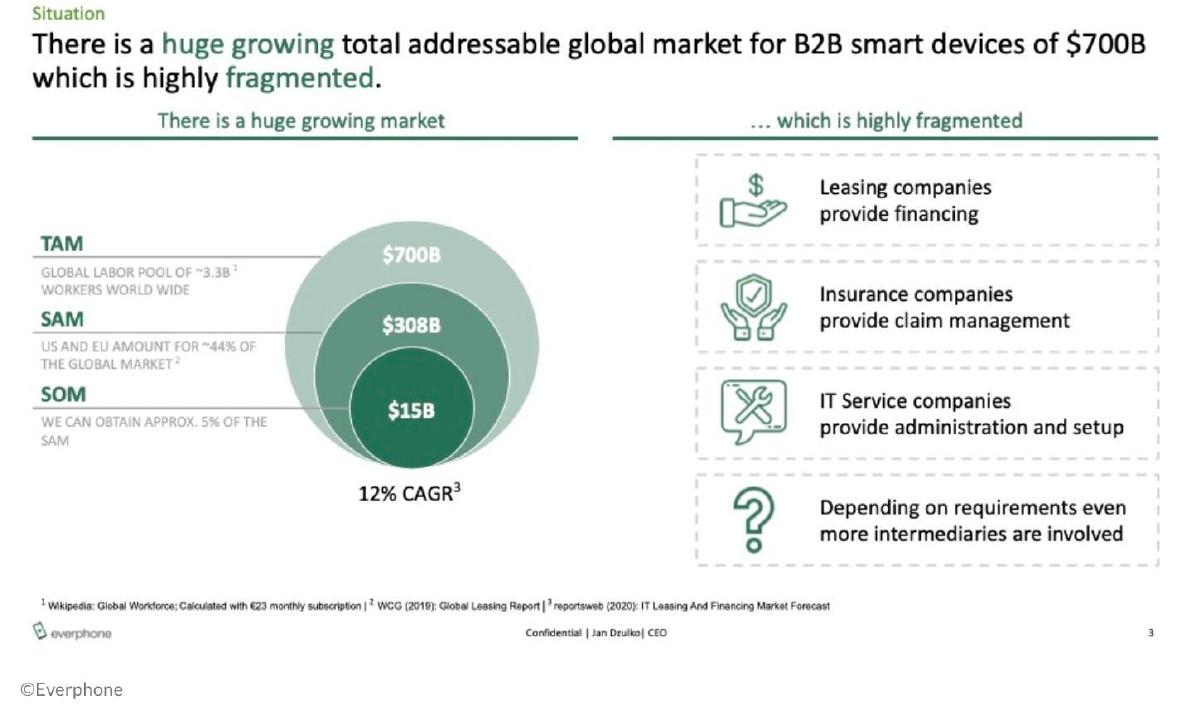
Smartphone leasing for businesses. Rings plus a panel on how fragmented the market is.
Everphone deck, slide 3. Exact stored slide matched to this analysis.
Our analysis: Shows the maths behind each ring: workers × monthly price, then a regional share, then a stated capture rate.
Evidence and limitation: Stated share for each step, a price assumption and footnoted sources.
What a founder can adapt: Write the share you used between each ring and where it comes from.
Supporting analysis
What the deck claims: "There is a huge growing total addressable global market for B2B smart devices of $700B which is highly fragmented." "TAM: Global labor pool of ~3.3B workers world wide." "SAM: US and EU amount for ~44% of the global market." "SOM: We can obtain approx. 5% of the SAM." $700B, $308B, $15B; "12% CAGR". Right panel: leasing, insurance and IT service companies, and "more intermediaries". Footnotes: Wikipedia (global workforce, calculated with €23 monthly subscription), WCG (2019) Global Leasing Report, reportsweb (2020).
Presentation choice: Stating the percentage used at each step lets an investor challenge the assumption instead of the whole number.
When it does not fit: 5% of SAM is asserted, not explained; say why 5% (sales capacity, comparable companies).
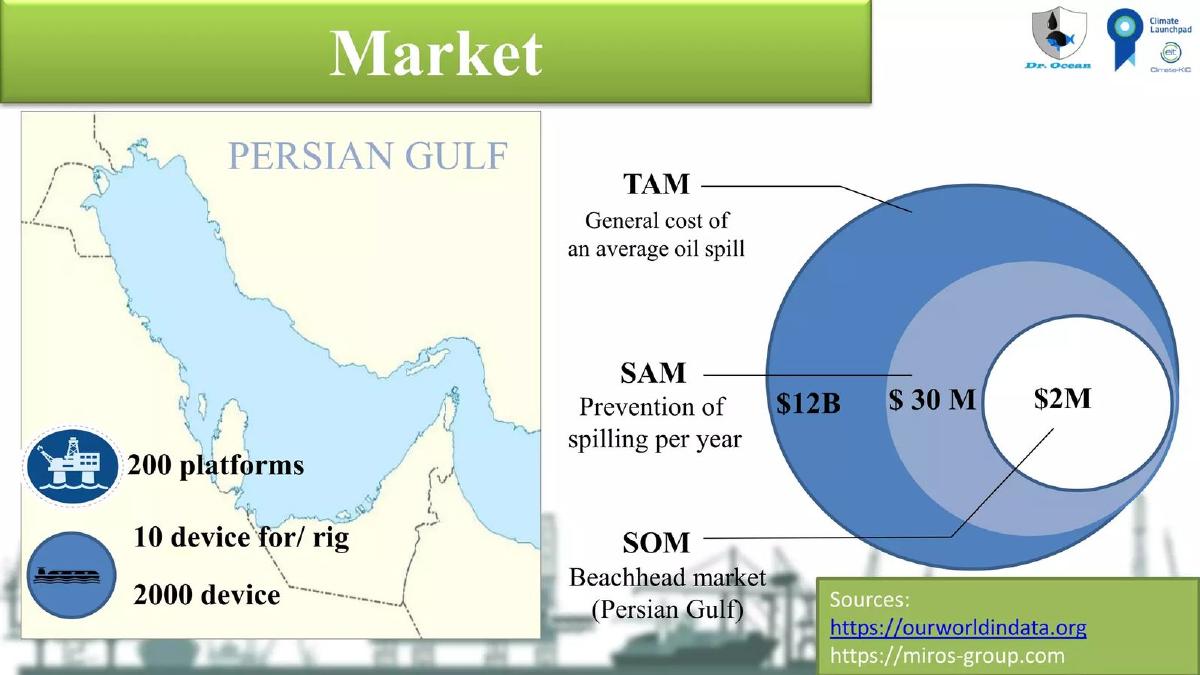
Oil-spill prevention devices. Rings plus a map of the first region.
Dr. Ocean deck, slide 3. Exact stored slide matched to this analysis.
Our analysis: The SOM is built from real units (200 platforms × 10 devices = 2,000 devices) in one region the company can start with.
Evidence and limitation: A named first region with a unit count, and two sources.
What a founder can adapt: Name your first region or segment and count the units in it.
Supporting analysis
What the deck claims: "TAM: General cost of an average oil spill" $12B. "SAM: Prevention of spilling per year" $30M. "SOM: Beachhead market (Persian Gulf)" $2M. Map: "Persian Gulf", "200 platforms", "10 device for/ rig", "2000 device". Sources: ourworldindata.org, miros-group.com.
Presentation choice: A beachhead with a device count is concrete and easy to check.
When it does not fit: The TAM is the cost of spills, not spending on prevention; size what customers would pay you.
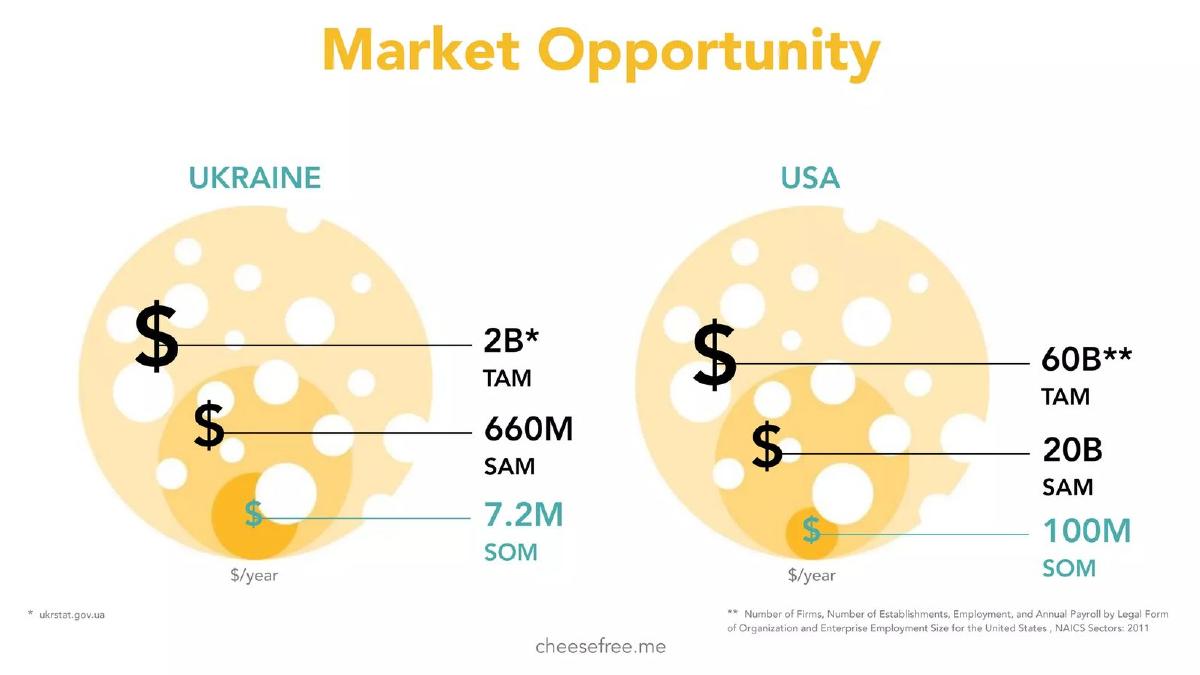
Plant-based cheese. Two sets of rings, Ukraine and USA.
Cheesefree deck, slide 5. Exact stored slide matched to this analysis.
Our analysis: Shows a small home market to start in and a much larger one to grow into.
Evidence and limitation: Three figures per country, each set footnoted.
What a founder can adapt: If you start in one market and expand to another, show both with the same three rings.
Supporting analysis
What the deck claims: "Market Opportunity." Ukraine: "2B* TAM", "660M SAM", "7.2M SOM" ($/year). USA: "60B** TAM", "20B SAM", "100M SOM" ($/year). Footnotes: "* ukrstat.gov.ua"; "** Number of Firms, Number of Establishments, Employment, and Annual Payroll by Legal Form of Organization and Enterprise Employment Size for the United States, NAICS Sectors: 2011".
Presentation choice: Side-by-side markets make the expansion plan visible on one slide.
When it does not fit: The rings aren't defined in words; say who is in each one.
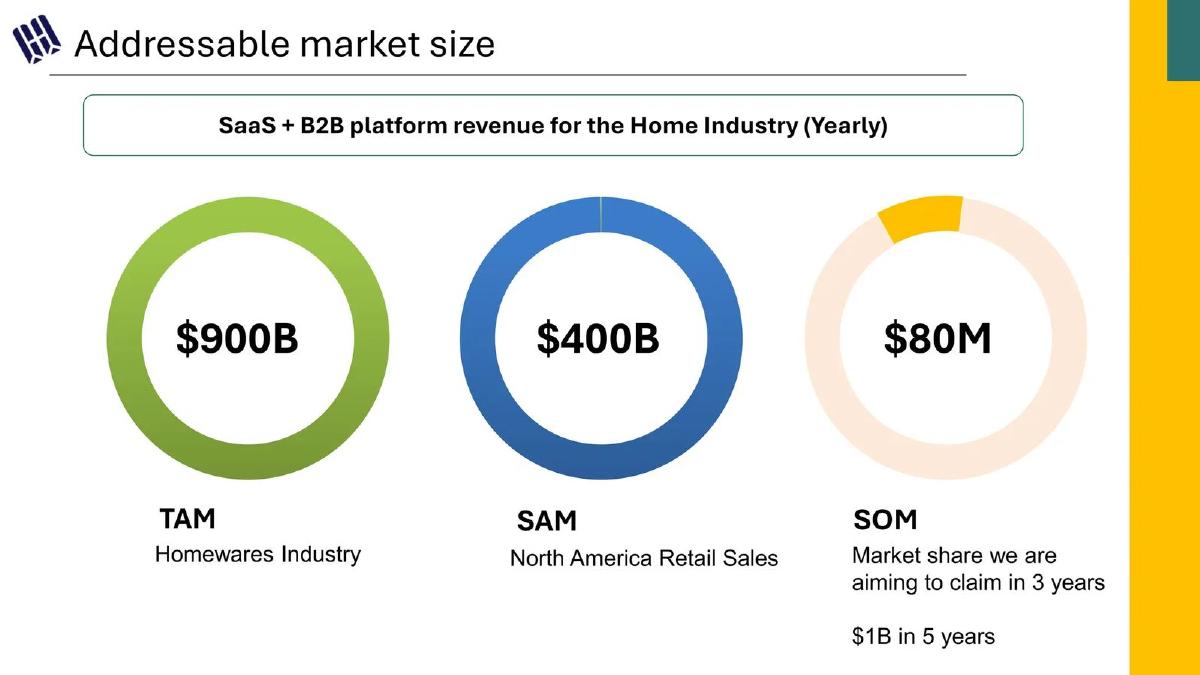
Software and B2B platform for the home goods industry. Three rings side by side.
Homeroots Insights deck, slide 5. Exact stored slide matched to this analysis.
Our analysis: A weaker example: the header says platform revenue, but TAM and SAM are total retail sales, and the SOM is a revenue goal.
Evidence and limitation: Three figures and a five-year target; no sources.
What a founder can adapt: Measure every ring the same way: what businesses would pay for your software, by region.
Supporting analysis
What the deck claims: "Addressable market size." "SaaS + B2B platform revenue for the Home Industry (Yearly)." "$900B TAM: Homewares Industry." "$400B SAM: North America Retail Sales." "$80M SOM: Market share we are aiming to claim in 3 years." "$1B in 5 years."
Presentation choice: Included for contrast: each ring measures something different, so they can't be compared.
When it does not fit: Separate circles hide that the rings should sit inside each other; add sources.
Whether each ring has a number, a definition, and a clear step down to SOM.
Example
Rings defined
Every ring has a number
SOM reasoning
Source named
Docsumo
Yes (customer counts)
Yes
Narrower customer group
No
Nomuri Hostel
Yes (visitor counts)
Yes
Capacity (200 beds)
Yes (4)
Everphone
Yes (share at each step)
Yes
Stated 5% of SAM
Yes (footnotes)
Dr. Ocean
Yes
Yes
Beachhead region, unit count
Yes (2)
Cheesefree
No
Yes
Not stated
Yes (footnotes)
SIMBA Chain
No
No (TAM is an analogy)
Not stated
No
Homeroots Insights
Partly
Yes
Revenue goal
No
Key Takeaways
Define who is in each ring, not only its dollar value.
Each ring must sit inside the one around it.
Explain how you got from SAM to SOM.
Put a number on every ring.
Name your sources on the slide.
Fill in your TAM, SAM and SOM
Use the same unit (customers × price) for every ring.
TAM. Every customer who could buy this kind of product × annual price. Source?
SAM. The ones your product and model can serve today (region, size, segment). What share of TAM?
SOM. The ones you can win in 3–5 years. Why that number: sales capacity, beachhead, comparable companies?
Check. Is each ring inside the one around it, measured the same way?
Copyable framework: TAM: [N] [customers] × [$/yr] = [$]. SAM: [N] in [region/segment] = [$]. SOM: [N] we can win by [year] because [reason] = [$]. Sources: [..].
Illustrative example 1 — written by us
Before: TAM: Internet '98. SAM: $30 billion. SOM: $7 billion.
After: TAM: [$X] global blockchain software spend ([source]). SAM: [N] [customer type] in [region] × [$/yr] = $30bn. SOM: [N] customers we can reach by [year] = [$Y].
What improved: Our illustrative rewrite; not SIMBA Chain's wording. It replaces the analogy with a figure and shows who each ring counts, with marked places for real data.
What this guide adds
The library has a market-size-by-stage guide and a fintech market guide. This page looks only at the TAM/SAM/SOM format itself, which is the most common way founders structure a market slide, and at what separates a convincing version from three circles with large numbers in them.
The seven decks cover document processing software (Docsumo), a hostel (Nomuri Hostel), business device leasing (Everphone), oil-spill prevention devices (Dr. Ocean), plant-based cheese (Cheesefree), blockchain software (SIMBA Chain) and a platform for the home goods industry (Homeroots Insights). None of these decks appears in another guide.
What the three rings mean
TAM (total addressable market): everyone who could ever buy this kind of product, anywhere.
SAM (serviceable available market): the part of the TAM your product and business model can actually serve, for example one region, customer size or segment.
SOM (serviceable obtainable market): the part of the SAM you can realistically win in the next few years, given your sales capacity and competition. Investors look hardest at this number and at how you got to it.
Common mistakes
Rings without definitions. Say who is counted in each.
Rings that don't nest. SAM must be part of TAM, SOM part of SAM.
Mixed units. Don't compare retail sales with software revenue.
SOM from nowhere. Show why that share is reachable.
Analogy instead of a number. Every ring needs a figure.
Diagnostic checklist
Each ring defined by customer type and count.
Each ring sits inside the one around it.
The same unit used for all three.
A stated reason for the SOM.
Sources on the slide.
Frequently asked questions
How we chose these examples
Corpus: published pitch deck teardowns on StartupFundraising.com. Founder-uploaded private decks are excluded.
Selection (2026-09-25): we searched stored slide text for slides that mention all three of TAM, SAM and SOM (or their full names), excluded decks already used in another guide, and kept slides with a stored image. Of 35 matches, 5 decks were already used elsewhere, 5 had no stored image and 2 were near-duplicate uploads; of the 14 remaining, we chose 7 that show different ways of building the rings. SIMBA Chain and Homeroots Insights are included as weaker examples for contrast.
Company descriptions come from the slides themselves.
Review: stored slide text and images were checked on 2026-09-25 and matched to company, deck and slide number (editorial model review). No person has yet completed an editorial review of this page.
Figures are as shown on the slides; we have not verified them. We make no claim that any slide caused a fundraising outcome.