Fintech Market Size Slides: 6 Real Pitch Deck Examples
How fintech startups size their market: payment volume charts, bottom-up credit maths, crypto and rewards markets, TAM/SAM/SOM and crowdfunding growth.
Fintech Market Size Slides: Real Pitch Deck Examples
Six market slides from fintech decks, shown in full. The strongest ones show how the number is built and where it comes from; the weakest name a huge total that the company could never reach.
TL;DR
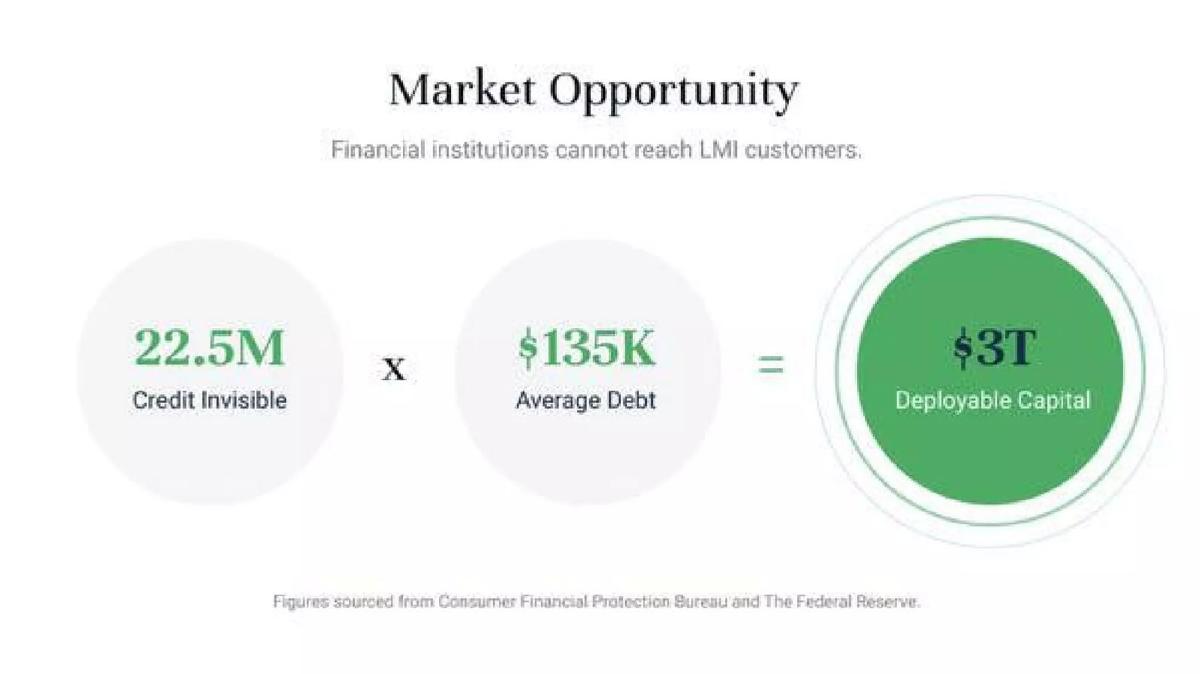
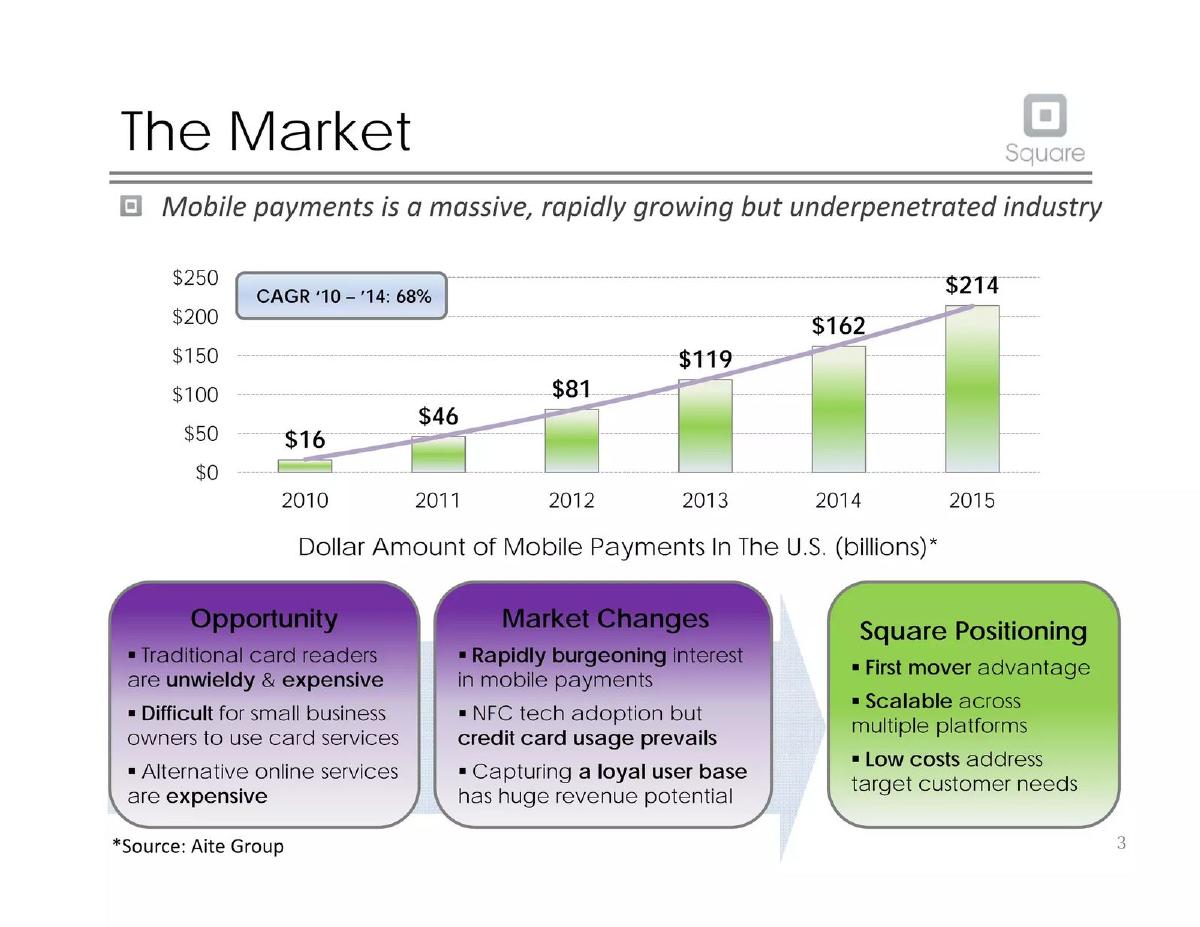
A fintech market slide should show how the number is built, from customers or transaction volume, with a source. Esusu multiplies two figures ("22.5M Credit Invisible" × "$135K Average Debt" = "$3T Deployable Capital") and names its sources (Consumer Financial Protection Bureau and the Federal Reserve). Square charts US mobile payment volume from $16bn in 2010 to $214bn in 2015 with a named source (Aite Group). Lolli sizes two markets it sells into, with sourced figures for each. Superfund labels TAM, SAM and SOM but gives numbers only for the total. Lithium and Crowd Equity Capital describe the whole crypto or crowdfunding world rather than their own customers; these are the weaker examples here.
Fintech market size slides
Each example shows the exact stored slide above its analysis and links to the full teardown. Stronger examples first. Figures are as shown on the slides; we have not verified them.
Esusu market slide — slide 2
Credit building for renters. Bottom-up equation.
Esusu deck, slide 2. Exact stored slide matched to this analysis.
Our analysis: The clearest market slide here: an investor can see and question each part of the sum.
Evidence and limitation: Two inputs, one result, two named sources.
What a founder can adapt: Write your market as [number of customers] × [value per customer] = [total], and cite each input.
Supporting analysis
What the deck claims: "Market Opportunity." "Financial institutions cannot reach LMI customers." "22.5M Credit Invisible" × "$135K Average Debt" = "$3T Deployable Capital". "Figures sourced from Consumer Financial Protection Bureau and The Federal Reserve."
Presentation choice: Bottom-up maths with a source is the format investors trust most.
When it does not fit: $3T is lendable money, not Esusu's revenue; add what share of it becomes income.
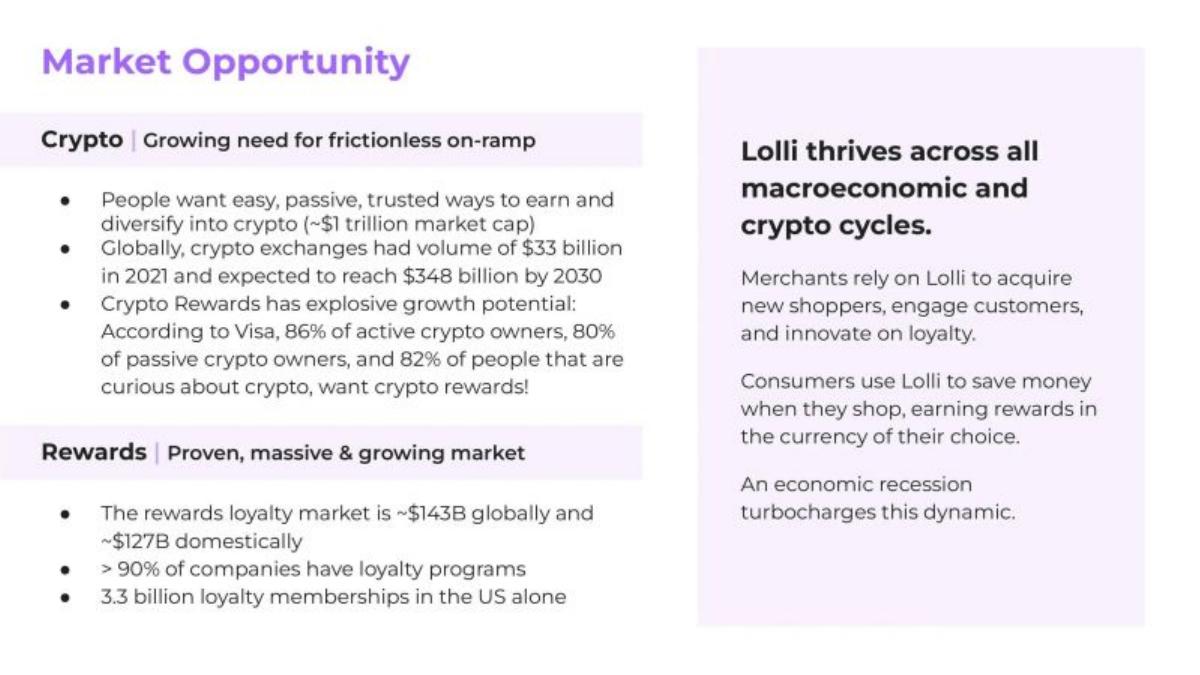
Crypto shopping rewards. Two markets plus positioning panel.
Lolli deck, slide 4. Exact stored slide matched to this analysis.
Our analysis: Sizes both markets the product sits between and shows demand for crypto rewards specifically.
Evidence and limitation: Market figures for both crypto and rewards; one named source (Visa).
What a founder can adapt: If you bridge two markets, give one number for each and one that shows the overlap.
Supporting analysis
What the deck claims: "Market Opportunity." "Crypto | Growing need for frictionless on-ramp": "crypto exchanges had volume of $33 billion in 2021 and expected to reach $348 billion by 2030"; "According to Visa, 86% of active crypto owners, 80% of passive crypto owners, and 82% of people that are curious about crypto, want crypto rewards!" "Rewards | Proven, massive & growing market": "~$143B globally and ~$127B domestically", "> 90% of companies have loyalty programs", "3.3 billion loyalty memberships in the US alone". Panel: "Lolli thrives across all macroeconomic and crypto cycles."
Presentation choice: The Visa figures connect the two markets: crypto owners want rewards.
When it does not fit: Sources for most figures are missing; the "all cycles" claim needs evidence.
Crypto investment funds. TAM/SAM/SOM labels plus pie chart.
Superfund deck, slide 5. Exact stored slide matched to this analysis.
Our analysis: Defines the three layers well in words but never puts a number on the part it can reach.
Evidence and limitation: Traditional finance totals in the chart; no numbers for SAM or SOM.
What a founder can adapt: Keep the three definitions and add a customer count and value for SAM and SOM.
Supporting analysis
What the deck claims: "Market Opportunity." "Target audience: retail crypto investors, fund managers." "TAM: global DeFi market. SAM: small to medium sized crypto investment managers and their clients. SOM: early adopters within the Boba Network ecosystem." "DeFi has only eaten a tiny fraction of tradFi's TAM so far!" Chart callout: "DeFi has only eaten .002% of TradFi's TAM... so far".
Presentation choice: Good definitions show the founder has thought about focus; missing numbers leave the key question open.
When it does not fit: Comparing to all of traditional finance makes the market look infinite, not real.
Crypto project community. Stats panel plus asset-count chart.
Lithium deck, slide 3. Exact stored slide matched to this analysis.
Our analysis: A weaker example: shows the crypto world is busy, not what Lithium's customers would pay.
Evidence and limitation: Industry activity counts; no customer or spend figure.
What a founder can adapt: Turn activity into a market: projects per year × what each would pay you.
Supporting analysis
What the deck claims: "Market Size." "10bn of capital has been raised so far in 2021 from ICO's." "In H1 CMC added 2655 New assets whilst CoinGecko added 3064 New assets over the same period. Over 10,000 applications were filed." "Between 2014-2021 there were 16,000 new assets added." "BSC and Polygon are growing / winning market share off ETH." Chart: "Roughly 16,000 Cryptocurrencies were created between 2014 and 2021".
Presentation choice: Included for contrast: counts of new tokens are not a market size.
When it does not fit: The headline says 10bn; the currency isn't stated.
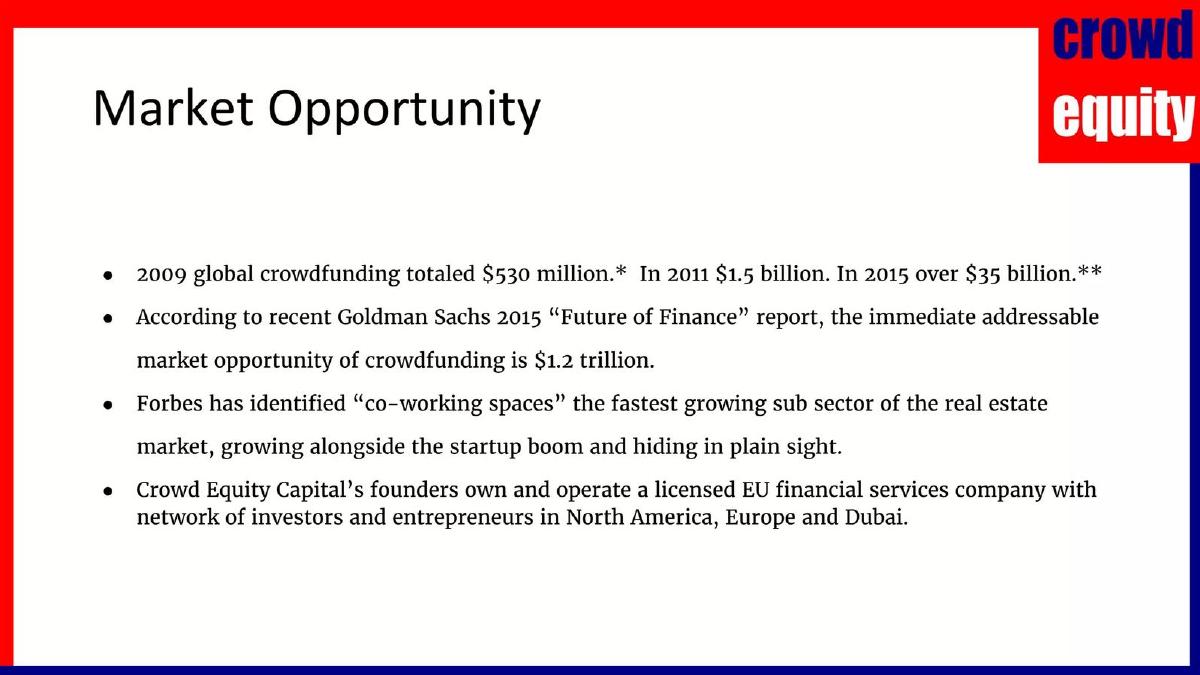
Crowd Equity Capital deck, slide 3. Exact stored slide matched to this analysis.
Our analysis: A weaker example: a sourced total, then co-working and the team, which belong elsewhere.
Evidence and limitation: Growth figures and a named report; mixed with unrelated points.
What a founder can adapt: Keep the sourced growth figures and narrow to the crowdfunding segment you serve.
Supporting analysis
What the deck claims: "Market Opportunity." "2009 global crowdfunding totaled $530 million. In 2011 $1.5 billion. In 2015 over $35 billion." "According to recent Goldman Sachs 2015 'Future of Finance' report, the immediate addressable market opportunity of crowdfunding is $1.2 trillion." "Forbes has identified 'co-working spaces' the fastest growing sub sector of the real estate market..." "Crowd Equity Capital's founders own and operate a licensed EU financial services company..."
Presentation choice: Included for contrast: mixing market, trend and team on one slide weakens each.
When it does not fit: Move the licence to the team slide and drop the co-working point.
How the market is sized and whether it narrows to reachable customers.
Example
Fintech type
Method
Source named
Narrows to reachable
Esusu
Credit building
Bottom-up
Yes (CFPB, Fed)
Partly
Square
Card payments
Volume trend
Yes (Aite Group)
Yes (US mobile payments)
Lolli
Crypto rewards
Two markets
Partly (Visa)
Partly
Superfund
Crypto funds
TAM/SAM/SOM
Chart only
In words only
Lithium
Crypto projects
Activity counts
No
No
Crowd Equity Capital
Crowdfunding
Top-down total
Yes (Goldman Sachs)
No
Key Takeaways
Show the multiplication, not just the total.
Name the source on the slide.
Size the customers you can reach, not the whole industry.
Give numbers for SAM and SOM, not just labels.
Growth over time helps if it's your segment.
Build your fintech market slide
Build the number from your customers up.
Customers. How many of the customers you serve exist, with source.
Value each. What each is worth to you per year (fees, not volume).
Reachable share. The part you can reach in 3–5 years, and why.
Growth. How fast this segment is growing, with source.
Copyable framework: [N] [customers] × [$ fees per year] = [$ market]. We can reach [share] by [year]. Sources: [..].
Illustrative example 1 — written by us
Before: Roughly 16,000 cryptocurrencies were created between 2014 and 2021.
After: [N] new crypto projects launch a year × [$X] each for [service] = [$Y] a year. [Source.]
What improved: Our illustrative rewrite; not Lithium's wording. It turns an activity count into a market size, with marked places for real figures.
What this guide adds
The library has a market-size-by-stage guide and fintech guides for problem, solution, product and traction slides. This page looks only at fintech market slides, where totals are often enormous (payments, credit, all of finance) and investors look for how the founder got from that total to a reachable number.
The six decks cover mobile payments (Square), credit for people without credit histories (Esusu), crypto rewards (Lolli), crypto investment funds (Superfund), crypto projects (Lithium) and equity crowdfunding (Crowd Equity Capital). None of these decks appears in another guide.
Three ways fintech decks size the market
Bottom-up (Esusu): number of customers × value per customer. The most convincing, because each input can be checked.
Volume trend (Square): total transaction value over several years. Strong when the segment is exactly what the company serves and the source is named.
Top-down total (Superfund, Lithium, Crowd Equity): an industry-wide figure. Weak unless the slide then narrows to the part the company can reach.
Common mistakes
Industry total only. Narrow to customers you can reach.
No source. Put it under the number.
Labels without numbers. SAM and SOM need figures.
Volume as revenue. Show your fee, not total money moved.
Mixed topics. Team and trends belong on other slides.
Diagnostic checklist
Customers × value = total, shown.
A named source for each input.
The reachable share with a reason.
Fees, not transaction volume, as the value.
Nothing unrelated on the slide.
Frequently asked questions
How we chose these examples
Corpus: published pitch deck teardowns on StartupFundraising.com. Founder-uploaded private decks are excluded.
Selection (2026-09-25): we searched stored slide text for slides headed Market, Market Size or Market Opportunity that mention payments, banks, cards, loans, credit, investing or crypto, excluded decks already used in another guide, and kept slides with a stored image. Of eight candidates checked, Bottlepay and iugu had no stored image; the remaining six are all used here. Lithium and Crowd Equity Capital are included as weaker examples for contrast.
Company descriptions come from the slides themselves.
Review: stored slide text and images were checked on 2026-09-25 and matched to company, deck and slide number (editorial model review). No person has yet completed an editorial review of this page.
Figures are as shown on the slides; we have not verified them. We make no claim that any slide caused a fundraising outcome.