Fintech Traction Slides: 7 Real Pitch Deck Examples
How fintech startups show traction: processing volume, transaction value, customers served, bank pilots and unit economics.
Fintech Traction Slides: Real Pitch Deck Examples
Seven traction and milestone slides from fintech decks (payments, supply-chain finance, lending, prepaid cards, bank infrastructure and a pre-launch finance app), shown in full. The strongest ones show money moving through the product over time; the weakest show interest and audience instead of transactions.
TL;DR
Fintech traction is money moving through your product, shown over time. Money on Mobile (Calpian) charts monthly processing volume and states "Monthly Volume Growth +210% over 12 Months". Ayekart puts transaction value on a timeline, from "Crossed GTV of INR 60 Crores" to "Crossed GTV of INR 300 CR". A-Savvy gives card accounts, interchange revenue and revenue per account by year. Sammaan Capital, a large lender, ends its history with "1.4mn+ Customers Served" and a "~US$8.2bn" balance sheet. Finteum, selling to banks, shows a pilot ("4 banks, £1.5trn balance sheet") and "discussions with 40 banks". Altum's milestones and Cent Capital's subscribers and bank talks show progress without transaction figures; they are the weaker examples here.
Fintech traction slides
Each example shows the exact stored slide above its analysis and links to the full teardown. Stronger examples first. Figures are as shown on the slides; we have not verified them.
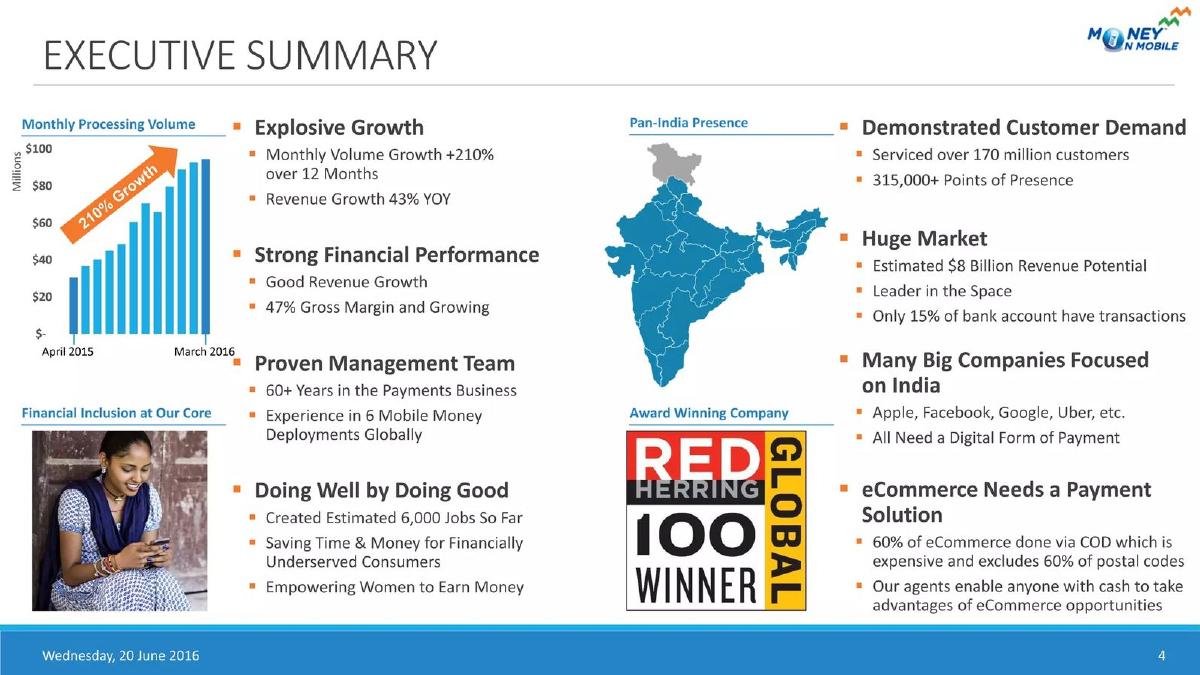
Money on Mobile (Calpian) traction slide — slide 4
Listed company, mobile payments in India. Executive summary with a volume chart.
Money on Mobile (Calpian) deck, slide 4. Exact stored slide matched to this analysis.
Our analysis: The chart does the work: an investor sees volume rising month by month before reading any text.
Evidence and limitation: Twelve months of processing volume, growth rates, gross margin and reach.
What a founder can adapt: Put your volume (or transaction value) in a monthly bar chart and the growth rate beside it.
Supporting analysis
What the deck claims: "Executive Summary." Chart: "Monthly Processing Volume", April 2015 to March 2016, labelled "210% Growth". "Explosive Growth: Monthly Volume Growth +210% over 12 Months", "Revenue Growth 43% YOY". "Strong Financial Performance: 47% Gross Margin and Growing". "Demonstrated Customer Demand: Serviced over 170 million customers", "315,000+ Points of Presence".
Presentation choice: Processing volume is the base of a payments company's revenue; showing it monthly proves the growth is steady, not one spike.
When it does not fit: Volume grew 210% but revenue 43%; explain the gap (take rate, mix) before an investor asks. Eight text blocks crowd the chart.
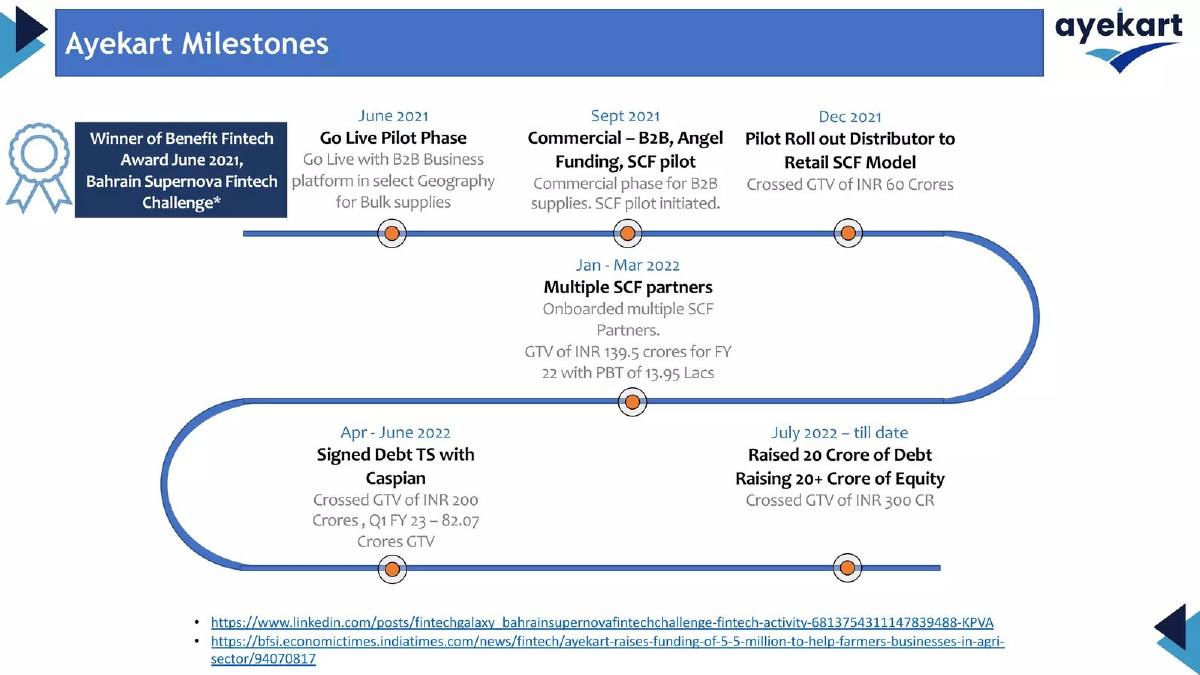
Agri supply-chain finance, India. Milestone timeline with transaction value.
Ayekart deck, slide 4. Exact stored slide matched to this analysis.
Our analysis: A timeline that carries numbers: each step adds transaction value, so progress and scale read together.
Evidence and limitation: Cumulative transaction value at each milestone, one profit figure and funding events, with source links.
What a founder can adapt: If you use a timeline, attach one money figure to every milestone.
Supporting analysis
What the deck claims: "Ayekart Milestones." "June 2021 Go Live Pilot Phase"; "Dec 2021 Pilot Roll out Distributor to Retail SCF Model. Crossed GTV of INR 60 Crores"; "Jan - Mar 2022 Multiple SCF partners... GTV of INR 139.5 crores for FY 22 with PBT of 13.95 Lacs"; "Apr - June 2022 Signed Debt TS with Caspian. Crossed GTV of INR 200 Crores, Q1 FY 23 - 82.07 Crores GTV"; "July 2022 - till date Raised 20 Crore of Debt, Raising 20+ Crore of Equity. Crossed GTV of INR 300 CR". Sources linked at the foot.
Presentation choice: Pairing each milestone with a GTV figure turns a list of events into a growth curve.
When it does not fit: Cumulative and quarterly GTV are mixed; pick one and state which. Plotting GTV as a chart would show the pace faster.
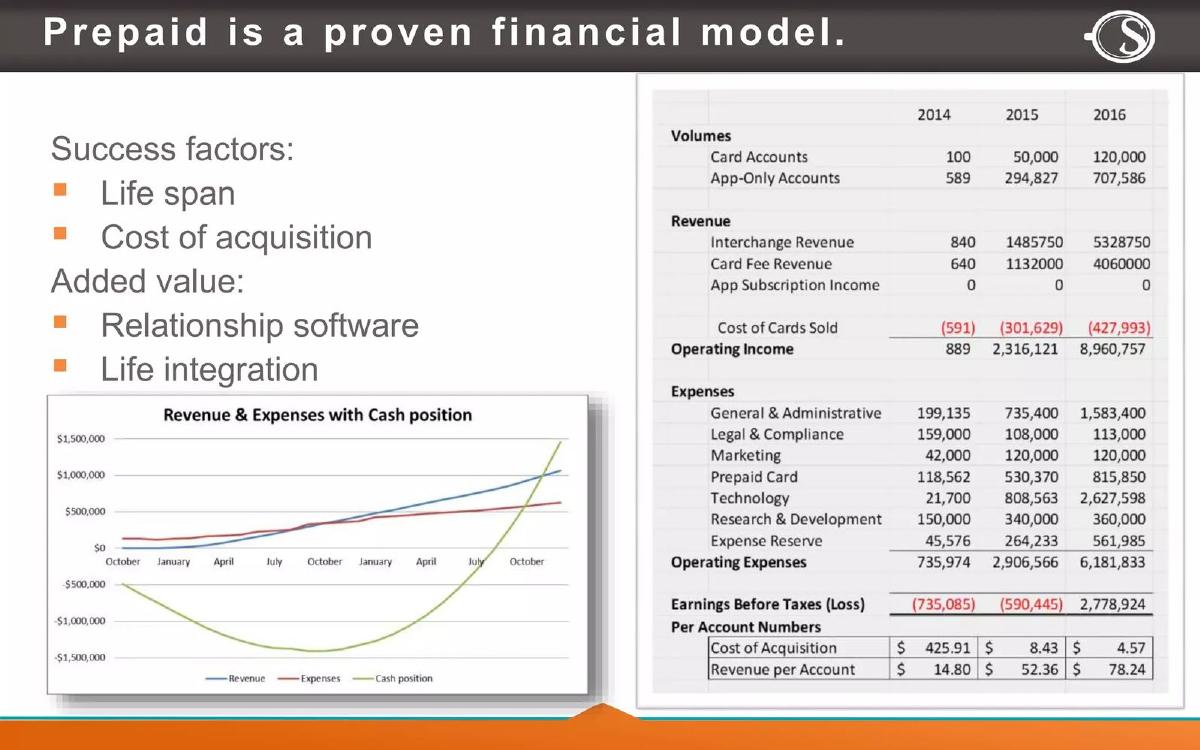
Prepaid card and app. Three-year volume and financials table.
A-Savvy deck, slide 6. Exact stored slide matched to this analysis.
Our analysis: The per-account rows are the strongest part: acquisition cost falling while revenue per account rises.
Evidence and limitation: Accounts, revenue lines and unit economics by year.
What a founder can adapt: Add one row of unit economics (revenue and cost per account or per transaction) under your volume figures.
Supporting analysis
What the deck claims: "Prepaid is a proven financial model." Table for 2014, 2015, 2016: "Card Accounts 100 / 50,000 / 120,000", "App-Only Accounts 589 / 294,827 / 707,586", "Interchange Revenue 840 / 1,485,750 / 5,328,750", "Card Fee Revenue 640 / 1,132,000 / 4,060,000", "Earnings Before Taxes (Loss) (735,085) / (590,445) / 2,778,924". "Per Account Numbers": cost of acquisition and revenue per account ($14.80 / $52.36 / $78.24). Chart: "Revenue & Expenses with Cash position".
Presentation choice: Unit economics show whether growth pays for itself, which a volume chart alone cannot.
When it does not fit: The slide doesn't say which years are actual and which are forecast; the jump from 100 to 120,000 card accounts needs that label. The table is too dense to read in a meeting.
Listed mortgage lender, India. History timeline with scale figures.
Sammaan Capital deck, slide 6. Exact stored slide matched to this analysis.
Our analysis: The four figures at the bottom carry the traction; the timeline above is context.
Evidence and limitation: Twenty-five years of events and four scale figures.
What a founder can adapt: If you have a long history, put the current scale figures first and keep the timeline short.
Supporting analysis
What the deck claims: "History and Milestones." Timeline from 2000 ("Indiabulls Financial Services Limited (IBFSL) started in 2000") to 2024-25 ("Conversion to NBFC-ICC and name change to 'Sammaan Capital Limited'"). Footer figures: "1.4mn+ Customers Served", "200+ Offices Across India", "~US$8.2bn Balance Sheet Size", "One of the Largest Mortgage-focused NBFC".
Presentation choice: For an established lender, customers served and balance sheet size answer "how big and how durable" in one line.
When it does not fit: Over twenty small text boxes; most readers will only see the footer. No growth rate is shown.
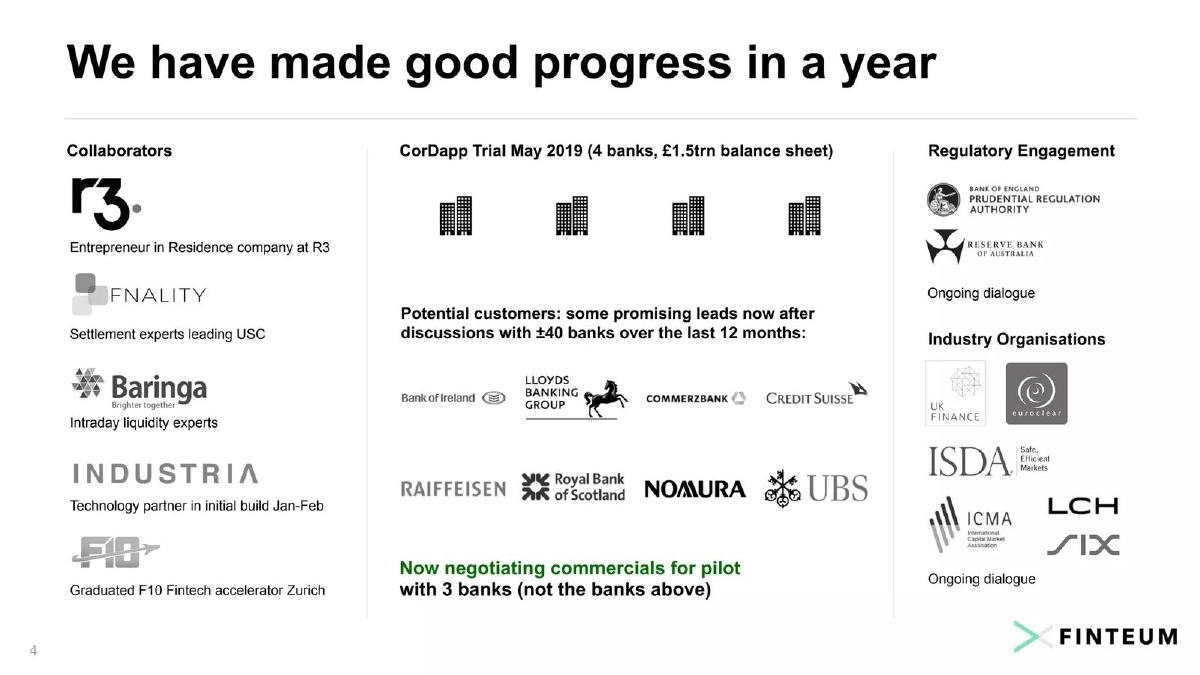
Early-stage bank settlement and liquidity infrastructure, UK. Progress slide.
Finteum deck, slide 4. Exact stored slide matched to this analysis.
Our analysis: Honest early traction for a company selling to banks: it counts trials and negotiations and says what stage each is at.
Evidence and limitation: One completed trial, 40 banks contacted, 3 in pilot negotiations; no revenue.
What a founder can adapt: For enterprise or bank customers, show the funnel with counts at each stage and the next step.
Supporting analysis
What the deck claims: "We have made good progress in a year." Collaborators: R3 ("Entrepreneur in Residence company"), Fnality, Baringa, Industria, "Graduated F10 Fintech accelerator Zurich". "CorDapp Trial May 2019 (4 banks, £1.5trn balance sheet)". "Potential customers: some promising leads now after discussions with 40 banks over the last 12 months" (bank logos). "Now negotiating commercials for pilot with 3 banks (not the banks above)". Regulatory engagement: "Prudential Regulation Authority... Ongoing dialogue".
Presentation choice: Bank sales take years; showing a funnel (40 discussions → trial → 3 pilots in negotiation) lets investors judge progress without revenue.
When it does not fit: The logos shown are leads, not customers, and the pilot banks are unnamed; the small caption saying so is easy to miss.
State development finance institution, Latvia. Six-year milestone timeline.
Altum deck, slide 6. Exact stored slide matched to this analysis.
Our analysis: A weaker example: it shows what the institution did each year but not how much it lent.
Evidence and limitation: A rating, one bond amount and events; no lending volume or customers.
What a founder can adapt: Add portfolio or lending volume to each year so the timeline doubles as a growth chart.
Supporting analysis
What the deck claims: "Key Milestones of Altum." 2017 "Rating and first bond issue" ("Moody's assigned IG rating Baa1 with a stable outlook"; "ALTUM issued EUR 20M bond"). 2018 "Guarantees exceeded loan portfolio". 2020 "Pillar role" (Covid-19 response). 2021 "3 year strategy". 2022/2023 "Engine for RRF funding". 2024 "Drive financing pace in Latvia" ("Large investment loans / lending in regions").
Presentation choice: Included for contrast: the rating and bond are credible signals, but the timeline gives no volume to judge growth.
When it does not fit: Don't let a milestone timeline stand in for traction figures.
Pre-launch AI personal finance app. Pipeline and audience proof.
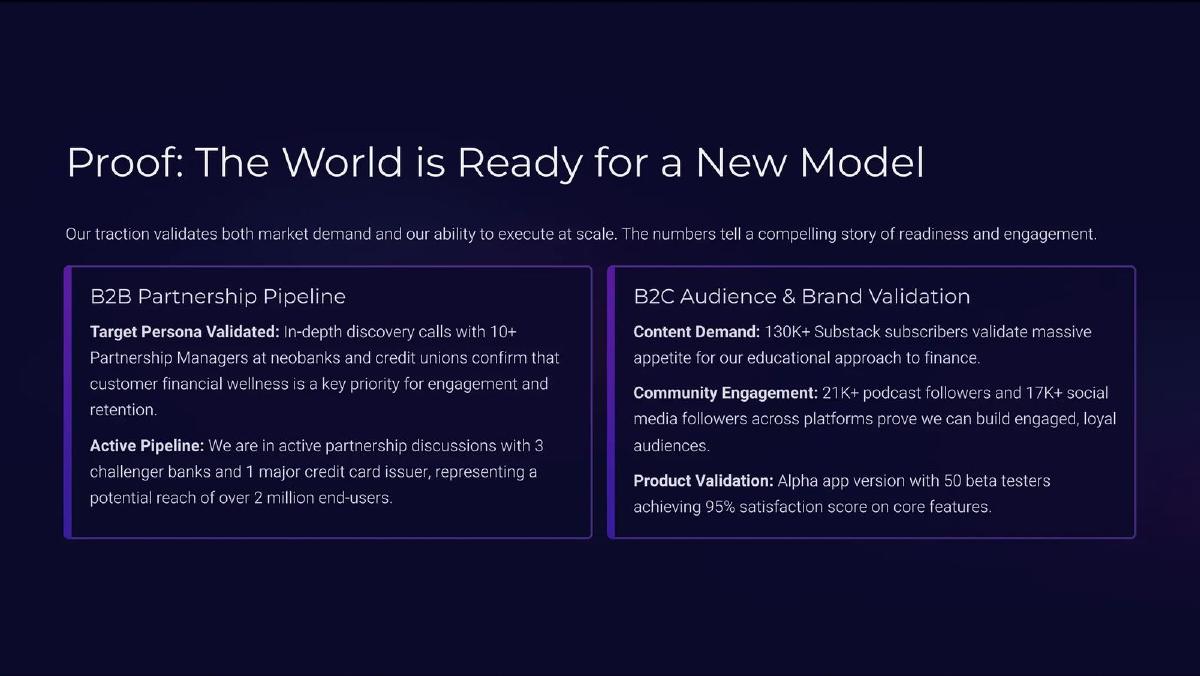
Cent Capital deck, slide 5. Exact stored slide matched to this analysis.
Our analysis: A weaker example: real audience numbers, but none of them show money moving through the product.
Evidence and limitation: Audience counts, bank discussions and a 50-person beta; no transactions or revenue.
What a founder can adapt: Pre-launch, say so, and show the one number closest to a transaction (for example beta users who linked an account).
Supporting analysis
What the deck claims: "Proof: The World is Ready for a New Model." "B2B Partnership Pipeline": "discovery calls with 10+ Partnership Managers at neobanks and credit unions"; "active partnership discussions with 3 challenger banks and 1 major credit card issuer, representing a potential reach of over 2 million end-users." "B2C Audience & Brand Validation": "130K+ Substack subscribers", "21K+ podcast followers and 17K+ social media followers", "Alpha app version with 50 beta testers achieving 95% satisfaction score".
Presentation choice: Included for contrast: "potential reach of over 2 million" describes partners' users, not Cent's.
When it does not fit: Don't present subscribers and followers as proof of demand for a financial product.
The main traction measure, whether it is shown over time, and whether a unit figure is given.
Example
Fintech type
Main measure
Over time
Unit figure
Money on Mobile
Mobile payments
Processing volume
Yes (12 months)
Gross margin
Ayekart
Supply-chain finance
Transaction value (GTV)
Yes (timeline)
No
A-Savvy
Prepaid cards
Accounts + revenue
Yes (3 years)
Yes (per account)
Sammaan Capital
Mortgage lending
Customers + balance sheet
No (current only)
No
Finteum
Bank infrastructure
Trials + banks in talks
No
No
Altum
Development finance
Rating + milestones
Events only
No
Cent Capital
Personal finance app
Audience + pipeline
No
No
Key Takeaways
Lead with volume or transaction value, charted over time.
Add one unit figure: revenue per account or take rate.
Selling to banks: count pilots and banks in talks, and name the stage.
Audience and waitlists are not transactions; label them as early signals.
Mark which years are actual and which are projections.
Build your fintech traction slide
Start from the money that moves through your product, then add one figure that shows it pays.
Volume. Money processed, lent, held or transacted, by month or quarter.
Growth. The growth rate over a stated period (for example 12 months).
Unit figure. Take rate, revenue per account, or cost of acquisition.
Stage. If pre-revenue: pilots, banks in talks, and which are signed.
Copyable framework: [Volume] in [month], up [X]% over [period]. [Revenue per account / take rate]. [Customers or accounts]. Actual to [date]; forecast marked.
Illustrative example 1 — written by us
Before: 130K+ Substack subscribers validate massive appetite for our educational approach to finance.
After: Pre-launch. [Number] of 50 beta testers linked a bank account; [number] used the app weekly. Talks with 3 challenger banks; [number] signed.
What improved: Our illustrative rewrite; not Cent Capital's wording. It labels the stage and moves from audience to actions closer to a transaction, with marked places for real figures.
What this guide adds
The library already has a general traction slide guide and traction guides for SaaS, marketplaces, consumer apps, retail and by stage. This page looks only at fintech decks, where traction is usually measured as money processed, lent or held, not users or subscriptions.
The seven decks span mobile payments in India (Money on Mobile, under its Calpian listing), agri supply-chain finance (Ayekart), prepaid cards (A-Savvy), mortgage lending (Sammaan Capital), a state development finance institution (Altum), bank settlement infrastructure (Finteum) and a pre-launch personal finance app (Cent Capital). None of these decks appears in another guide.
Three kinds of fintech traction
Money through the product (Money on Mobile, Ayekart, A-Savvy): processing volume, transaction value or card revenue over time. This is what fintech investors look for first, because revenue is usually a share of it.
Scale and history (Sammaan Capital, Altum): customers served, balance sheet, ratings and years of milestones. Common for established lenders and institutions; persuasive when the figures are on the slide, weaker when the timeline only lists events.
Early signals (Finteum, Cent Capital): pilots, banks in talks, subscribers and beta testers. Honest for pre-revenue companies if labelled as such; Finteum's bank pilot is closer to a transaction than Cent Capital's audience numbers.
Common mistakes
Audience instead of transactions. Show money moved, not followers.
Timeline without figures. Attach a volume figure to each milestone.
Forecast mixed with actuals. Mark which years are projections.
Volume and revenue gap unexplained. State the take rate.
Leads shown as customers. Label logos as pilots, talks or customers.
Diagnostic checklist
One volume measure, charted over time.
Growth rate with its period.
One unit figure (take rate or per account).
Actual and forecast clearly marked.
Customer logos labelled by stage.
Frequently asked questions
How we chose these examples
Corpus: published pitch deck teardowns on StartupFundraising.com. Founder-uploaded private decks are excluded.
Selection (2026-09-25): we searched stored slide text for slides headed traction, milestones or progress (or presenting growth figures) in decks about payments, lending, banking, cards or finance. We excluded decks already used in another guide (including 1inch, Airbase, AFEX and Anfin) and candidates without a stored slide image (Hoard, FTF, Air Payments), leaving seven, all used here. Altum and Cent Capital are included as weaker examples for contrast.
Company and sector descriptions come from the slides themselves. The Money on Mobile slide is filed under its parent's listing (Calpian); the Altum deck is filed under a generic teardown address.
Review: stored slide text and images were checked on 2026-09-25 and matched to company, deck and slide number (editorial model review). No person has yet completed an editorial review of this page.
Figures are as shown on the slides; we have not verified them. We make no claim that any slide caused a fundraising outcome.