What a traction slide shows at seed versus Series A: early revenue and user growth, then ARR trajectory, retention and repeatability.
Seed vs Series A Traction Slides: Real Pitch Deck Examples
Four traction slides from seed decks and four from Series A decks, shown in full, compare what each stage leads with: proof that people pay at seed, and proof that growth is fast, retained and repeatable at Series A.
TL;DR
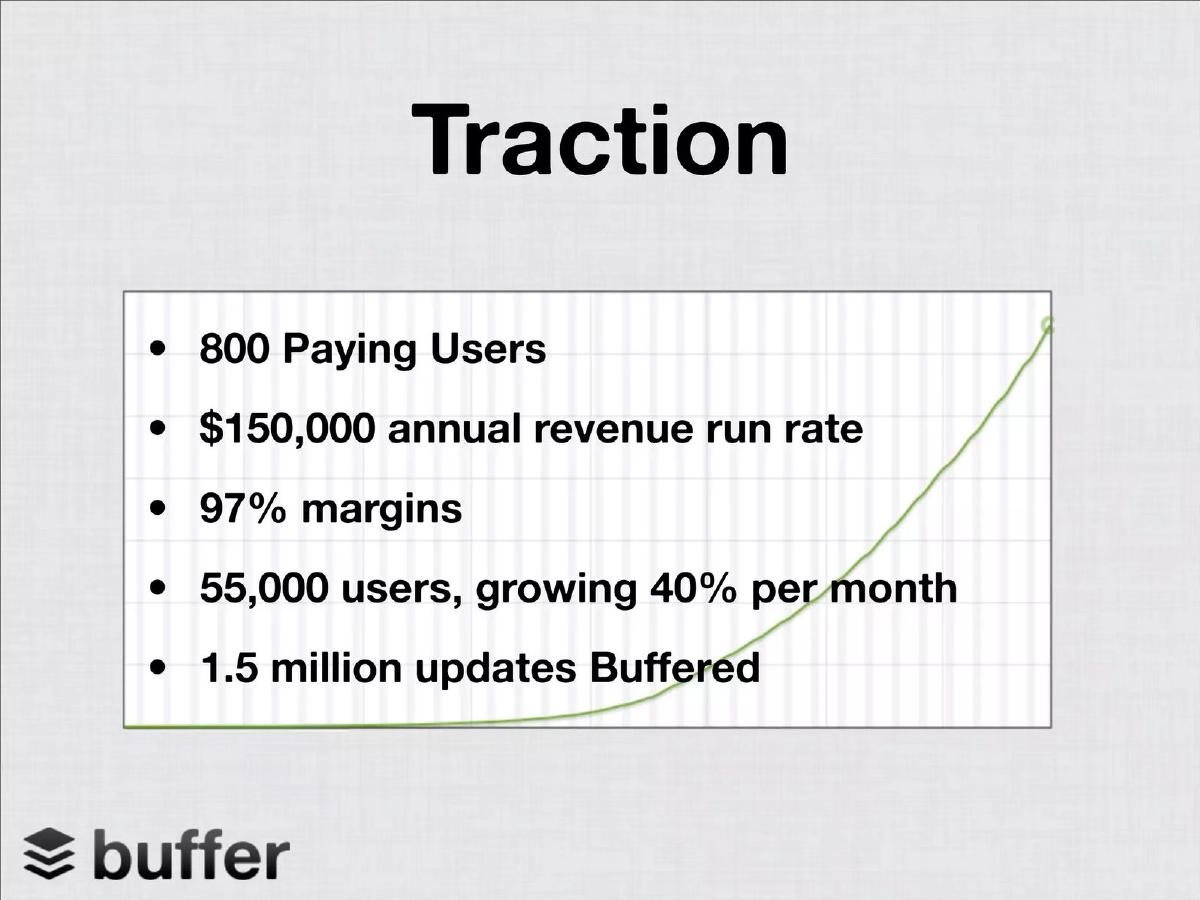
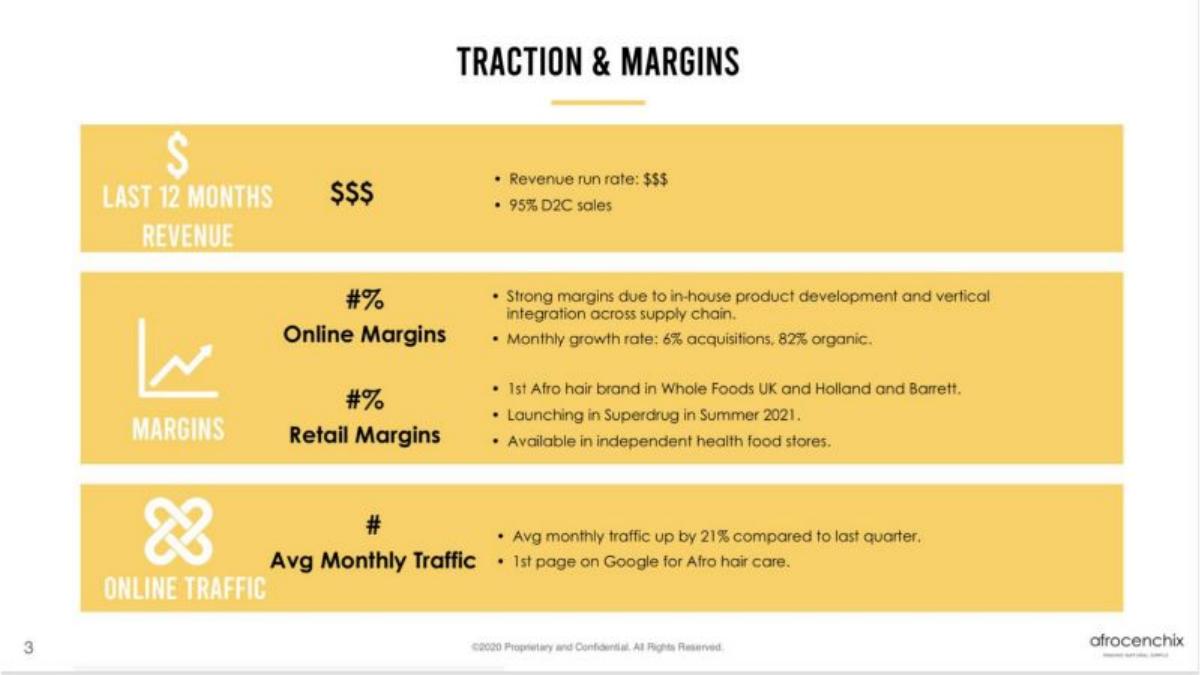
At seed, a traction slide proves that people pay and that usage is growing; at Series A, it proves that revenue grows on a trajectory and that customers stay. Buffer's seed slide lists "800 Paying Users", a "$150,000 annual revenue run rate" and "55,000 users, growing 40% per month". Contractbook's Series A slide leads with "Our ARR has grown nearly 4x year-over-year", then "+300% YoY Revenue Growth" and "110% Net Dollar Retention". Lula adds "CMGR 31.13%" and a "Retention Rate 95%+". Afrocenchix's seed slide keeps placeholders ("$$$", "#%") where the numbers should be, the weaker pattern.
Seed and Series A traction slides from real pitch decks
Each example shows the exact stored slide above its analysis and links to the full teardown. Seed examples come first, then Series A. Claims are as shown on the slides; we have not verified them.
Buffer traction slide — slide 5
Seed. Social media scheduling. Five bullets over a rising line.
Buffer deck, slide 5. Exact stored slide matched to this analysis.
Our analysis: The strongest seed example here: it separates paying users from all users and gives a monthly growth rate.
Evidence and limitation: Five figures: paying users, run rate, margin, users with growth rate, usage.
What a founder can adapt: Put paying customers and revenue run rate in the first two lines.
Supporting analysis
What the deck claims: "Traction." "800 Paying Users", "$150,000 annual revenue run rate", "97% margins", "55,000 users, growing 40% per month", "1.5 million updates Buffered".
Presentation choice: Paying users first answers the seed question: will people pay?
When it does not fit: The background line has no axis or dates; label it or drop it.
Seed. Natural hair care brand. Three yellow bands for revenue, margins and traffic.
Afrocenchix deck, slide 4. Exact stored slide matched to this analysis.
Our analysis: Weak on purpose: the most important numbers are placeholders in the published version.
Evidence and limitation: Placeholders for revenue and margins; some real figures (95%, 21%) and retail listings.
What a founder can adapt: If a figure is confidential, remove the row and lead with what you can show, such as named retailers.
Supporting analysis
What the deck claims: "Traction & Margins." "Last 12 months revenue: $$$"; "Revenue run rate: $$$"; "95% D2C sales"; "#% Online Margins", "#% Retail Margins"; "Monthly growth rate: 6% acquisitions, 82% organic"; "1st Afro hair brand in Whole Foods UK and Holland and Barrett"; "Avg monthly traffic up by 21% compared to last quarter".
Presentation choice: Kept as a contrast. The retail listings are strong evidence, buried under empty figures.
When it does not fit: Placeholders such as "$$$" or "#%" on any version an investor may see.
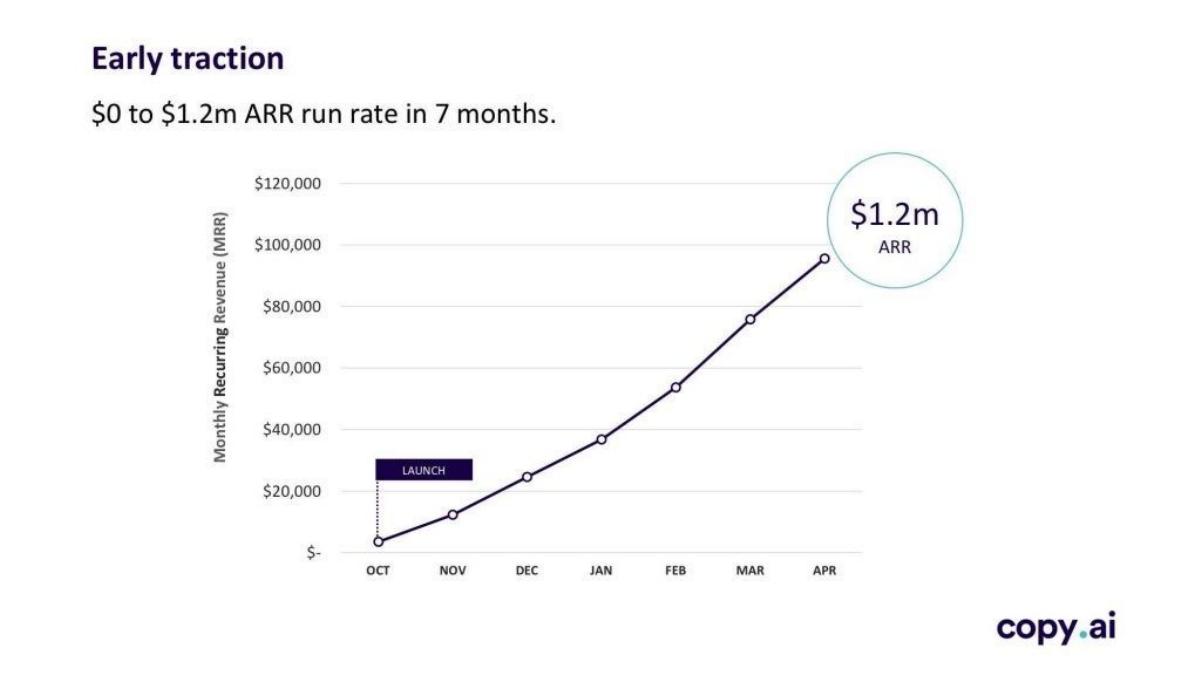
Series A. AI writing tool. One monthly revenue chart.
Copy.ai deck, slide 4. Exact stored slide matched to this analysis.
Our analysis: One message and one chart: the pace from launch to $1.2M ARR.
Evidence and limitation: One headline figure, a time frame and a dated chart.
What a founder can adapt: Write your headline as "from X to Y in Z months" and chart it.
Supporting analysis
What the deck claims: "Early traction." "$0 to $1.2m ARR run rate in 7 months." Line chart of monthly recurring revenue from launch in October to April, ending at "$1.2m ARR".
Presentation choice: The headline states the result; the chart proves it month by month.
When it does not fit: A single metric; a Series A investor will also ask about retention.
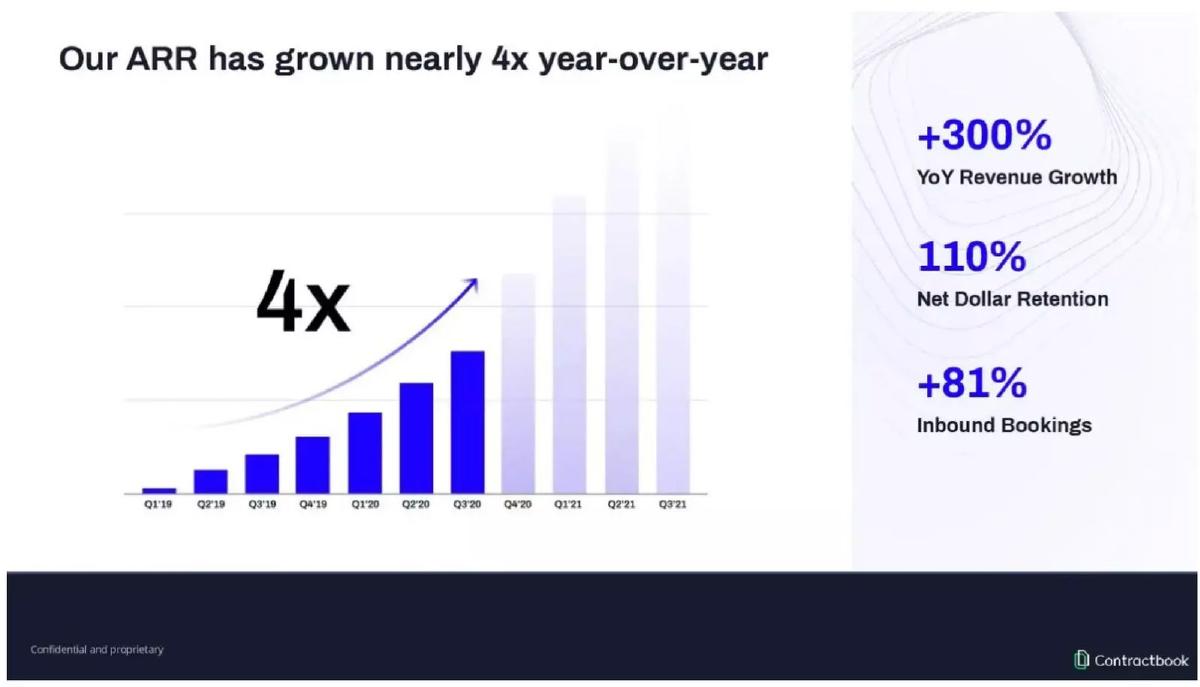
Series A. Contract management software. Quarterly ARR bars and three side figures.
Contractbook deck, slide 6. Exact stored slide matched to this analysis.
Our analysis: The strongest Series A example here: growth, retention and pipeline on one slide.
Evidence and limitation: ARR trend, growth rate, retention and a demand signal.
What a founder can adapt: Pair your growth chart with one retention figure.
Supporting analysis
What the deck claims: "Our ARR has grown nearly 4x year-over-year." Quarterly bars Q1'19 to Q3'21 (later quarters shaded). "+300% YoY Revenue Growth", "110% Net Dollar Retention", "+81% Inbound Bookings".
Presentation choice: 110% net dollar retention shows existing customers spend more over time, the core Series A question.
When it does not fit: Shaded future quarters beside actuals; label them as forecast.
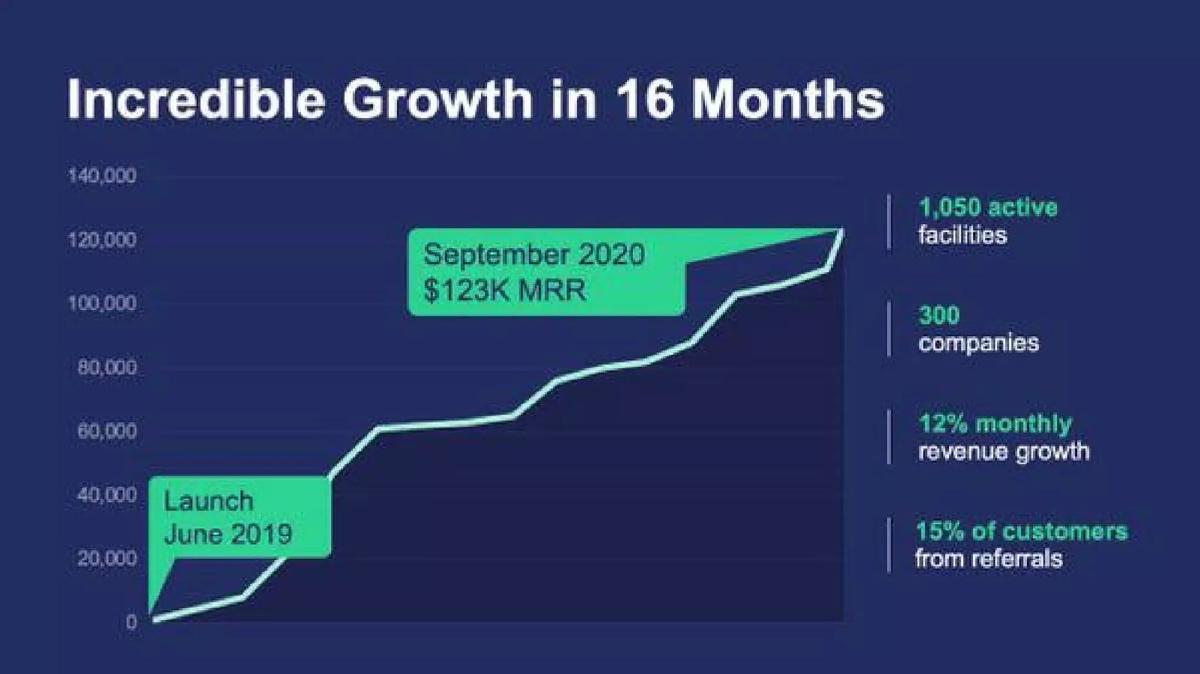
What a founder can adapt: Mark launch and today's figure directly on the chart.
Supporting analysis
What the deck claims: "Incredible Growth in 16 Months." Chart from "Launch June 2019" to "September 2020 $123K MRR". "1,050 active facilities", "300 companies", "12% monthly revenue growth", "15% of customers from referrals".
Presentation choice: The referral share hints at low acquisition cost without needing a separate slide.
When it does not fit: "Incredible" adds nothing; the numbers make the case.
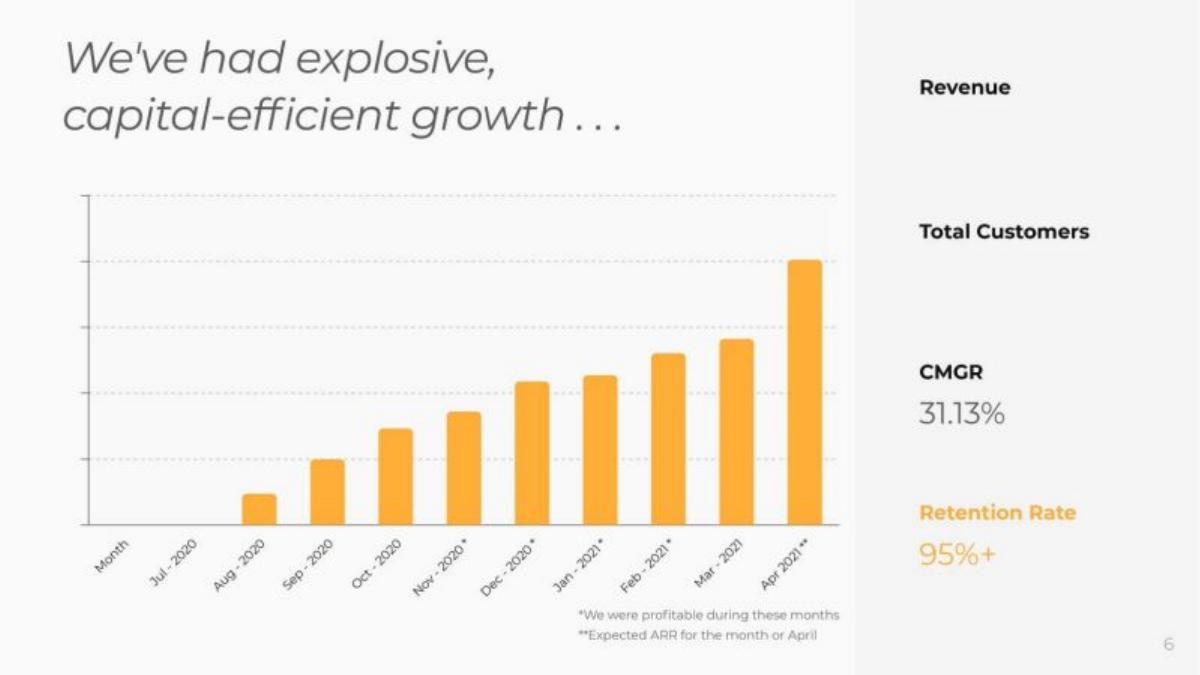
Series A. Usage-based vehicle insurance. Monthly bars and side labels.
Lula deck, slide 5. Exact stored slide matched to this analysis.
Our analysis: Partial: the rate and retention are strong, but the chart has no axis values and the revenue and customer labels have no numbers.
Evidence and limitation: Monthly growth rate, retention and a profitability note; revenue and customer figures are not shown.
What a founder can adapt: Put the latest revenue figure on the final bar.
Supporting analysis
What the deck claims: "We've had explosive, capital-efficient growth..." Monthly bars Jul 2020 to Apr 2021. Labels: "Revenue", "Total Customers", "CMGR 31.13%", "Retention Rate 95%+". Footnotes: "We were profitable during these months"; "Expected ARR for the month of April".
Presentation choice: Kept to show retention and profitability on a Series A slide.
When it does not fit: A projected month in the chart without a clear marker.
After: $310K revenue in the last 12 months, growing 6% a month; stocked in 2 national retail chains.
What improved: Our illustrative rewrite; the figures are invented for the example. It replaces the placeholder with a figure, a rate and named proof.
What this guide adds
The library's traction guides are organised by business type (SaaS, marketplace, consumer app, retail) and one covers pre-revenue startups. This guide is the first organised by funding stage: it compares what seed and Series A decks put on the same slide.
Stage labels come from the stage recorded for each published teardown (all eight are high-confidence labels). None of these eight slides appears in another guide; Canix and Lula appear elsewhere with different slides, and Buffer's milestones slide (6) is in the roadmap guide, not its traction slide (5).
What changes between seed and Series A
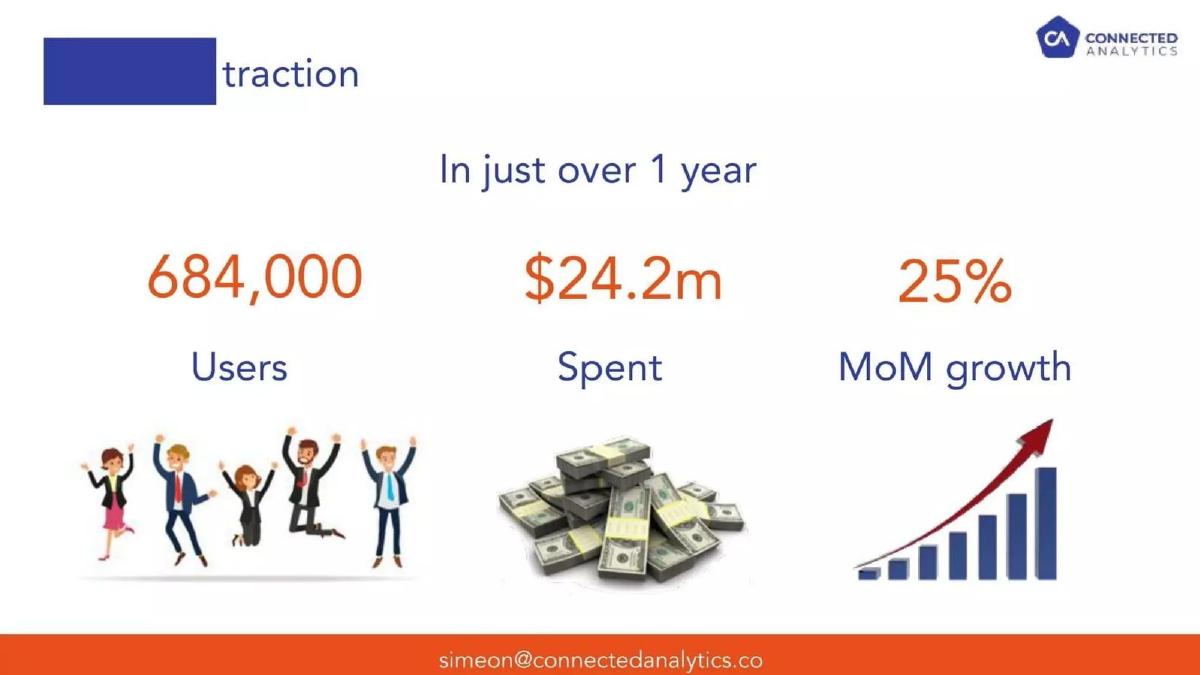
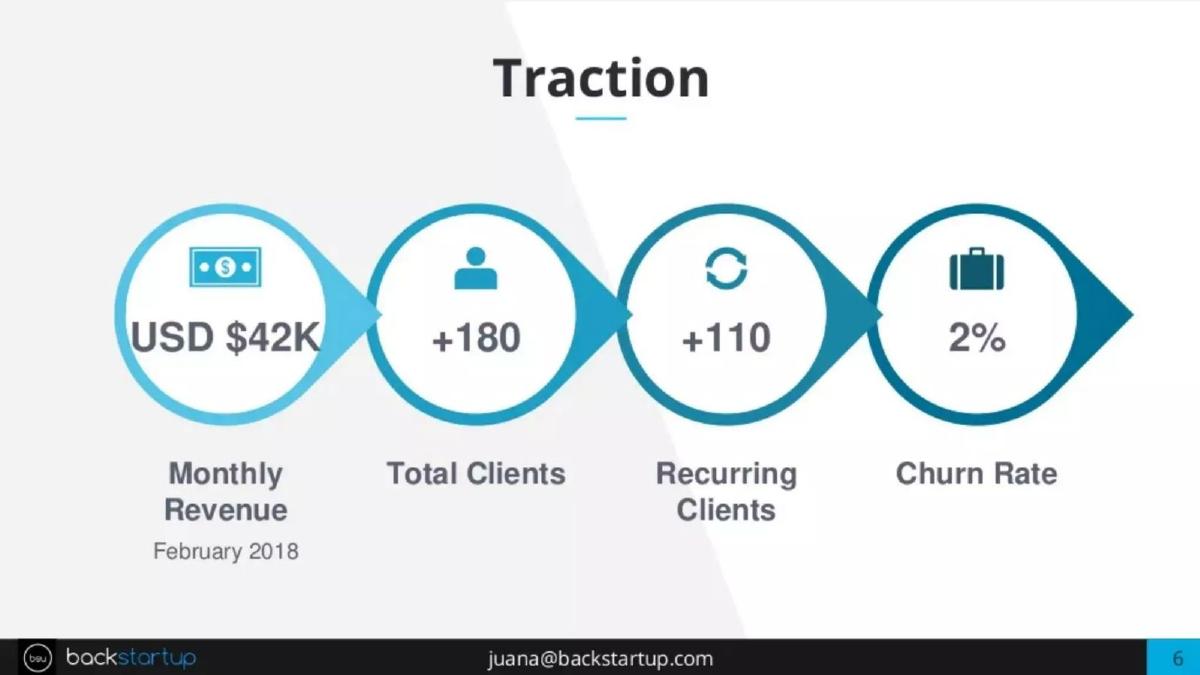
Seed slides count: paying users (Buffer "800"), clients (Backstartup "+180"), users and spend (ThankUCash "684,000", "$24.2m"). Growth appears as a single rate: "40% per month", "25% MoM growth".
Series A slides chart: revenue over dated months or quarters (Copy.ai Oct–Apr, Contractbook Q1'19–Q3'21, Canix June 2019–September 2020, Lula Jul 2020–Apr 2021). They add quality measures: net dollar retention (Contractbook "110%"), retention (Lula "95%+"), referrals (Canix "15% of customers from referrals").
Both stages benefit from a stated time frame. Series A slides show it on the axis; seed slides need it in the headline or a label.
Common mistakes
Placeholders left in. Remove the row instead.
Totals with no time frame. Say over what period.
Chart with no axis values. Label the latest figure.
Forecast mixed with actuals. Mark projected months.
Series A slide with no retention. Add one retention figure.
Diagnostic checklist
The lead figure fits the stage.
Growth has a time frame.
Charts have dates and a labelled latest figure.
Series A: one retention or repeat figure.
No placeholders.
Frequently asked questions
How we chose these examples
Corpus: published pitch deck teardowns on StartupFundraising.com. Founder-uploaded private decks are excluded.
Selection (2026-09-25): we took teardowns whose recorded stage is seed or Series A with high confidence, then searched slides for traction, growth or milestone headings with revenue, customer or retention figures. Slides already used in another guide (for example Spinach slide 6 in the traction guide, Careerist slide 6 in the financials guide, Forethought slide 6 in the pre-revenue guide) were excluded. Kangarooo slide 8 was left out because its stored image is missing. Lula is marked partial; Afrocenchix is kept as a weaker contrast.
Stage is the round recorded for each teardown, not a judgment about the company today.
Review: all eight stored slide images were inspected on 2026-09-25 and matched to company, deck and slide number (editorial model review). No person has yet completed an editorial review of this page.
Claims are as shown on the slides; we have not verified them. We make no claim that any slide caused a fundraising outcome.