Which metrics software startups put on the traction slide: ARR history, retention, engagement, sales efficiency and customer logos.
SaaS Traction Slides: Real Pitch Deck Examples
Six traction and summary slides from software companies, shown in full, compare which recurring-revenue metrics founders choose to lead with, and what investors can and cannot check from each.
TL;DR
A SaaS traction slide should show recurring revenue over time, plus one number that proves the revenue stays and grows: retention, expansion or usage. The strongest examples below give dated ARR at more than one point (airSlate) or pair ARR with net and gross retention (Apollo). Logos, awards and engagement ratios support the case but don't replace revenue quality. Several public versions redact the figures, so read them for structure, not numbers.
SaaS traction slides from real pitch decks
Each example shows the exact stored slide above its analysis and links to the full teardown. Figures are the companies' own and have not been verified. Where the public version of a deck redacts numbers (shown as XX or blacked out), we discuss the structure, not the values. Stage and year come from the slide itself where stated.
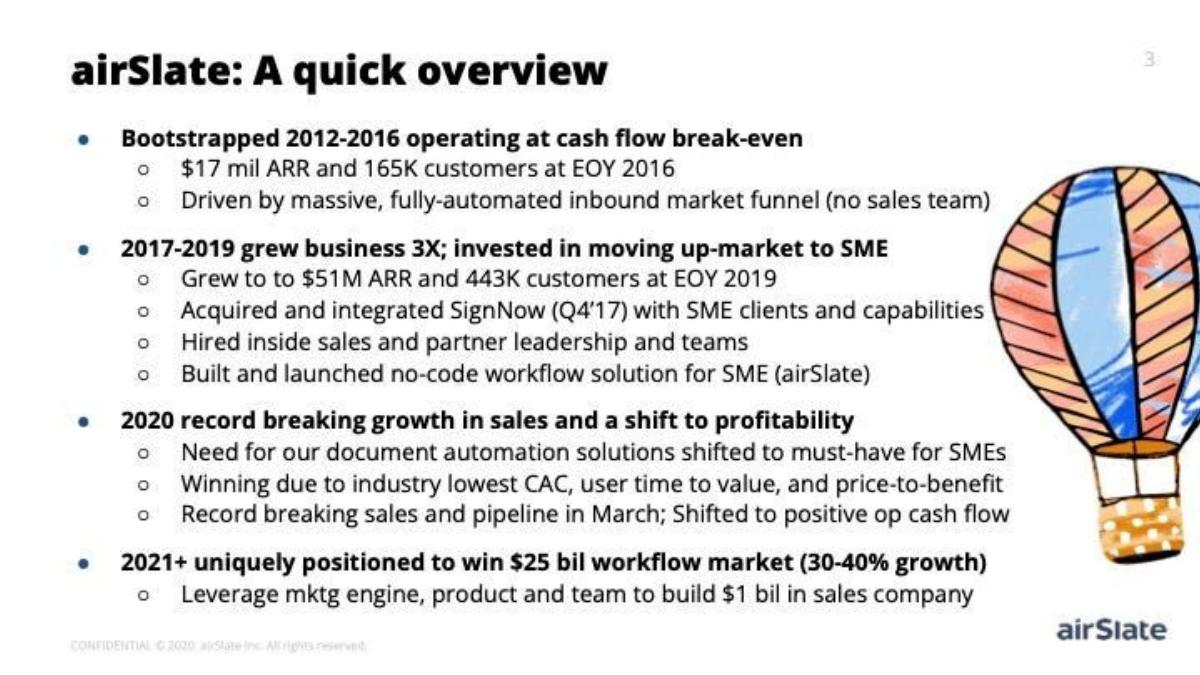
airSlate deck, slide 2. Exact stored slide matched to this analysis.
Our analysis: Two dated ARR and customer counts let an investor work out growth and revenue per customer (about $103 at end-2016 and $115 at end-2019, by our arithmetic) without asking. The phases explain why the growth rate changed.
Evidence and limitation: The 2020 claims ("record breaking", "industry lowest CAC") have no numbers, and there's no retention figure. With revenue per customer near $100 a year, investors will ask about churn.
What a founder can adapt: Give ARR and customers at the start and end of each phase, and one line on what changed between them.
Supporting analysis
What the deck claims: "airSlate: A quick overview" tells the story in four dated phases: bootstrapped 2012–2016 at cash-flow break-even, reaching $17M ARR and 165K customers at end-2016 with no sales team; 2017–2019 grew 3X to $51M ARR and 443K customers while moving up-market (SignNow acquisition Q4'17, inside sales hired); 2020 record sales and a shift to positive operating cash flow; 2021+ a claimed $25B workflow market growing 30–40%.
Presentation choice: Two dated ARR and customer counts let an investor work out growth and revenue per customer (about $103 at end-2016 and $115 at end-2019, by our arithmetic) without asking. The phases explain why the growth rate changed.
When it does not fit: The 2020 claims ("record breaking", "industry lowest CAC") have no numbers, and there's no retention figure. With revenue per customer near $100 a year, investors will ask about churn.
Open-source developer platform selling to enterprises. The slide cites ARR growth from 20Q1 to 21Q1 and a target for end-2023; the round is not stated.
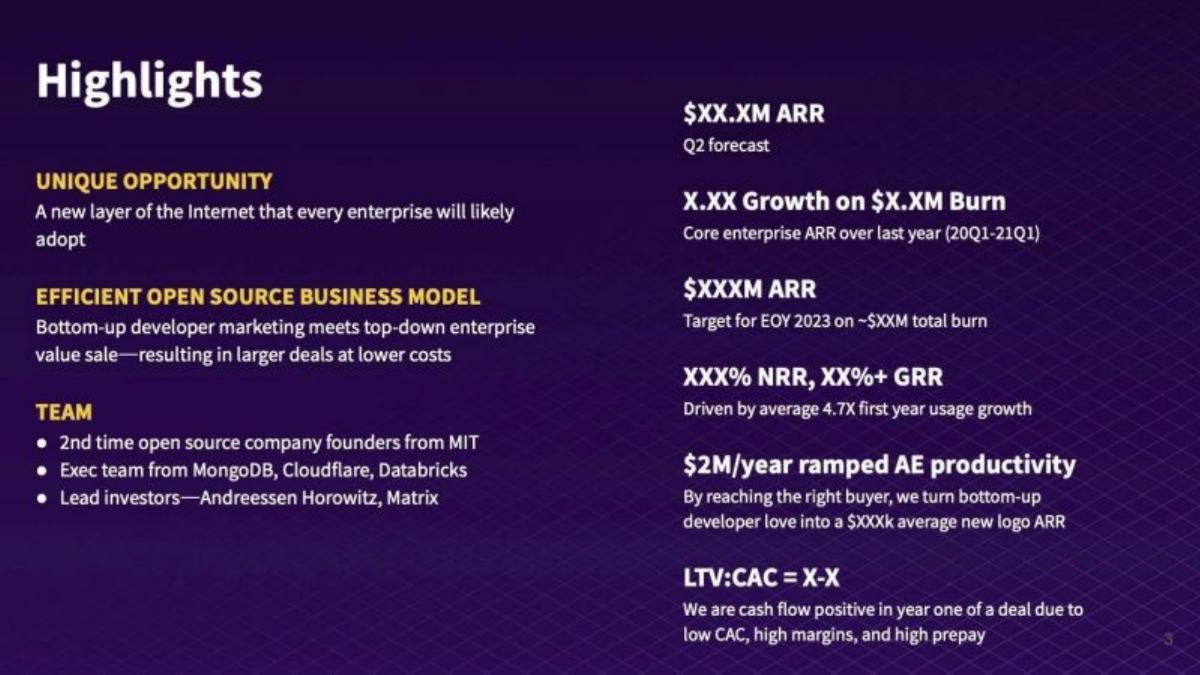
Apollo GraphQL deck, slide 3. Exact stored slide matched to this analysis.
Our analysis: The metric set is the lesson: growth measured against burn, net and gross retention side by side, and sales productivity. Each line has a one-sentence explanation of what drives it.
Evidence and limitation: A forecast ARR placed first reads as a headline. Lead with actual trailing ARR and label forecasts clearly.
What a founder can adapt: If your retention is strong, show both NRR and GRR; NRR alone can hide churn that expansion covers.
Supporting analysis
What the deck claims: "Highlights" pairs three qualitative claims (opportunity, open-source business model, team) with six metric lines: ARR (Q2 forecast), core enterprise ARR growth on burn over 20Q1–21Q1, an ARR target for EOY 2023 on total burn, NRR and GRR "driven by average 4.7X first year usage growth", $2M/year ramped AE productivity, and LTV:CAC. Every value except 4.7X and $2M is redacted in the public version.
Presentation choice: The metric set is the lesson: growth measured against burn, net and gross retention side by side, and sales productivity. Each line has a one-sentence explanation of what drives it.
When it does not fit: A forecast ARR placed first reads as a headline. Lead with actual trailing ARR and label forecasts clearly.
Performance-management software starting with customer service and sales teams. The slide says it raised $7M in 2020; the round is not stated.
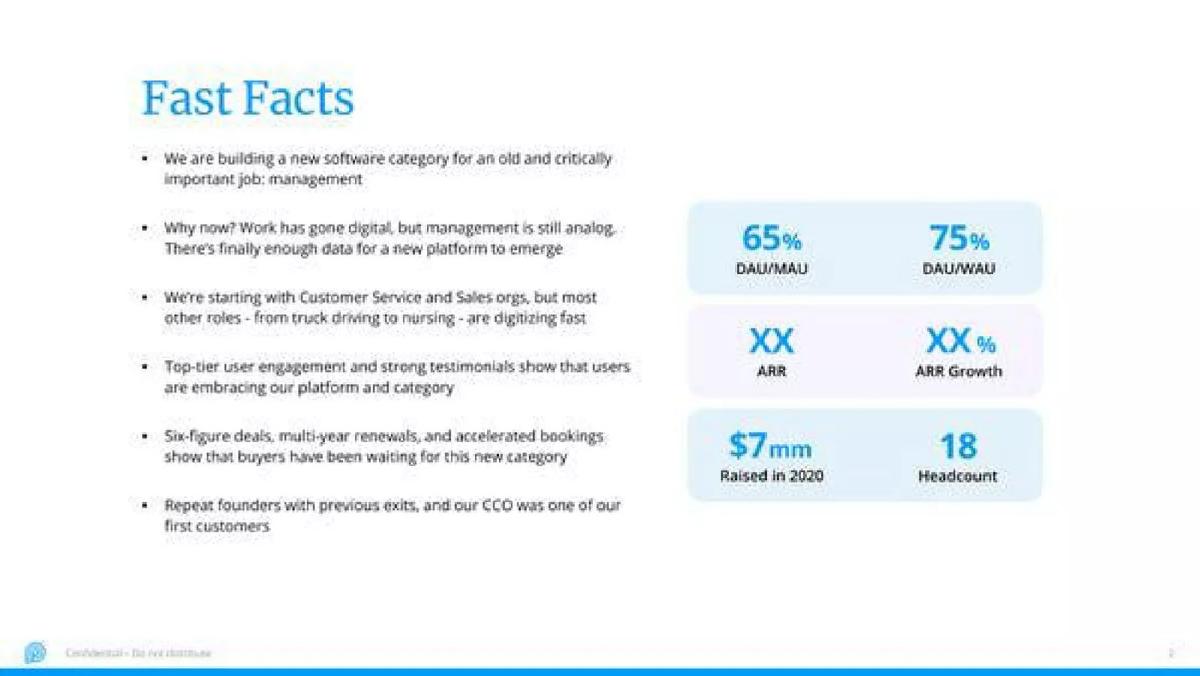
Pathlight deck, slide 2. Exact stored slide matched to this analysis.
Our analysis: Engagement ratios are unusually strong evidence for a management tool, where low daily use is the typical failure. Leading with them makes sense when revenue is still small.
Evidence and limitation: "Multi-year renewals" and "six-figure deals" appear only in text, without counts. Two numbers there would do more than the headcount tile.
What a founder can adapt: If usage is your strongest signal, define the user base and period, and put one renewal fact next to it.
Supporting analysis
What the deck claims: "Fast Facts" lists six bullets (category, why now, starting market, engagement, deals, repeat founders) beside six tiles: 65% DAU/MAU, 75% DAU/WAU, ARR (redacted), ARR growth (redacted), $7mm raised in 2020 and 18 headcount. The bullets mention six-figure deals, multi-year renewals and accelerated bookings.
Presentation choice: Engagement ratios are unusually strong evidence for a management tool, where low daily use is the typical failure. Leading with them makes sense when revenue is still small.
When it does not fit: "Multi-year renewals" and "six-figure deals" appear only in text, without counts. Two numbers there would do more than the headcount tile.
AI software for accounting firms. Stage and year are not recorded in our collection.
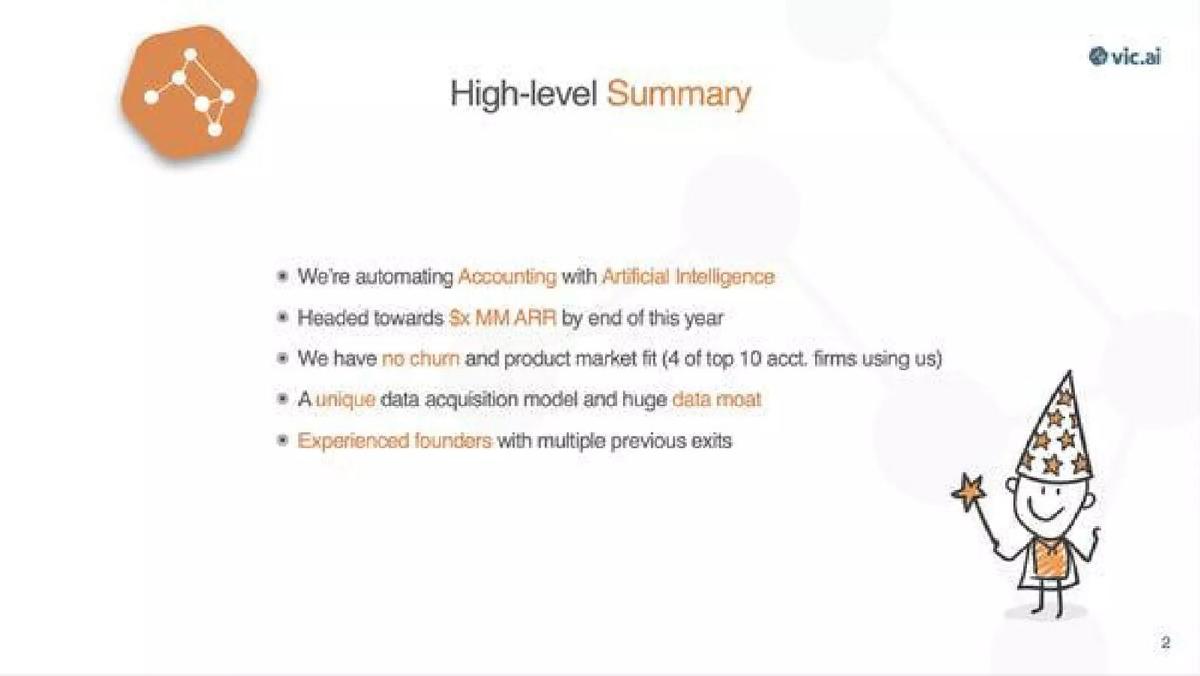
Vic.ai deck, slide 2. Exact stored slide matched to this analysis.
Our analysis: Naming the share of top-10 firms is a compact way to show enterprise adoption in a concentrated market.
Evidence and limitation: Only a forward ARR target, with no current figure, and "no churn" without a base, leaves the traction case to other slides. Treat this as a summary to improve on.
What a founder can adapt: If churn really is zero, say across how many customers and over what period, and give the ARR you have today, not only the target.
Supporting analysis
What the deck claims: A "High-level Summary" with five bullets: automating accounting with AI; headed towards $x MM ARR by year end (redacted); no churn and product-market fit ("4 of top 10 acct. firms using us"); a data acquisition model and data moat; experienced founders with previous exits.
Presentation choice: Naming the share of top-10 firms is a compact way to show enterprise adoption in a concentrated market.
When it does not fit: Only a forward ARR target, with no current figure, and "no churn" without a base, leaves the traction case to other slides. Treat this as a summary to improve on.
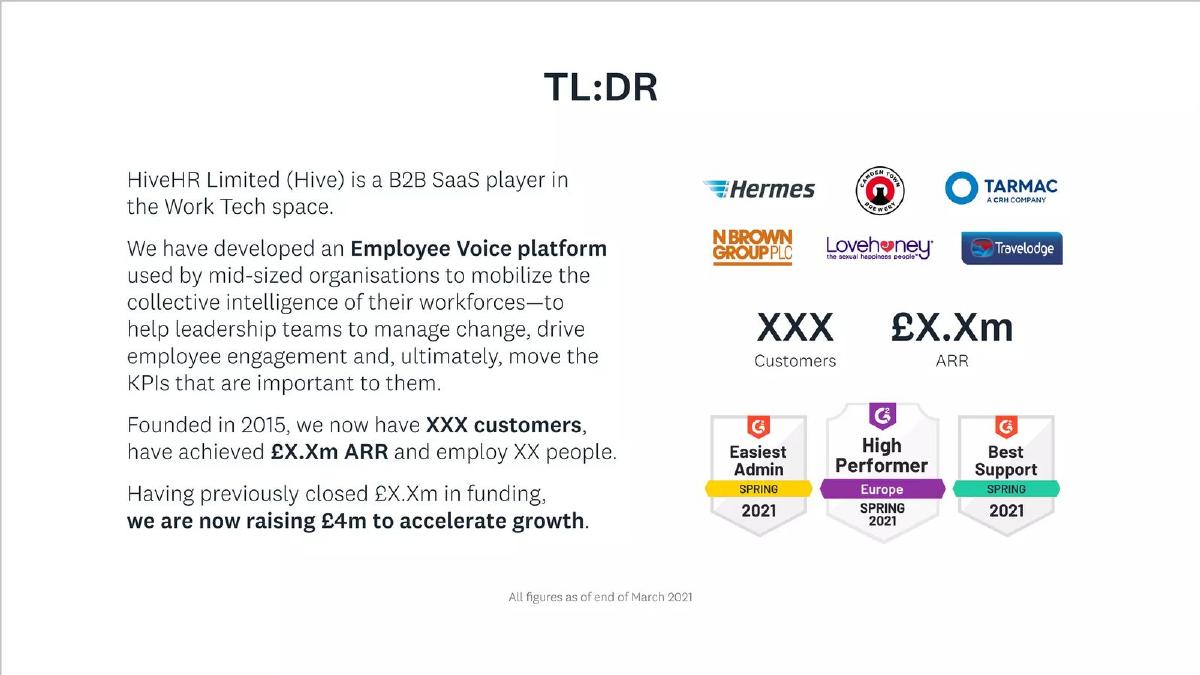
Employee-voice software for mid-sized organisations. Figures are dated end of March 2021; the slide says Hive is raising £4m.
Hive (HiveHR) deck, slide 2. Exact stored slide matched to this analysis.
Our analysis: It puts the essentials a SaaS investor wants first (customers, ARR, date, ask) on one slide, and the footnote dates every figure.
Evidence and limitation: G2 badges are third-party review awards, not traction. Without growth rate or retention, customers and ARR are a snapshot, not a trend.
What a founder can adapt: Keep the dated one-line summary; replace one badge with a growth or retention figure.
Supporting analysis
What the deck claims: "TL:DR" describes the product, then "Founded in 2015, we now have XXX customers, have achieved £X.Xm ARR and employ XX people" (redacted), six customer logos (Hermes, Camden Town Brewery, Tarmac, N Brown Group, Lovehoney, Travelodge), three G2 Spring 2021 badges and the £4m raise.
Presentation choice: It puts the essentials a SaaS investor wants first (customers, ARR, date, ask) on one slide, and the footnote dates every figure.
When it does not fit: G2 badges are third-party review awards, not traction. Without growth rate or retention, customers and ARR are a snapshot, not a trend.
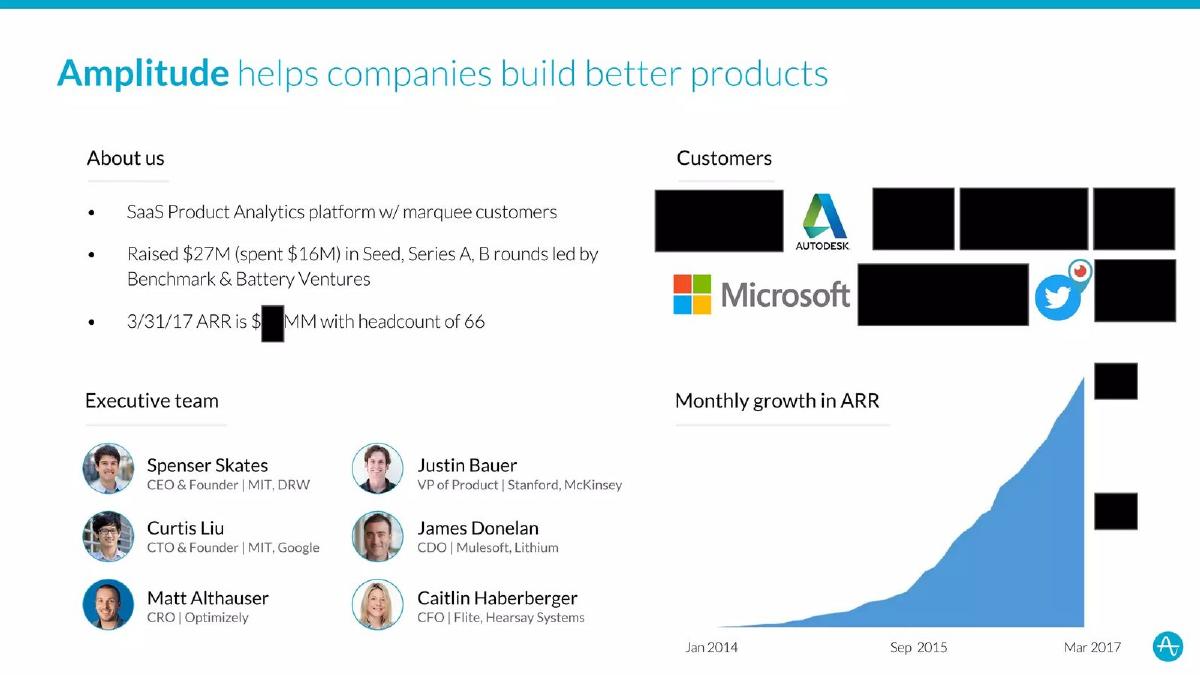
Product-analytics software. ARR is dated 3/31/17; the slide says it had raised $27M across Seed, Series A and B (abridged public version).
Amplitude deck, slide 2. Exact stored slide matched to this analysis.
Our analysis: The ARR curve shows shape over three years at a glance, and "raised $27M (spent $16M)" signals capital efficiency in five words.
Evidence and limitation: Cramming team, customers and the chart onto one slide makes each part small. In a full deck, give the ARR chart its own slide.
What a founder can adapt: Chart ARR over time with a labelled axis, and state capital raised versus spent if it flatters your efficiency.
Supporting analysis
What the deck claims: One slide combines "About us" (SaaS product analytics, $27M raised with $16M spent, ARR at 3/31/17 redacted, headcount 66), six executives, a customer logo grid (most redacted; Autodesk, Microsoft and Twitter visible) and a "Monthly growth in ARR" area chart from Jan 2014 to Mar 2017 with the axis values blacked out.
Presentation choice: The ARR curve shows shape over three years at a glance, and "raised $27M (spent $16M)" signals capital efficiency in five words.
When it does not fit: Cramming team, customers and the chart onto one slide makes each part small. In a full deck, give the ARR chart its own slide.
Lead with the metric that answers the question an investor at your stage will ask first.
Lead metric
What it answers
Example
What to add
ARR at several dates
How fast is it growing?
airSlate; Amplitude
Retention and revenue per customer
ARR + NRR/GRR
Does revenue stay and expand?
Apollo
Actual trailing ARR before forecasts
Engagement (DAU/MAU)
Do users rely on it?
Pathlight
User base, period, a renewal fact
Logo share of a concentrated market
Are leaders adopting?
Vic.ai
Current ARR, churn base and period
Dated customers + ARR summary
Where is the company now?
Hive
Growth rate or retention
Key Takeaways
Show ARR at two or more dates. airSlate gives $17M ARR and 165K customers at end-2016 and $51M and 443K at end-2019, so growth and revenue per customer can both be read from one slide.
Pair revenue with retention. Apollo's highlights put net revenue retention and gross retention next to ARR and explain what drives them ("average 4.7X first year usage growth"). Growth without retention leaves the obvious question unanswered.
Prove a claim like "no churn" with a number and a period. Vic.ai states it has no churn and 4 of the top 10 accounting firms as users, but gives no customer count or time frame, so the claim can't be weighed.
Engagement helps before revenue scales, but define it. Pathlight leads with 65% DAU/MAU and 75% DAU/WAU; investors will ask which users and which month.
Date every figure. Hive notes "All figures as of end of March 2021" and Amplitude dates ARR to 3/31/17; undated metrics make investors guess whether they are current.
Build your SaaS traction line
Fill in each prompt with real numbers, then keep the two or three strongest.
Revenue. What was ARR (or MRR) today, 12 months ago and at your last round?
Retention. What are net and gross revenue retention, over what period and on how many customers?
Efficiency. What is CAC payback, burn multiple or ramped sales productivity?
Proof. Which named customers or usage figures best show the product is relied on?
Copyable framework: $[x]M ARR at [date], up [y]x from [date]. [n]% NRR, [m]% GRR across [k] customers. [payback] months CAC payback. Customers include [names].
Illustrative example 1 — written by us
Before: Strong growth. No churn. Trusted by leading brands. Award-winning platform.
After: $[x]M ARR at [month/year], up from $[y]M a year earlier. [n]% net retention, [m]% gross, across [k] customers over 12 months. Customers include [three names].
What improved: Our illustrative rewrite, not any company's text. It replaces adjectives with dated ARR, both retention measures with their base, and named customers; bracketed values are placeholders.
What makes SaaS traction different
Subscription revenue repeats, so investors judge SaaS traction by whether revenue stays and grows after the sale, not just by how much was sold. That is why ARR or MRR over time, retention (net and gross), and efficiency measures such as CAC payback or sales productivity carry more weight here than a single revenue total.
The general traction guide covers every business model. The marketplace and pre-revenue guides cover GMV-led and pre-revenue evidence; this page is only for software companies with recurring revenue.
Common mistakes
Forecast ARR as the headline. Lead with actual trailing ARR; label targets as targets.
NRR without GRR. Net retention can hide churn that expansion covers.
"No churn" without a base. Say how many customers and over what period.
Undated metrics. Add an "as of" date to every figure.
Awards as traction. Review badges and press are support, not revenue evidence.
Diagnostic checklist
ARR or MRR appears at two or more dates.
Every figure has an "as of" date.
Retention is shown, with net and gross if possible.
Forecasts are labelled and placed after actuals.
Engagement metrics define the user base and period.
Logos are real customers, not trials or partners.
Frequently asked questions
How we chose these examples
Corpus: published pitch deck teardowns on StartupFundraising.com. Founder-uploaded private decks are excluded.
Selection (2026-09-24): we searched extracted text of slides 2–6 for MRR or ARR combined with churn, retention, NRR, customers, CAC or LTV, where a stored slide image exists; inspected eight candidates; chose six. CommandBar (a thesis slide) and SilkChart (a team slide mentioning a previous company's ARR) were not selected because they are not traction slides.
Review: all six stored slide images were inspected on 2026-09-24 and matched to company, deck and slide number (editorial model review). No person has yet completed an editorial review of this page.
Figures and claims such as "no churn" and "industry lowest CAC" are shown as the companies state them and have not been independently verified. Redacted values are not estimated. Revenue-per-customer figures for airSlate are our arithmetic from the slide. We make no claim that any slide caused a fundraising outcome.