Apollo’s 2021 Series D deck focuses on the transition from a popular open-source tool to an essential enterprise infrastructure layer. The company highlights an estimated 1.5 million active developers and a 15% attach rate to modern web development frameworks like React. The narrative centers on a 'Complexity Bottleneck' where app teams spend two-thirds of their time on service integration rather than feature delivery. Apollo solves this by introducing a unified 'Graph' layer. Financially, the deck shows explosive post-sale expansion with 4.7x average first-year usage growth. While many speci…
Key takeaways
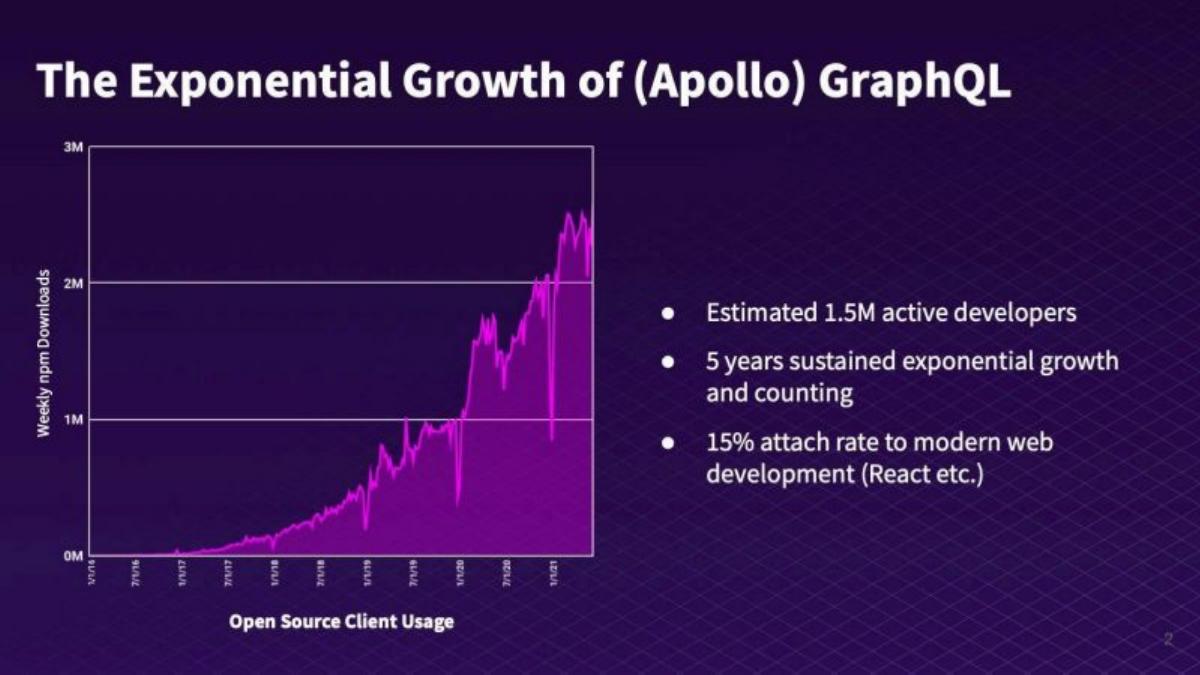
- Apollo claims an estimated 1.5 million active developers and five years of sustained exponential growth (Slide 2).
- The platform has achieved a 15% attach rate to modern web development ecosystems like React (Slide 2).
- The core problem identified is a 'Complexity Bottleneck' where developers spend 2/3 of their time on integration instead of features (Slide 7).
- Apollo positions the 'Graph' as a new essential layer in the tech stack, sitting between apps and services (Slide 10).
- The business model uses a bottom-up developer marketing strategy to identify strategic business buyers for top-down enterprise sales (Slide 16).
- Post-sale expansion is a key metric, with usage growing an average of 4.7x in the first year (Slide 15).
- The leadership team includes executives with backgrounds from MongoDB, Cloudflare, Databricks, and Amazon (Slide 18).
- The deck omits a specific 'Ask' slide detailing the exact use of the $130M Series D funds.
The Narrative: From Open Source Tool to Enterprise Infrastructure
Apollo’s Series D deck is a sophisticated example of how to pitch a developer-centric platform to late-stage investors. The narrative doesn't just focus on a tool; it argues for the creation of a new, permanent layer in the enterprise software stack. By the time of this 2021 raise, Apollo was already the de facto standard for GraphQL, and the deck reflects that confidence by focusing on 'The Graph' as an inevitability for every modern enterprise.
Slides 1-2: The Hook and Exponential Growth
The deck opens with a clean title slide (Slide 1) dated June 2021, immediately followed by the 'Exponential Growth' of Apollo GraphQL (Slide 2). This is a classic 'traction first' approach. Instead of explaining what they do, they show that the market has already chosen them. The chart shows Weekly npm Downloads climbing toward 3 million. Key stats include an estimated 1.5M active developers and a 15% attach rate to modern web development . This establishes Apollo not as a niche tool, but as a core component of the React ecosystem.
Slides 3-4: Highlights and Founder Pedigree
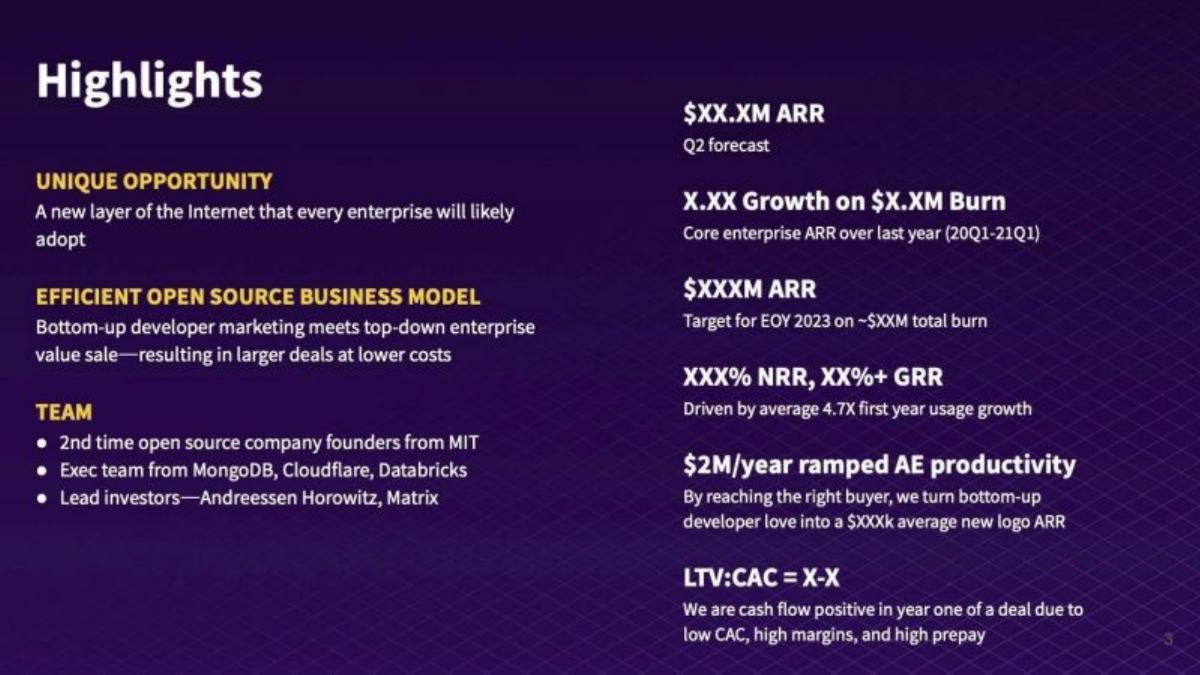
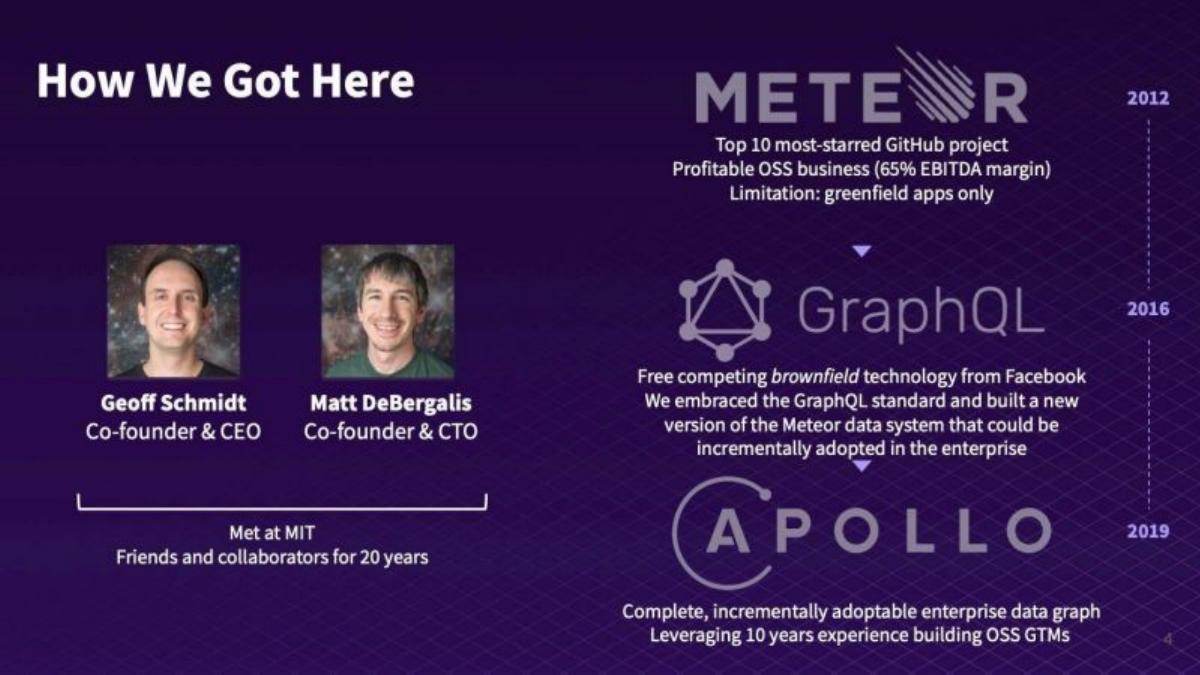
Slide 3 provides a 'Highlights' summary. While the revenue figures are redacted ($XX.XM ARR), the qualitative points are clear: they have a 'Unique Opportunity' to own a new layer of the internet and an 'Efficient Open Source Business Model.' Slide 4, 'How We Got Here,' is crucial for credibility. It shows the founders, Geoff Schmidt and Matt DeBergalis , are 2nd-time open-source founders from MIT. They previously built Meteor , which they describe as a 'Top 10 most-starred GitHub project.' This timeline shows a decade of experience in building open-source Go-To-Market (GTM) strategies, transitioning from Meteor (2012) to GraphQL (2016) to the enterprise-ready Apollo (2019).
Slides 5-9: Defining the Complexity Bottleneck
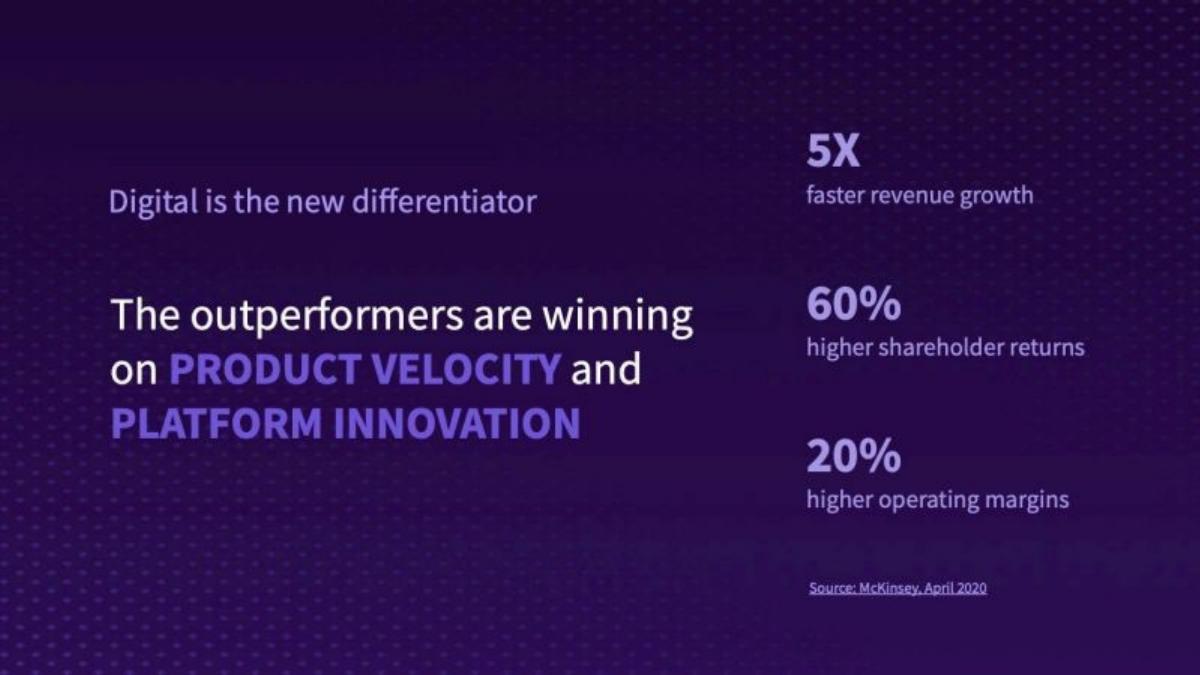
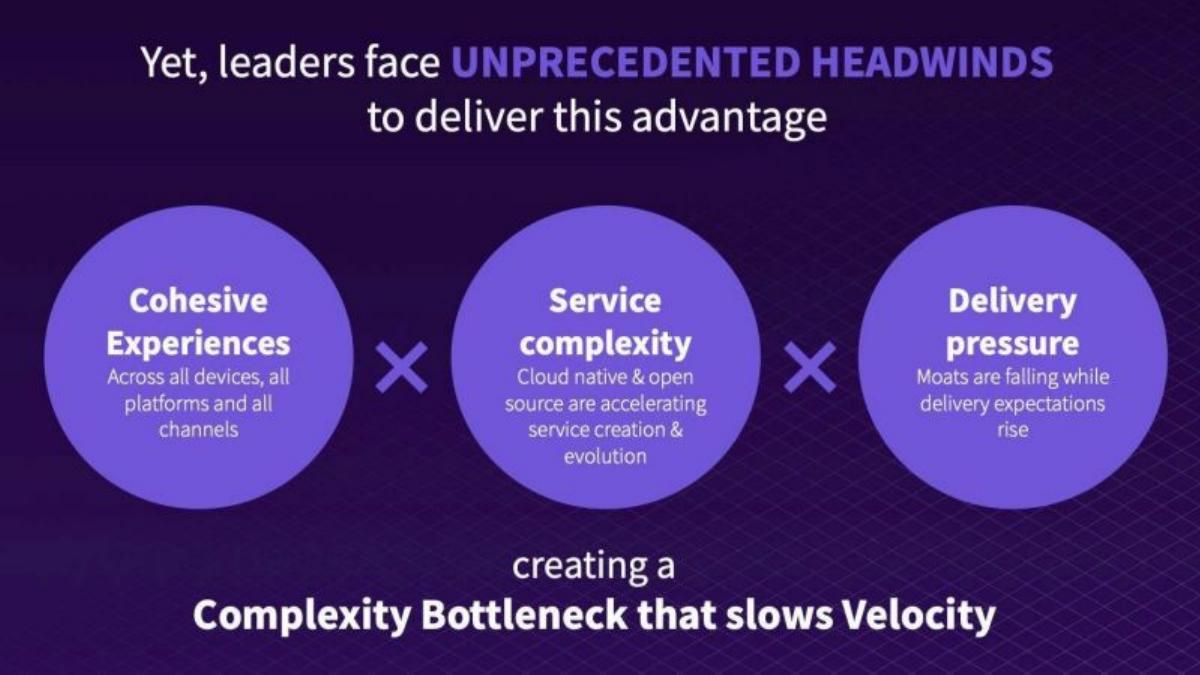
The 'Problem' section begins on Slide 5, citing McKinsey data that 'outperformers' win on product velocity. Slide 6 introduces 'Unprecedented Headwinds,' specifically the 'Complexity Bottleneck.' Slide 7 is the visual centerpiece of the problem: a 'spaghetti' diagram of apps connected to dozens of services and databases. The deck claims app teams spend 2/3 of their time on service integration rather than feature delivery. Slide 8 dismisses previous solutions, stating that API Gateways only address operational concerns and 'BFFs' (Backends for Frontends) fail to scale. Slide 9 summarizes the negative consequences: killed productivity, fragmented customer experiences, and a heavy tech debt burden.
Slides 10-12: The Solution - The Unified Graph
Apollo introduces 'The Graph' on Slide 10 as a 'new essential layer in your stack.' It positions the Graph Router as a single source of truth. Slide 11 elaborates on the 'Power of Graph,' promising rich, cohesive experiences and the ability for frontend and backend teams to innovate independently. Slide 12 makes a strategic distinction between 'Unmanaged Graph' (ad-hoc, grassroots) and a 'Unified Graph Strategy' (aligned, scalable). This is a subtle sales pitch: developers might start with the unmanaged version, but the enterprise needs Apollo to manage it.
Slides 13-15: Social Proof and Financial Trajectory
Slide 13 uses anonymized case studies from a 'Top fintech company,' a 'Top travel company,' and a 'Fortune 500 retailer' to show real-world impact. Slide 14, 'Apollo Timeline,' shows a bar chart of Enterprise Product ARR . While the Y-axis is redacted, the visual shows 5 consecutive quarters of increasing ARR growth rates . Slide 15, 'Explosive Post-Sale Expansion,' is perhaps the most important slide for a Series D investor. It shows a 4.7x average first-year usage growth and a high Net Revenue Retention (NRR) , indicated by the 'XXX%' placeholder. The chart of 'Average Monthly Transactions' shows a nearly perfect exponential curve with an R² of 0.964.
Slides 16-17: The Business Model and Unit Economics
Slide 16 explains the 'Bottom Up' meets 'Top Down' model. Developers self-onboard (Bottom Up), while Apollo’s marketing infrastructure identifies 'target account scores' to help Account Executives (AEs) find the 'strategic business buyer' (Top Down). Slide 17, 'Pro Forma Unit Economics,' is heavily redacted but outlines their path to profitability. They claim to be cash flow positive in year one of a deal due to 'low CAC, high margins, and high prepay.' They list placeholders for the cost to acquire $100k new ARR versus $100k expansion ARR , emphasizing the efficiency of their expansion motion.
Slides 18-21: The Team and Vision
Slide 18 showcases 'Experienced Leaders' with backgrounds from MongoDB, Cloudflare, Databricks, Amazon, and AppDynamics . This signals to investors that the company has the 'adults in the room' necessary to scale to an IPO. Slide 19 reinforces the 'Graph' as a permanent layer in the modern enterprise, sitting between 'Value-creating Applications' and 'Business Capabilities.' The deck concludes with a thematic image of a Saturn V rocket launch (Slide 20), leaning into the 'Apollo' branding, and a final placeholder slide.
What Apollo Does Well
Category Creation: They don't just sell a tool; they sell 'The Graph' as an essential architectural layer, similar to how Snowflake sold the 'Data Cloud.' · Usage-Based Proof: By showing transaction growth (Slide 15) alongside revenue growth, they prove that their product is being deeply integrated into customer workflows. · GTM Clarity: Slide 16 perfectly articulates how they bridge the gap between 'developer love' and 'enterprise dollars,' a common sticking point for open-source companies. · Pedigree: They lean heavily on the founders' 20-year history and the executive team's experience at other infrastructure unicorns.
What Is Missing
The Ask: There is no slide detailing how much they are raising or how they intend to spend the $130M. This is common in late-stage decks which often serve more as a 'company overview' than a 'pitch.' · Competitive Landscape: The deck ignores direct competitors (like AWS AppSync or Hasura), choosing instead to frame the competition as 'past attempts' or 'unmanaged' grassroots efforts. · Specific Financials: In this public version, all revenue, margin, and retention percentages are redacted. While investors saw these, the teardown is limited by the 'X' placeholders.
Founder's Teardown: What to Copy
The 'Complexity' Visual: If you are selling infrastructure, copy Slide 7. Showing the 'mess' your product cleans up is more effective than any list of features. · The Timeline of Credibility: Slide 4 is a great way to show that you aren't just a 'new' startup, but the culmination of a decade of specific expertise. · The 'Attach Rate' Metric: If you operate in a specific ecosystem (like React, AWS, or Salesforce), find your 'attach rate.' It proves you are a 'must-have' for a specific, large audience. · Expansion as a Growth Engine: Slide 15’s focus on usage growth after the sale is a powerful way to justify high valuations in a SaaS or infrastructure business.
Frequently asked questions
- What is the core value proposition Apollo presents to enterprises?
- Apollo argues that modern enterprises face a 'Complexity Bottleneck' caused by the explosion of microservices and diverse client devices. According to slide 7, app teams spend 66% of their time on service integration. Apollo’s value proposition is providing a unified 'Graph' layer that acts as a single source of truth, allowing frontend and backend teams to innovate independently and increasing product velocity.
- How does Apollo's business model work?
- Apollo employs a 'land and expand' strategy detailed on slide 16. They give away free single-team data graphs to developers (bottom-up). As usage grows, Apollo uses 'Account Based Selling' to identify companies with multiple siloed graphs. They then sell 'graph consolidation' and enterprise-wide partnerships to a strategic business buyer (top-down) to deliver a secure, shared graph for the whole company.
- What metrics does Apollo use to prove market dominance?
- On slide 2, Apollo cites 'Weekly npm Downloads' as a proxy for growth, showing a 5-year exponential trend. They claim 1.5 million active developers and a 15% attach rate to the 'modern web' (React, etc.). Furthermore, slide 14 shows five consecutive quarters of increasing ARR growth rates leading up to the June 2021 fundraise.
- Who are the key people behind Apollo according to the deck?
- The company was founded by Geoff Schmidt (CEO) and Matt DeBergalis (CTO), who met at MIT and have collaborated for 20 years (Slide 4). They previously built Meteor, a top 10 most-starred GitHub project. The executive bench (Slide 18) includes veterans from high-growth infrastructure companies like MongoDB, Cloudflare, and Databricks.
- What is missing from this pitch deck?
- This version of the deck has significant redactions, using 'X' placeholders for ARR, growth rates, NRR, and unit economics (Slides 3, 14, 15, 17). It also lacks a specific 'Use of Funds' slide and a detailed competitor matrix, though it briefly mentions that 'past attempts' like API Gateways and 'BFFs' (Backends for Frontends) have failed to scale (Slide 8).