"Profitable" and "Break-Even" in a Pitch Deck: 12 Real
How to state profitability on a pitch deck: which measure (EBITDA, net income, operating cash flow, per-customer or per-portfolio), for which period.
"Profitable", "Break-Even" and "Cash-Flow Positive" in a Pitch Deck: Say Which Measure, for Which Period
Many decks add one word to a traction slide: "profitable", "breakeven" or "cash-flow positive". The word matters, because it tells a reader how much of the new money is needed just to keep the company running. But the three words mean different things, and each can describe a single month, a year, one product line or a single customer. This guide compares twelve real slides on which measure they name, for which period, and how much of the company it covers, and checks the claim against the other numbers on each slide.
TL;DR
Name the measure (EBITDA, operating profit, net income or operating cash flow), the period (a month, a quarter, a financial year, or "every month since [date]"), the scope (the whole company, or one product, book of business or customer) and, where possible, the amount. Careerist gives monthly revenue and monthly EBITDA next to each other, the most checkable claim here. JibeHealth gives a net income figure for a named year. airSlate separates cash-flow break-even (2012–2016) from positive operating cash flow (2020). Avocode, evvnt, Liberty Health Sciences and OwnLocal give a date or a label but no measure. wefox's claim covers only its existing policy book, and the open-source deck labelled Apollo claims cash-flow positivity per deal, not for the company.
Profitability claims on real pitch deck slides
Each example shows the exact stored slide above its analysis and links to the full teardown. Most fully defined first. Figures are quoted as shown; calculations are ours.
Careerist traction slide — slide 6
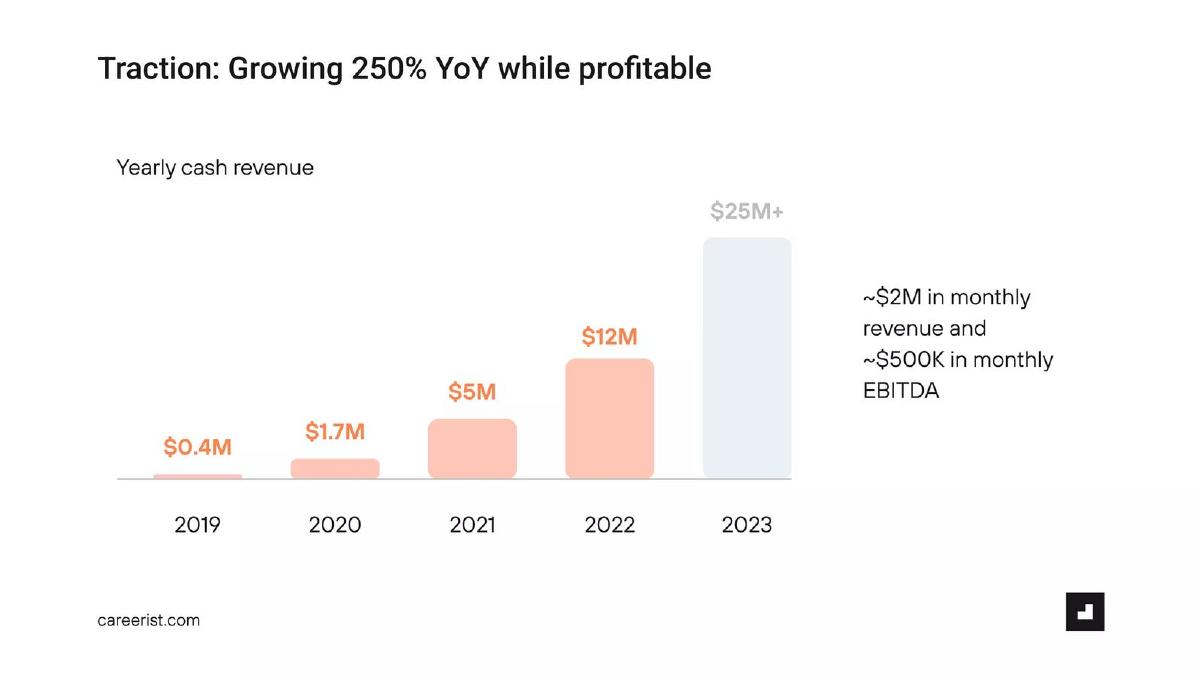
Tech career training company, from the deck of an $8M round. A bar chart headed "Yearly cash revenue" with a note beside it.
Careerist deck, slide 6. Exact stored slide matched to this analysis.
Our analysis: The most checkable claim here: a named measure (EBITDA) with an amount and the revenue beside it. The period is one month, and the growth rate's basis is unclear.
Evidence and limitation: $500K ÷ $2M = an EBITDA margin of about 25% for the month shown. $2M × 12 = $24M, consistent with the lighter "$25M+" 2023 bar, which appears to be an annualised or in-progress year rather than a completed one. $5M to $12M is 140% growth; the headline 250% may refer to another period or to 2022–2023 on the annualised figure ($12M to $25M+ is about 108%) — the slide doesn't say which. The chart is "cash revenue", money collected, which can differ from recognised revenue for a training company that is paid upfront.
What a founder can adapt: Add the month and how many months have been EBITDA-positive: "EBITDA ~$500K in [month year]; positive every month since [date]."
Supporting analysis
What the deck claims: Title: "Traction: Growing 250% YoY while profitable." Bars: 2019 $0.4M, 2020 $1.7M, 2021 $5M, 2022 $12M, 2023 "$25M+" (in a lighter colour). Note: "~$2M in monthly revenue and ~$500K in monthly EBITDA."
Presentation choice: A reader can see the margin, not just the word "profitable", and can judge how much of the round is growth money.
When it does not fit: Don't place a headline growth rate the chart doesn't reproduce next to a profitability claim; state the years compared.
Online health-insurance agency. A traction slide with eight tiles over a timeline from February 2013 to May 2015.
JibeHealth deck, slide 5. Exact stored slide matched to this analysis.
Our analysis: A named measure, amount and year, alongside revenue. It covers one year.
Evidence and limitation: $426K ÷ $2M ≈ 21% net margin for 2014. Net income is the strictest measure, and the year is stated. The slide doesn't say whether the accounts are audited, or whether revenue is commissions (usual for an agency) — the margin reads differently if it is. The "100,000 customers assisted" count is a different base from paying policyholders.
What a founder can adapt: Add the basis and trend: "Net income $426K in 2014 (management accounts); [2013 figure] the year before."
Supporting analysis
What the deck claims: "2M in Revenue in 2014." "426K in Net Income 2014." "100,000 Customers Assisted." "Licensed in 24 States." Timeline: "Bootstrapped with 300K by Founders."
Presentation choice: Net income for a named year is hard to misread and lets a reader compute the margin.
When it does not fit: Don't mix "customers assisted" with paying customers on the same row as revenue.
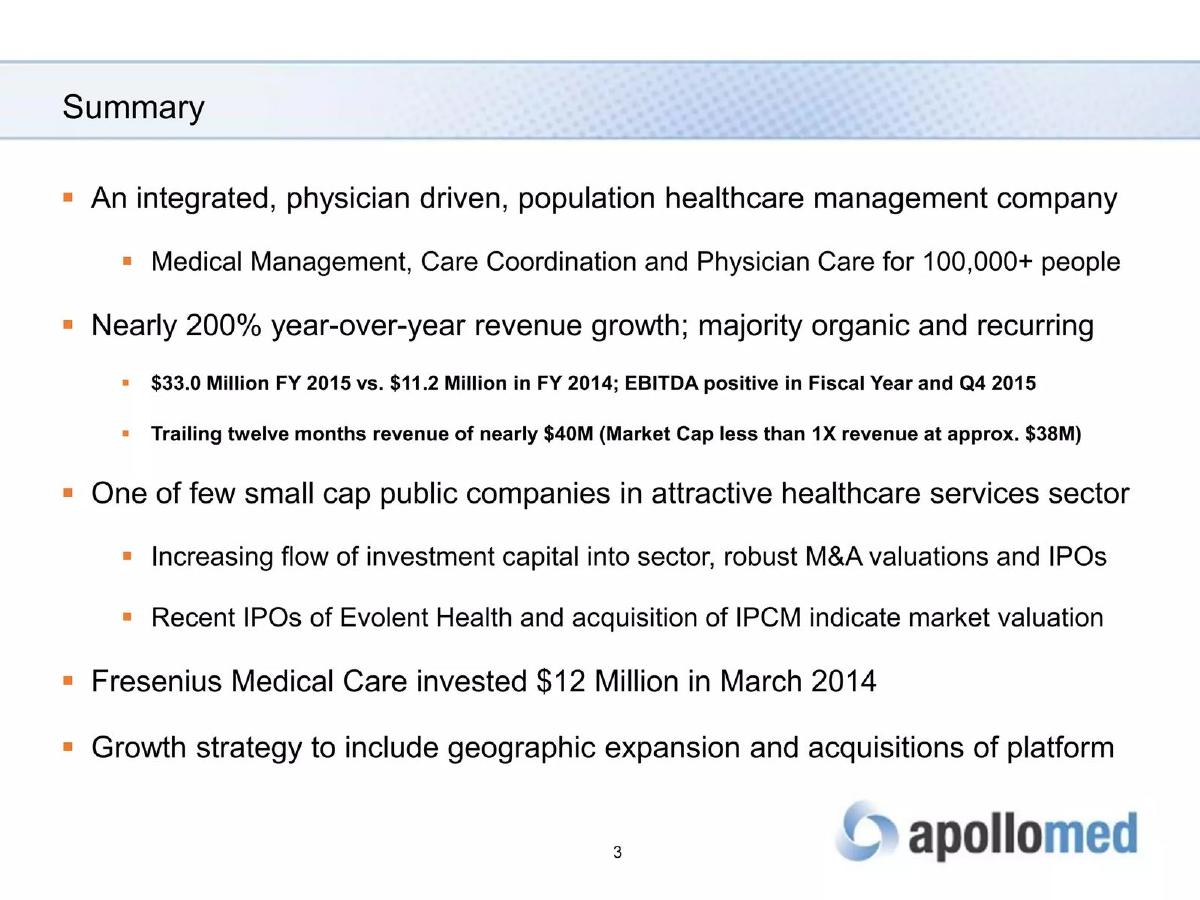
Listed small-cap healthcare management company ("apollomed"), summary slide from an investor presentation.
Apollo Medical Holdings deck, slide 3. Exact stored slide matched to this analysis.
Our analysis: The measure and two periods are named; the amount is not.
Evidence and limitation: $33.0M ÷ $11.2M = 2.95, so +195%, which matches "nearly 200%". EBITDA positivity is stated for both the full fiscal year and the latest quarter, which shows it is not one good quarter. No EBITDA amount is given, and the slide doesn't say whether it is adjusted EBITDA. As a listed company, its full statements would have been public.
What a founder can adapt: Add the amount and definition: "EBITDA $[x] in FY2015, $[y] in Q4 (adjusted for [items])."
Supporting analysis
What the deck claims: "Nearly 200% year-over-year revenue growth; majority organic and recurring." "$33.0 Million FY 2015 vs. $11.2 Million in FY 2014; EBITDA positive in Fiscal Year and Q4 2015." "Trailing twelve months revenue of nearly $40M."
Presentation choice: Stating both the year and the latest quarter answers the reader's first question: is it still profitable now?
When it does not fit: Don't state EBITDA-positive without saying whether it is adjusted.
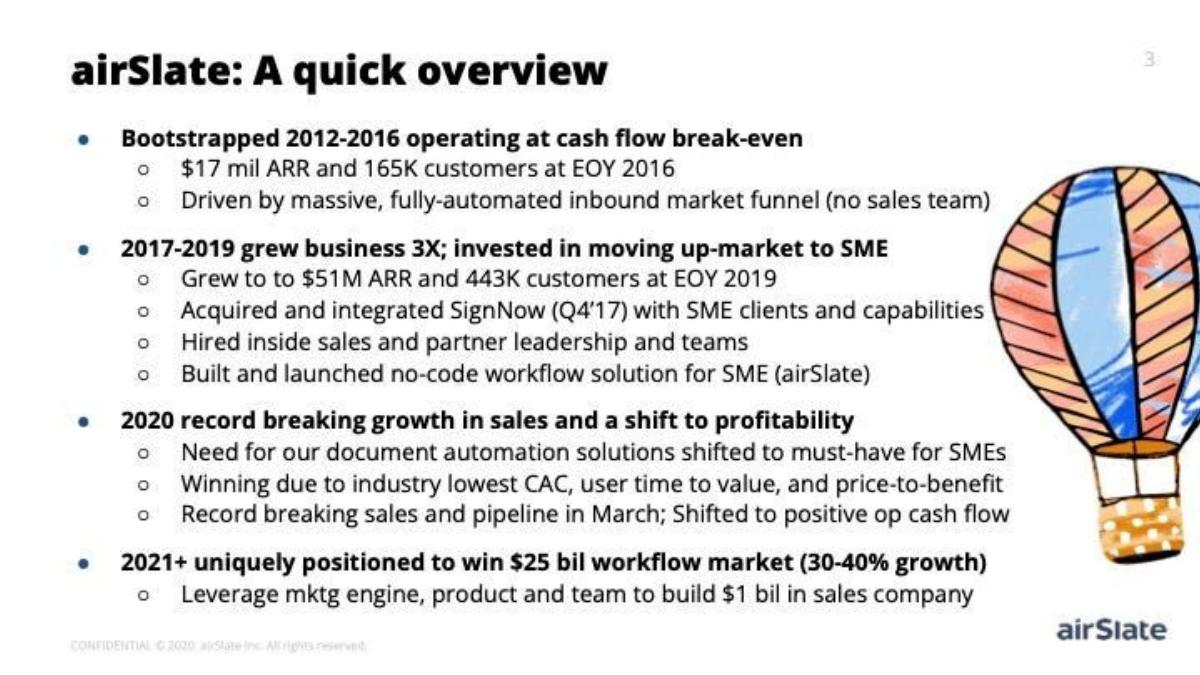
Document workflow software. A "quick overview" slide in four dated phases, marked confidential 2020.
airSlate deck, slide 2. Exact stored slide matched to this analysis.
Our analysis: Clear phases with dates, and a named cash measure. "Profitability" and cash flow are used as if they were the same.
Evidence and limitation: $51M ÷ $17M = 3.0, matching "grew business 3X". The slide uses cash measures throughout — "cash flow break-even" and "positive op cash flow" — and the 2017–2019 phase implies the company spent more than it earned while moving up-market, though it doesn't say so. The 2020 bullet says "shift to profitability" and "positive op cash flow" together; operating cash flow is not profit, and a software company with annual prepayments can have positive cash flow before it is profitable. "Record breaking sales ... in March" names only one month.
What a founder can adapt: Keep the phases and separate the measures: "2020: operating cash flow positive from [month]; [EBITDA / net income] [amount]."
Supporting analysis
What the deck claims: "Bootstrapped 2012-2016 operating at cash flow break-even" with "$17 mil ARR and 165K customers at EOY 2016". "2017-2019 grew business 3X; invested in moving up-market to SME": "$51M ARR and 443K customers at EOY 2019". "2020 record breaking growth in sales and a shift to profitability ... Shifted to positive op cash flow."
Presentation choice: The phases explain why the company was break-even, then spent, then turned cash-positive — a reader sees it was a choice.
When it does not fit: Don't use "profitability" to describe a cash-flow result.
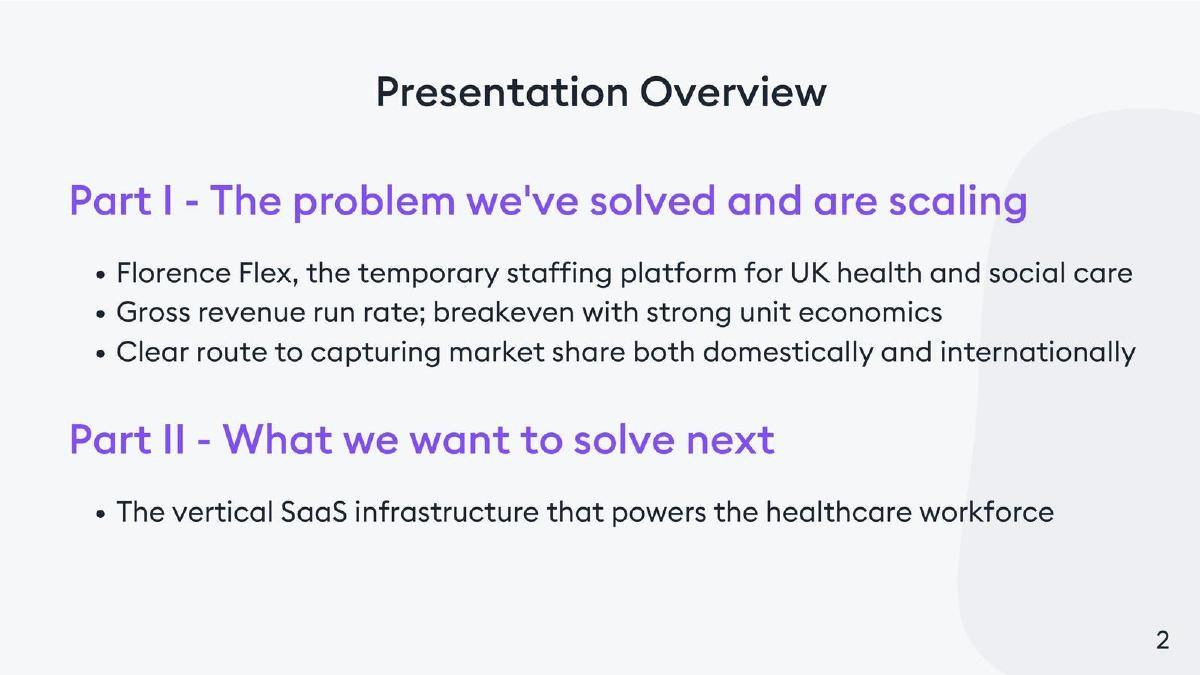
UK health and social care staffing platform. A presentation-overview slide.
Florence deck, slide 3. Exact stored slide matched to this analysis.
Our analysis: An agenda slide that states a claim without a measure, scope or period; the figures may appear later in the deck.
Evidence and limitation: No figures on this slide. "Breakeven" appears beside "gross revenue run rate" and "unit economics", so a reader can't tell whether the company as a whole breaks even or only each shift or customer covers its own cost. For a staffing platform, gross revenue usually includes the pay passed through to workers, so the company's own net revenue is much smaller; this slide doesn't say which is used.
What a founder can adapt: "Company EBITDA break-even in [period] on £[x] net revenue (£[y] gross billings)."
Supporting analysis
What the deck claims: "Florence Flex, the temporary staffing platform for UK health and social care." "Gross revenue run rate; breakeven with strong unit economics." "Clear route to capturing market share."
Presentation choice: It signals financial discipline early, but readers will look for the numbers behind it.
When it does not fit: Don't combine company break-even and unit economics in one clause; they are separate claims.
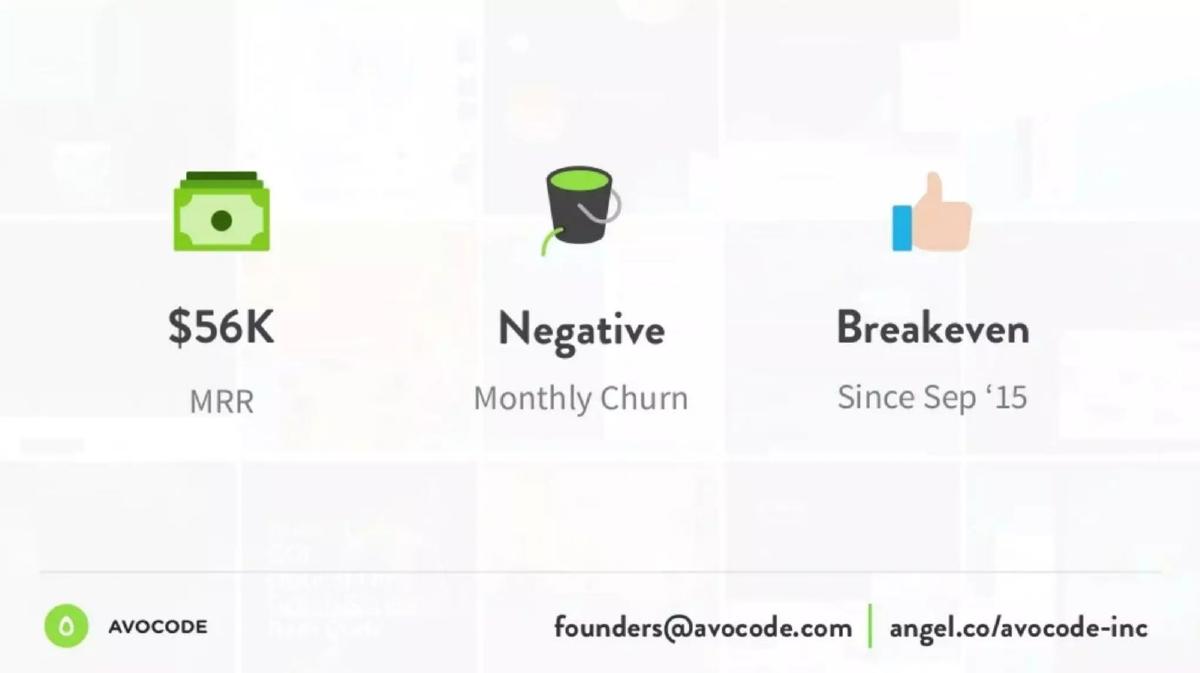
Design-handoff software. A three-tile metrics slide.
Avocode deck, slide 3. Exact stored slide matched to this analysis.
Our analysis: A clear start date for a break-even claim with no measure.
Evidence and limitation: The start date makes this a sustained claim, not one month, which is its strength. The measure (profit or cash) isn't named, and no date is given for the $56K MRR or for when the slide was made, so a reader can't tell how many months "since Sep '15" covers. $56K × 12 ≈ $672K annualised revenue. "Negative monthly churn" is covered in the churn and retention guide.
What a founder can adapt: "Operating cash-flow break-even every month since Sep '15 (as of [month year])."
Supporting analysis
What the deck claims: "$56K MRR." "Negative Monthly Churn." "Breakeven Since Sep '15."
Presentation choice: "Since [date]" is the right structure for a profitability claim; it shows the result has lasted.
When it does not fit: Don't leave the reader to guess the slide date when the claim depends on it.
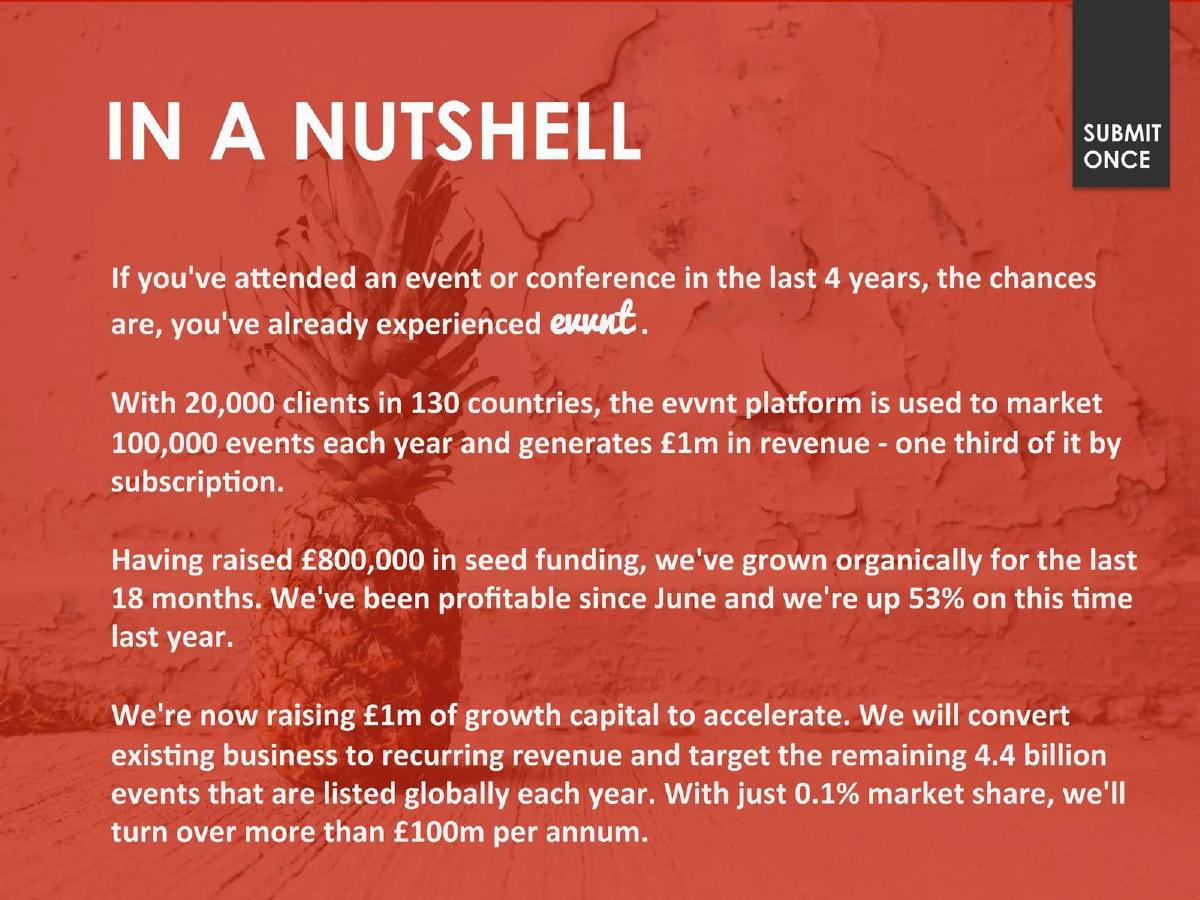
Event marketing platform raising £1m of growth capital. An "In a nutshell" text slide.
evvnt deck, slide 2. Exact stored slide matched to this analysis.
Our analysis: A plain-language claim with a start month but no year or measure.
Evidence and limitation: The slide gives no year for "June" and no measure for "profitable". "Up 53% on this time last year" doesn't say what is up (revenue is the likely reading). £1m revenue across 20,000 clients is about £50 per client, so most clients use it occasionally. "Grown organically" suggests no new funding was spent in the period, which fits the profitability claim.
What a founder can adapt: "Operating profit every month since June [year]; revenue up 53% on [same period] last year."
Supporting analysis
What the deck claims: "20,000 clients in 130 countries ... generates £1m in revenue - one third of it by subscription." "Having raised £800,000 in seed funding, we've grown organically for the last 18 months. We've been profitable since June and we're up 53% on this time last year."
Presentation choice: In a text slide, the sentence reads naturally, but it can't be checked.
When it does not fit: Don't give a month without the year.
Listed Florida cannabis producer and retailer. A summary slide of eleven icons dated July 2020.
Liberty Health Sciences deck, slide 3. Exact stored slide matched to this analysis.
Our analysis: A sustained claim with a date, reduced to an icon without a measure.
Evidence and limitation: The start date and slide date together cover about eleven months. The measure isn't named. Cannabis companies in the US often report adjusted EBITDA because US tax rules for the sector limit deductions, which makes net income much lower; which one this is matters a lot and the icon doesn't say. As a listed company, its quarterly filings would show the figures.
What a founder can adapt: Move it out of the icon grid: "Adjusted EBITDA positive every quarter since Q3 2019; net income [x]."
Supporting analysis
What the deck claims: Among the icons: "Profitable since August 2019." Also "Dispensaries 26", "Coming soon 14 upcoming dispensaries", "Monthly transactions 50,000+", "Team members 300+".
Presentation choice: Icon grids suit counts (stores, staff); a profitability claim needs a measure and an amount.
When it does not fit: Don't reduce a financial claim to an icon label.
Viewmarket deck, slide 5. Exact stored slide matched to this analysis.
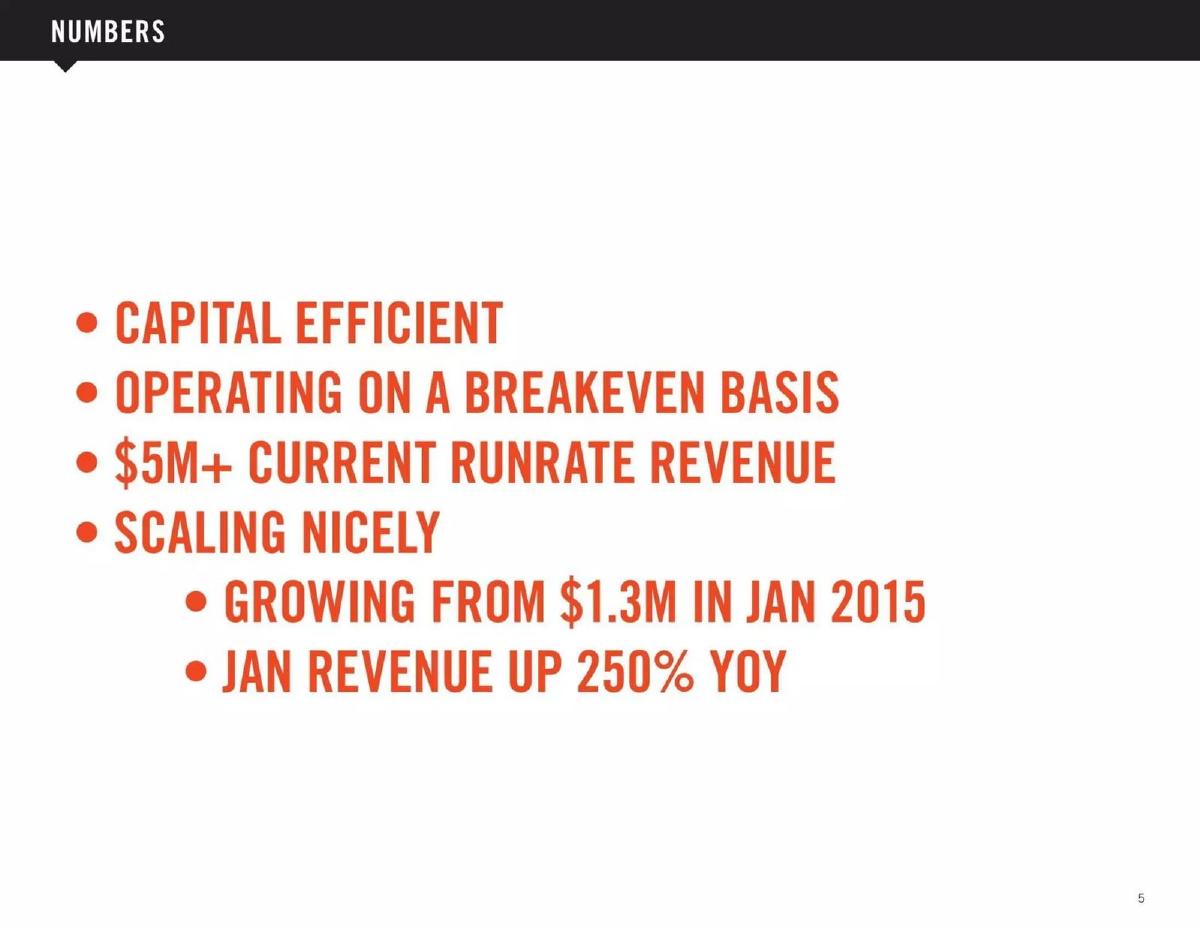
Our analysis: A break-even claim without measure or period, next to growth figures whose bases need interpretation.
Evidence and limitation: "$1.3M in Jan 2015" most likely means a run rate of $1.3M then (the same measure as "$5M+" now), which would be about 3.8× growth; if it meant $1.3M revenue in January alone, the current run rate would be lower than January's, so that reading doesn't fit. "Up 250%" means 3.5× the previous January. The slide date is not shown, so the length of the growth period is unknown. "Operating on a breakeven basis" doesn't say which measure or since when.
What a founder can adapt: "EBITDA break-even for [n] months to [month year]; run rate $5M+ in [month], up from $1.3M in Jan 2015."
Supporting analysis
What the deck claims: "Capital efficient." "Operating on a breakeven basis." "$5M+ current runrate revenue." "Scaling nicely: growing from $1.3M in Jan 2015; Jan revenue up 250% YoY."
Presentation choice: Combining break-even with fast growth is a strong point, but only if each figure is defined.
When it does not fit: Don't make readers work out which figures are run rates and which are monthly.
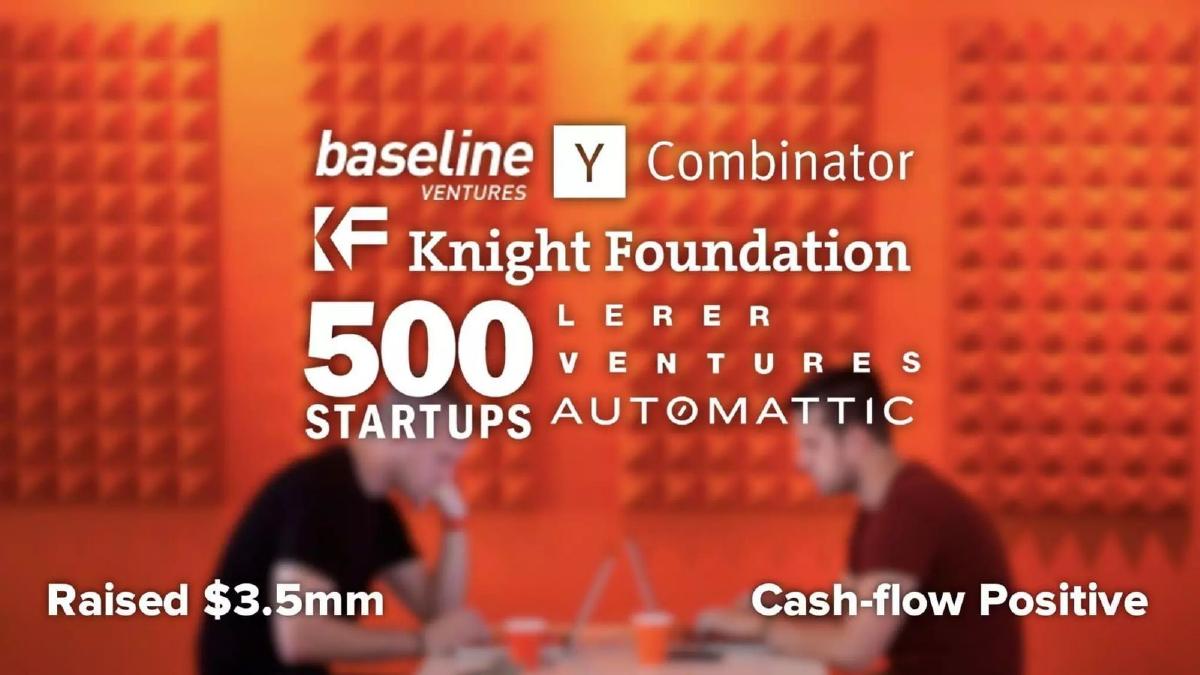
Local-advertising software for newspapers. A photo slide listing investors.
OwnLocal deck, slide 4. Exact stored slide matched to this analysis.
Our analysis: A bare label; useful signal, no detail.
Evidence and limitation: No period, measure detail or revenue is given. Placed next to the amount raised, the label implies the company doesn't need new money to survive, which is the point it makes. Whether it covers operating cash flow or total cash flow after investment, and for how long, is not stated.
What a founder can adapt: "Operating cash-flow positive for the last [n] months; $[x] cash in bank; $3.5M raised to date."
Supporting analysis
What the deck claims: Investors: Baseline Ventures, Y Combinator, Knight Foundation, Lerer Ventures, 500 Startups, Automattic. "Raised $3.5mm." "Cash-flow Positive."
Presentation choice: Next to a total raised, "cash-flow positive" tells a reader the round is optional, which affects how they read the ask.
When it does not fit: Don't state cash-flow positive with no period.
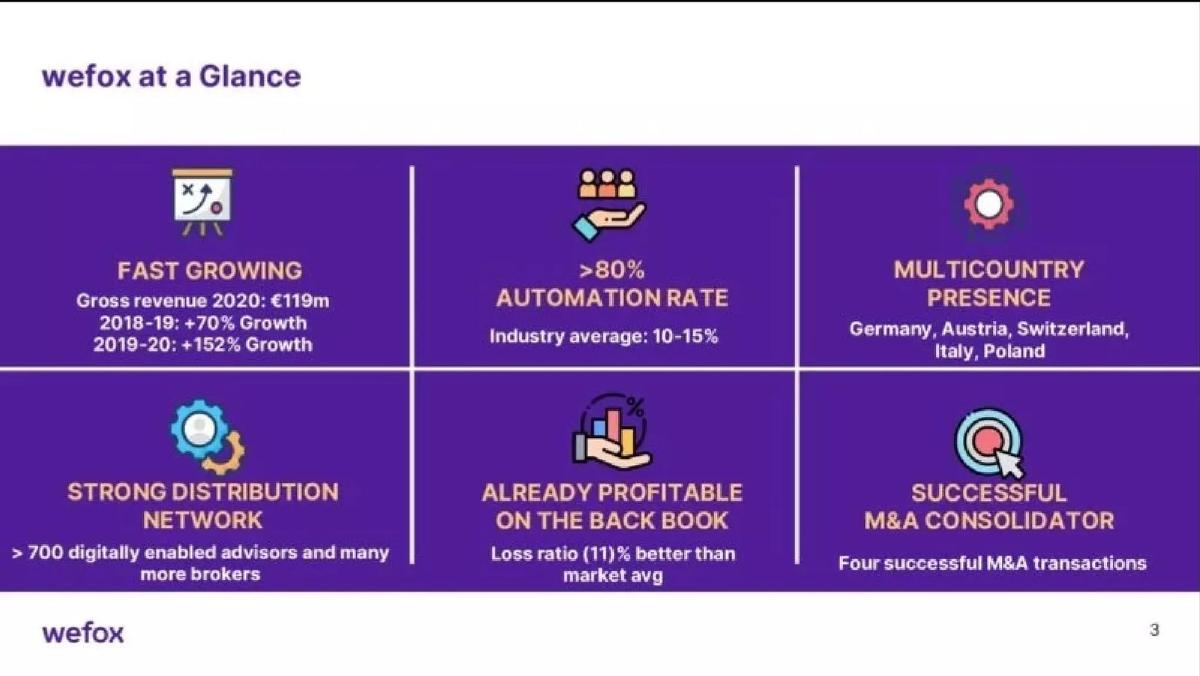
Digital insurance company operating in five European countries. A six-tile "wefox at a Glance" slide.
wefox deck, slide 3. Exact stored slide matched to this analysis.
Our analysis: A scoped profitability claim; the scope is stated, which is the useful lesson.
Evidence and limitation: "Back book" means existing policies, so the claim covers that portfolio, not the whole company, which was growing fast and spending on acquisition. That limit is worded honestly. The loss ratio (claims paid ÷ premiums) supports it, but the slide doesn't give wefox's loss ratio or the market figure, only the gap, and doesn't define whether "11% better" means 11 percentage points. "Gross revenue" for an insurer may include premiums passed to other insurers.
What a founder can adapt: Add the company-level figure and the loss ratio: "Back book contribution €[x]; company EBITDA €[y]; loss ratio [a]% vs market [b]%."
Supporting analysis
What the deck claims: "Gross revenue 2020: €119m; 2018-19: +70% Growth; 2019-20: +152% Growth." "Already profitable on the back book." "Loss ratio (11)% better than market avg."
Presentation choice: Saying "profitable on existing customers" rather than "profitable" tells a reader the model works while showing the company still spends to grow.
When it does not fit: Don't drop the scope word; "profitable" alone would claim more.
Apollo (open-source company deck) traction slide — slide 3
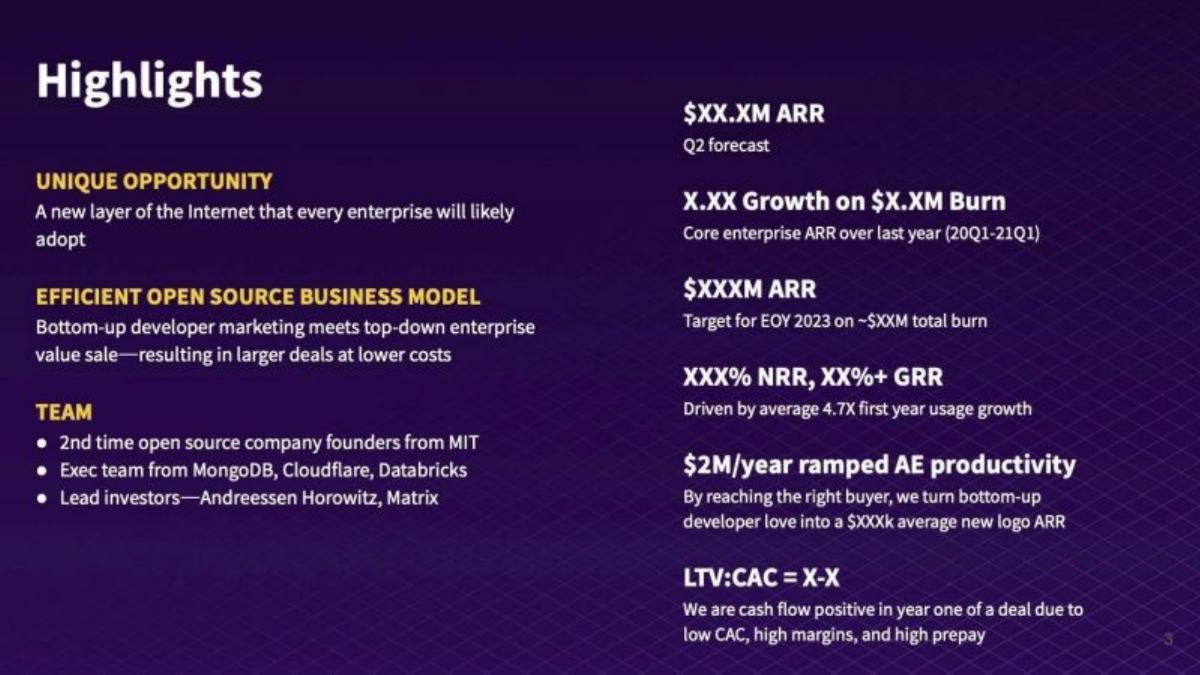
An open-source infrastructure company backed by Andreessen Horowitz and Matrix. A "Highlights" slide with every figure replaced by X, as circulated.
Apollo deck, slide 3. Exact stored slide matched to this analysis.
Our analysis: A per-customer cash claim beside company burn, correctly separated.
Evidence and limitation: The figures are redacted, so only the structure can be assessed. The cash-flow claim is per deal: each new customer pays back its acquisition cost in the first year, helped by upfront payment. It does not say the company is cash-flow positive — the same slide reports burn. Pairing growth with burn (growth per dollar spent) is a clear way to show efficiency when a company is not yet profitable.
What a founder can adapt: "Each deal cash-positive within [n] months (upfront billing); company burn $[x]/month; [growth] per $ burned."
Supporting analysis
What the deck claims: "X.XX Growth on $X.XM Burn." "$XXXM ARR target for EOY 2023 on ~$XXM total burn." "LTV:CAC = X-X: We are cash flow positive in year one of a deal due to low CAC, high margins, and high prepay."
Presentation choice: When a company is still losing money, showing growth per dollar burned, and per-deal payback, answers the efficiency question honestly.
When it does not fit: Don't let a per-deal cash claim be read as company profitability.
Whether each slide names the measure, the period, the scope and an amount.
Example
Claim
Measure
Period
Scope
Main gap
Careerist
~$500K monthly EBITDA
EBITDA
One month (unnamed)
Company
Month and duration
JibeHealth
$426K net income
Net income
2014
Company
Audit status; revenue basis
Apollo Medical
EBITDA positive
EBITDA
FY2015 and Q4 2015
Company
Amount; adjusted?
airSlate
Cash break-even; positive op cash flow
Cash flow
2012–16; 2020
Company
Profit vs cash conflated
Florence
Breakeven
Not stated
Not stated
Unclear (company or unit)
Measure; scope
Avocode
Breakeven since Sep '15
Not stated
Since Sep 2015
Company
Measure; slide date
evvnt
Profitable since June
Not stated
Since June (year missing)
Company
Year; measure
Liberty Health
Profitable since Aug 2019
Not stated
Since Aug 2019
Company
Measure; adjusted?
Viewmarket
Breakeven basis
Not stated
Not stated
Company
Measure; period
OwnLocal
Cash-flow positive
Cash flow
Not stated
Company
Period; amount
wefox
Profitable on back book
Not stated
Not stated
Existing policies
Company-level figure
Apollo (open source)
Cash-positive in year one
Cash flow
Per deal, year one
Each deal
Values redacted
Key Takeaways
"Profitable", "break-even" and "cash-flow positive" are different claims; say which one you mean.
Name the measure: EBITDA, operating profit, net income or operating cash flow.
Give the period: one month, a quarter, a financial year, or every month since a date.
Say the scope: the whole company, or one product, portfolio or customer cohort.
Give the amount and the revenue beside it, so a reader can see the margin.
Say whether the figures are audited, management accounts or a forecast.
Write your profitability line
Fill in each line before putting "profitable" or "break-even" on a slide.
Measure. EBITDA (adjusted or not), operating profit, net income, or operating cash flow.
Period. The month, quarter or year; or "every month since [date]".
Scope. The whole company, or one product, portfolio or customer group. If it is a part, give the company figure too.
Amount and revenue. The profit or cash figure, and revenue for the same period, so the margin can be read.
Basis. Audited accounts, management accounts, or a forecast.
Why raise. If profitable, say what the round pays for that profits can't.
Copyable framework: [Measure] of [amount] in [period] on [revenue] ([basis]); [scope]; positive every [month / quarter] since [date].
Illustrative example 1 — written by us
Before: Breakeven since Sep '15
After: Operating cash-flow break-even every month from Sep '15 to [month year], on $56K MRR ([basis]).
What improved: Our illustrative rewrite; not Avocode's wording. Bracketed values are placeholders. It adds the measure, the end date and the basis.
What this guide adds
The gross margin guide covers the share of revenue left after direct costs. The unit economics guide covers profit per customer. The financials guide covers forecasts. None explains how to word a claim that the whole company is profitable, breaking even or generating cash. This page covers that question.
Four claims that are often confused
EBITDA-positive: earnings before interest, tax, depreciation and amortisation are above zero. It excludes the cost of equipment and software that is capitalised, and interest on debt. Many companies also report "adjusted" EBITDA, which removes further items such as share-based pay; say which you use.
Operating profit or net income positive: profit after depreciation (operating profit) or after all costs including interest and tax (net income). Net income is the strictest accounting measure.
Operating cash-flow positive: more cash came in from operations than went out. Annual prepayments can make a company cash-flow positive while it reports a loss, and slow-paying customers can do the reverse.
Break-even: income and costs roughly equal. It is not a defined accounting term, so the measure (profit or cash) and the period must be stated.
Why the period and scope matter
One profitable month can follow a quarter of losses, and a seasonal business can be profitable for part of the year. "Every month since [date]" or "FY[year]" is far more informative than a label. Scope matters too: a company can be profitable on its existing customers or products while losing money overall because it spends on growth. Where that is the point being made, say so directly, and give the company-level figure next to it.
How we read each slide
We quote figures as shown and use only visible numbers in calculations. Where a slide gives profit and revenue, we divide to find the margin. We don't infer an accounting measure a slide doesn't name. Several decks come from listed companies; their slides are included because the wording choices are the same, but their disclosures follow securities rules that private startups don't face.
Common mistakes
Word without a measure. Profit and cash can move in opposite directions; name which one.
No period. One good month isn't a profitable company; give the months or quarters.
Month without a year. "Since June" can't be checked.
Part presented as whole. A profitable product or portfolio isn't a profitable company; state the scope.
Profitability and cash flow treated as one. Prepayments and capitalised costs separate them.
No amount. Give the figure and the revenue so the margin can be read.
Diagnostic checklist
Measure named (EBITDA, operating profit, net income, operating cash flow).
Adjusted or not, if EBITDA.
Period or "since [month year]" stated, with the slide date.
Corpus: published pitch deck teardowns on StartupFundraising.com. Founder-uploaded private decks are excluded.
Selection (2026-09-25): we searched stored slide text on slides 2–9 for profitable since, break-even, cash-flow positive, EBITDA positive, net income and operating profit, excluding disclaimer, non-GAAP notice, market and forecast slides, kept only slides with a stored slide image, and inspected twelve candidate images, all of which were kept. Considered but not used: Arkive p5 (the same slide as Careerist p6), Mandalay Digital p3 (listed-company revenue guidance of EBITDA break-even, a forecast), and Freetrade p2 (break-even as a future target).
Figures are quoted as shown in the stored slide images. Calculations are ours and use only visible numbers. Where a slide doesn't label a figure, related arithmetic is conditional.
Accounting terms are described in general; how a particular company calculated its figures is not known unless the slide says.
Review: stored slide text and images were checked on 2026-09-25 and matched to company, deck and slide number (editorial model review). No person has yet completed an editorial review of this page. We make no claim that any slide caused a fundraising outcome.